UV dust attenuation in normal star forming galaxies:
I. Estimating the ratio
Abstract
We analyze the dust attenuation properties of a volume-limited, optically-selected
sample of normal star forming galaxies in nearby clusters as observed by GALEX.
The internal attenuation is estimated using three independent indicators, namely: the
ratio of the total infrared to far-ultraviolet emission, the
ultraviolet spectral slope and the Balmer decrement.
We confirm that normal galaxies follow a relation
offset from the one observed for starburst galaxies.
This offset is found to weakly correlate with the
birthrate parameter, thus with the galaxy star formation history.
We study the correlations of dust attenuation with other
global properties, such as the metallicity, dynamical mass, ionized gas attenuation, H emission and
mass surface density.
Metal-rich, massive galaxies are, as expected, more heavily extinguished in
the UV than are small systems.
For the same gas metallicity normal galaxies
have lower ratio than starbursts,
in agreement with the difference observed in the relation.
Unexpectedly we find however that normal star forming galaxies
follow exactly the same relationship between metallicity and
ultraviolet spectral slope determined for starbursts,
complicating our understanding of dust properties.
This result might indicate a different dust geometry between
normal galaxies and starbursts, but it could also be due
to aperture effects eventually present in the IUE
starbursts dataset.
The present multiwavelength study allows us to provide some empirical relations
from which the total infrared to far ultraviolet ratio ()
can be estimated when far infrared data are absent.
1 Introduction
The presence of dust in galaxies represents one
of the major obstacles complicating a direct quantification of the star formation activity
in local and high redshift galaxies.
Absorption by dust grains reddens the spectra at short wavelengths
and modifies altogether the spectral energy distribution of galaxies.
Since the UV radiation is emitted by young stars
( yr) that are generally more affected by attenuation from surrounding dust clouds
than older stellar
populations, rest-frame UV observations can lead to incomplete and/or biased reconstructions
of the star formation activity and star formation history of
galaxies affected by dust absorption, unless proper corrections are applied.
In recent years our understanding of dust attenuation received a tremendous impulse from
studies of local starburst galaxies
(i.e.Calzetti et al. 1994; Heckman et al. 1998; Meurer et al. 1999; Calzetti 2001; Charlot & Fall 2000),
that were based on three indicators:
the ratio of the total infrared to far-ultraviolet emission (), the
ultraviolet spectral slope (determined from a power-law fit of the form
to the UV continuum spectrum in the range 1300 and 2600 , Calzetti et al. 1994) and the Balmer decrement.
The total-IR (TIR) to UV luminosity ratio method (i.e. Buat 1992; Xu & Buat 1995; Meurer et al. 1995, 1999) is
based on the assumption that a fraction of photons emitted by stars and gas are
absorbed by the dust. The dust heats up and subsequently re-emits the energy in the mid- and far-infrared.
The amount of UV attenuation can thus be quantified by means of an energy balance.
This method is considered the most reliable estimator of the dust attenuation in star-forming galaxies
because it is almost completely independent of the assumed extinction mechanisms
(i.e. dust/star geometry, extinction law, see Buat & Xu 1996; Meurer et al. 1999; Gordon et al. 2000; Witt & Gordon 2000).
When the spectrum is dominated by a young stellar population
the ultraviolet spectral slope , is found to have a weak dependence
on metallicity, IMF, and star formation history (Leitherer & Heckman 1995). Thus the difference between the observed
and the one predicted by models can be entirely ascribed to dust attenuation (Meurer et al. 1999).
However in systems with no or mild star formation activity the UV spectral slope can be
strongly contaminated by the old stellar populations, whose contribution increases
(flattens the UV continuum, Boissier et al. 2005). Thus the spectral slope of
mildly star forming systems could be intrinsically
different from the one of starburst galaxies, even in the absence of dust attenuation (Kong et al. 2004).
Meurer et al. (1999) have shown that in starburst galaxies the total far-infrared to ultraviolet luminosity ratio
correlates with the ultraviolet spectral slope,
(commonly referred to as the IRX-UV relation).
They pointed out that this relation
allows reliable estimates of the attenuation
by dust at ultraviolet wavelengths based on .
The Balmer decrement gives an estimate
of the attenuation of ionized gas and not of the stellar continuum as in the previous two methods.
It is based on the comparison of
the observed H/H ratio with its predicted value
(2.86 for case B recombination, assuming an electronic density and temperature
; e.g., Osterbrock 1989).
Calzetti et al. (1994) found a significant correlation
between the ultraviolet spectral slope and the Balmer decrement H/H.
Starting from this empirical relation they obtained an
attenuation law (known as the Calzetti attenuation law) often adopted
to correct UV observations for dust attenuation in absence of both far-infrared observations and estimates
of the ultraviolet spectral slope (Steidel et al. 1999; Glazebrook et al. 1999).
Unfortunately the above empirical relations have been established
only for starburst galaxies and they seem not to hold for normal star forming galaxies.
Recently, Bell (2002) suggested that quiescent galaxies deviate
from the IRX-UV relation of starburst galaxies, because they tend to have
redder ultraviolet spectra at fixed total far-infrared to ultraviolet luminosity ratio.
Kong et al. (2004) confirmed this result and interpreted the different behaviour of starbursts and normal galaxies
as due to a difference in the star formation histories.
They proposed that the offset from the starburst
IRX-UV relation can be predicted using the birthrate parameter (e.g. the ratio of the
current to the mean past star formation activity).
However an independent observational confirmation of the
correlation between the distance from the starburst IRX-UV relation and the
birthrate parameter has not been obtained so far (Seibert et al. 2005).
Even the Calzetti law does not seem to be universal.
Buat et al. (2002) showed that for normal star forming galaxies
the attenuation derived from the Calzetti law is 0.6 mag
larger than the
one computed from the ratio and their result
has been recently confirmed by Laird et al. (2005).
Why do normal star-forming galaxies behave differently from starbursts?
Do normal galaxies follow different empirical relations that can be exploited
to correct for dust attenuation in absence of far infrared observations?
If this is the case, is there a transition between starburst and normal galaxies?
Which physical parameters drive it?
Answering these questions will be important for a better
understanding of the interaction of dust and radiation specifically in
nearby dusty star forming galaxies, but it also has direct
consequences for our understanding and interpretation of galaxy
evolution in a general context.
Firstly it seems mandatory to characterize the dust attenuation properties
of normal galaxies, to compare them with the ones of starbursts and to derive new recipes for the
UV dust attenuation correction.
This topic came once again to the fore with the launch of the Galaxy Evolution Explorer (GALEX).
This satellite is delivering to the community an unprecedented amount of UV data
on local and high redshift galaxies that require corrections for
dust attenuation but currently lack far-infrared rest-frame data.
The time is ripe to explore new methods for correction of these data,
that might provide new insights on galaxy evolution.
Whenever they can be combined with other data, GALEX observations provide the best available ultraviolet data
for studying the dust attenuation properties of galaxies.
Multiwavelength photometric and spectroscopic
observations are in fact mandatory in order to: determine metallicity,
ionized gas attenuation ()), luminosity and mass,
test the validity of the relations followed by starbursts (Heckman et al. 1998), explore
relations that might prove useful to correct ultraviolet magnitudes and to compare them
with various models of dust attenuation.
Recent extensive spectroscopic and photometric surveys, like the Sloan Digital
Sky Survey (SDSS, Abazajian et al. 2005) and the Two Degree Field Galaxy Redshift Survey (2dF, Colless et al. 2001)
have opened the path to studies of fundamental physical parameters based on
enormous datasets.
However, spectroscopic observations of nearby galaxies suffer from strong aperture effects,
making these datasets not ideal for the purpose of the present investigation.
In fact, Kewley et al. (2005) have recently shown that aperture effects produce both systematic and
random errors on the estimate of star-formation, metallicity and attenuation.
To reduce at least the systematic effects they suggest selecting only
samples with fibres that capture 20% of the light.
This requires and for SDSS and 2dF respectively: too distant to
detect both giant and dwarf star forming systems with GALEX and IRAS.
Although significantly smaller than the SDSS, the dataset we have been building up
over the last 10 years
with data taken over a large stretch of the electromagnetic spectrum for
few thousand galaxies in the local universe
(worldwide available from the site GOLDMine; Gavazzi et al. 2003)
turns out to be appropriate for the purposes of the present investigation.
It includes drift-scan mode integrated spectra,
narrow band H and broad band optical and near-infrared imaging for
a volume limited sample of nearby galaxies in and outside rich clusters.
The combination of GALEX and IRAS observations with these ancillary data
allows us to study the dust attenuation properties in a sizable sample of
normal star forming galaxies not suffering from the aperture bias
and to compare observations with model predictions.
In this first paper we investigate the relations between dust attenuation and global
galaxy properties and compare them with the ones observed in starburst galaxies.
The aim of this work is to provide some empirical relations based
on observable quantities (thus model independent) suitable for deriving
dust attenuation corrections when far infrared data are not available.
For this reason all relations
obtained throughout this paper will be given as a function of ,
the observable that we consider the best dust attenuation indicator.
We choose not to transform into a (model dependent)
estimate of the far ultraviolet extinction ,
leaving the reader free to choose his/her preferred dust model
(i.e. Meurer et al. 1999; Buat et al. 1999, 2002, 2005; Gordon et al. 2000; Panuzzo et al. 2003; Burgarella et al. 2005, Inoue et al. in preparation).
Throughout the paper we assume that quantities are related linearly and
residual plots are presented in order to test the validity of this hypothesis.
Moreover, since we are looking for new recipies to estimate the ratio,
this quantity has to be considered as the dependent variable,
implying the use of an unweighted simple linear fit
to estimate the best fitting parameters (Isobe et al. 1990).
A forthcoming paper will be focused on the comparison between models and observations
hoping to gain a better understanding on the physics of dust attenuation and to study new recipes
useful to convert into .
2 The Data
2.1 The optically-selected sample
The analysis presented in this work is based on an optically selected sample of
late-type galaxies (later than S0a) including
giant and dwarf systems extracted from the Virgo Cluster Catalogue (VCC, Binggeli et al. 1985)
and from the CGCG catalogue (Zwicky et al. 1961).
The data include square degrees covering
most of the Virgo, Abell1367 and Abell262 clusters,
the southwest part of the Coma cluster and part of the Coma-A1367 supercluster
(11h30m R.A. 13h30m; ) observed in spring 2004
as part of the All-sky Imaging Survey (AIS) and of the Nearby Galaxy Survey (NGS) carried out by GALEX
in two UV bands: FUV ()
and NUV ().
Details of the GALEX instrument and characteristics can be found in
Martin et al. (2005) and Morrissey et al. (2005).
Our sample has the quality of being selected with the criterion of optical completeness.
All galaxies brighter than a threshold magnitude are selected in all areas.
In Coma-A1367 supercluster and A262 cluster all galaxies brighter than =15.7 were selected
from the CGCG catalogue (Zwicky et al. 1961). The Virgo region contains all galaxies brighter
than =18 from the VCC catalogue (Binggeli et al. 1985).
We thus consider our sample an optically selected, volume limited sample.
We include in our analysis all late-type galaxies,
detected in both NUV and FUV GALEX bands and in
both 60 and 100 IRAS bands (157 objects).
Whenever available, we extracted UV fluxes from the deep NGS images, obtained with
a mean integration time
of 1500 sec, complete to 21.5 in the NUV and FUV.
Elsewhere UV fluxes have been extracted from the shallower
AIS images ( 70 sq. degrees), obtained with a mean integration time of 100 sec,
complete to 20 in both the FUV and NUV bands.
All UV images come from the Internal Data Release v1 (IR1.0).
UV fluxes were obtained by integrating GALEX images
within elliptical annuli of increasing diameter up to the optical B band 25 mag
arcsec-2 isophotal radii, consistently
with the optical and near-IR images. Independent measurements of the same
galaxies obtained in different
exposures give consistent photometric results within 10 % in the NUV and 15%
in the FUV in the AIS, and a factor of two better for bright (NUV 16) galaxies.
The uncertainty in the UV photometry
is on average a factor of 2 better in the NGS than in the AIS, particularly
for faint objects. The typical uncertainty in the IRAS data is 15% (Boselli et al. 2003).
UV and far-infrared data have been combined to multifrequency data.
These are optical and near-IR H imaging (mostly from Gavazzi et al. 2000, 2005; Boselli et al. 2003), optical drift-scan
spectra (Gavazzi et al. 2004; Gavazzi et al. in prep.) and H imaging
(Boselli & Gavazzi 2002; Boselli et al. 2002a; Gavazzi et al. 1998, 2002b; Iglesias-Páramo et al. 2002; Gavazzi et al. in prep.),
great part of which are available from the
GOLDMine galaxy database (Gavazzi et al. 2003) (http://goldmine.mib.infn.it).
From the 157 galaxies selected we exclude Active Galactic Nuclei (AGN). AGNs have been selected using either
the classification provided by NED, if available, or by inspection to the integrated spectra of
Gavazzi et al. (2004): we exclude galaxies with
(Kauffmann et al. 2003).
This criterion reduces the sample to 128 galaxies, spanning a range of
six magnitudes in B band (-22-16) and of three orders of magnitude in mass111
Computed using the relation between and by Gavazzi et al. (1996) ().
Unfortunately ancillary data are not available for all galaxies observed by GALEX, we
thus further divided the data in two subsamples.
Sixty six galaxies in the primary sample have all the necessary complementary
data (e.g. H photometry, H/H ratio, metallicity, H-band photometry;
see Gavazzi et al. 2000, 2002a, 2002b, 2004 for the selection criteria adopted in each survey).
The remaining 62 galaxies form the secondary sample.
We cannot exclude a possible
contamination of AGN in the secondary sample, since no spectra are available for these objects.
In all figures objects belonging to the primary sample will be indicated with filled circles
while the secondary sample as empty circles.
Since only galaxies belonging to the primary sample are present
in all the plots analyzed in the presented work, all correlations will be
quantified using only the primary sample.
Data from UV to near-IR have been corrected for Galactic extinction
according to Burstein & Heiles (1982).
We assume a distance of 17 Mpc for the members
of Virgo Cluster A, 22 Mpc for Virgo Cluster B, and 32 Mpc for objects
in the M and W clouds (Gavazzi et al. 1999).
Members of the Cancer, A1367, and Coma clusters are assumed to
lie at distances of 65.2, 91.3, and 96 Mpc, respectively.
Isolated galaxies in the Coma supercluster are assumed
at their redshift distance, adopting = 75 .
2.2 The starburst sample
In order to compare the properties of our sample with starbursts, we compile a dataset of starburst galaxies observed by IUE from the sample of Calzetti et al. (1994). We consider 29 galaxies, excluding AGNs and galaxies that have not been observed by IRAS at 60 or 100 m. Complementary data such as FIR, H fluxes and Balmer decrements are taken from Calzetti et al. (1995), metallicities come from Heckman et al. (1998) and H-band photometry (available only for 18 galaxies) from (Calzetti 1997). Excluding the far infrared fluxes, all these quantities are obtained within an apertures of , consistent with IUE observations Calzetti et al. (1994). Thus we stress that aperture effects could strongly affect any comparison with normal galaxies for which all data are homogeneously integrated values. First of all, if the UV emission is more extended than IUE field of view the ratio is overestimated222However Meurer et al. (1999) argued that the majority of UV flux for their starburst sample lies within the IUE aperture. In addition, even when physical quantities are obtained in the same IUE apertures, the presence of age and metallicity gradients in galaxies makes not trivial any comparison with the integrated values obtained for normal star forming galaxies (Kewley et al. 2005). All the observables, but the ultraviolet spectra slope , are calibrated in a consistent way with our sample of normal galaxy. The ultraviolet spectral slope of starbursts is obtained by fitting IUE spectra (Calzetti et al. 1994), while for GALEX observations it comes from the FUV-NUV color index (see next Section). However, as shown by Kong et al. (2004), these two calibrations are consistent each other and do not introduce any systematic difference between the two samples.
3 The relation for normal star-forming galaxies
Meurer et al. (1999) have shown that the ratio of far infrared to far ultraviolet luminosity tightly correlates with the UV colors of starburst galaxies. This relation, known as the infrared excess-ultraviolet (IRX-UV) relation, is often presented as vs. relation. As discussed in the introduction, we will refer throughout this paper to the ratio as the best indicator of UV dust attenuation and we will calibrate on it all the following relations. In order to determine the dust emission, we compute the total infrared flux emitted in the range 1-1000 , following Dale et al. (2001):
| (1) |
where is the far-infrared flux, defined as the flux between 42 and 122 (Helou et al. 1988):
| (2) |
and and are the IRAS fluxes measured at 60 and 100 (in Jansky). The total infrared luminosity is thus:
| (3) |
The parameter as determined from GALEX colors is very sensitive to the galaxy star formation history (see for example Calzetti et al. 2005). For this reason we assume throughout this paper as defined by Kong et al. (2004):
| (4) |
where and are the near and far ultraviolet observed fluxes respectively (in
), and
FUV and NUV are the observed magnitudes.
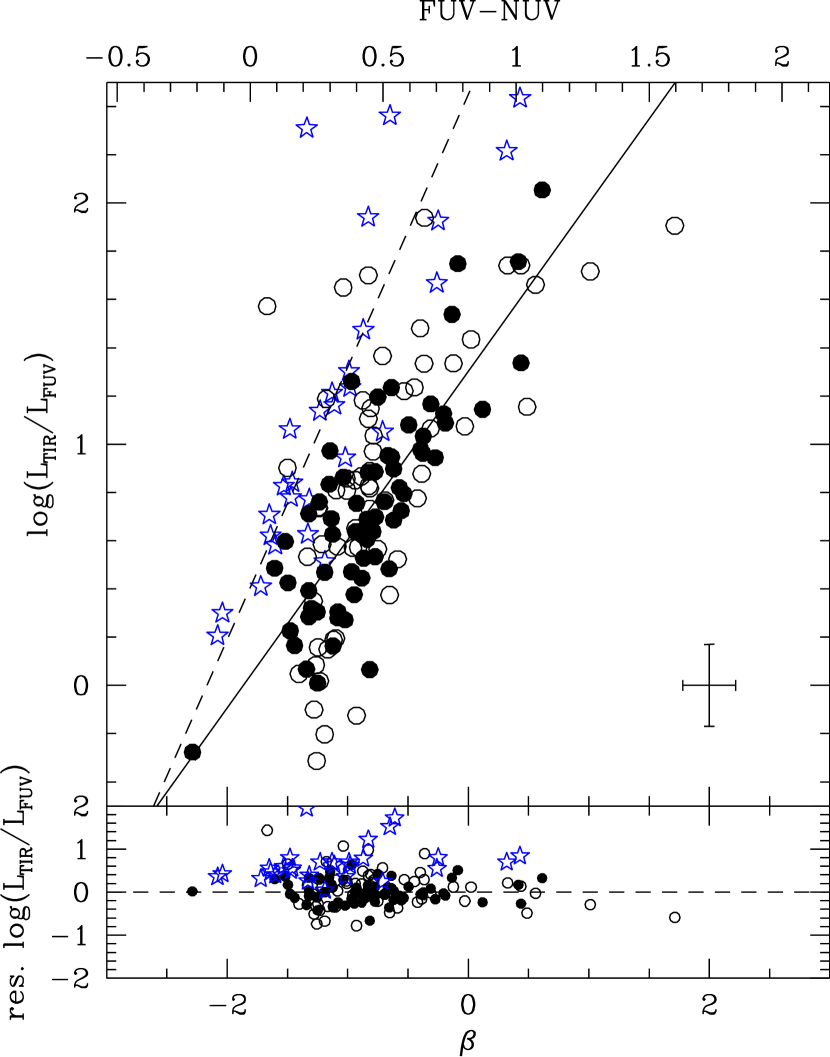
The relationship between the ratio of total infrared luminosity () obtained from (3)
to the far-ultraviolet fluxes and the UV spectral slope (or the FUV-NUV color) for our sample of
nearby star forming galaxies is given in Fig.1.
Several functional forms of the relation can be found in the literature
(i.e. Meurer et al. 1999; Kong et al. 2004); we simply adopt a linear fit:
. This functional form is
consistent with other previously proposed for , while it diverges for .
Since the majority of normal and starbursts galaxies have
our choice is justified. This represents the simplest and less parameter dependent way
to study the relation between two quantities.333We tested this hypothesis fitting our data with functional
forms similar to the ones proposed by Meurer et al. (1999) and Kong et al. (2004): no significative improvement in the
scatter of this relation is obtained.
We find a strong correlation (Spearman correlation coefficient 0.76 for the primary sample and 0.65
for the secondary sample, both corresponding to a probability 99.9% that the two variables are correlated)
between the total infrared to far ultraviolet ratio and the spectral slope, but significantly different from
the one observed for starburst galaxies
(dashed line in Fig.1; Meurer et al. 1999). A test rejects at a confidence level higher
than 99.9%, that the two samples follow the same relation.
The best linear fit for our primary sample (solid line in Fig.1) is:
| (5) |
The uncertainty in the estimate of the using equation (5) is dex for the primary sample but it increases to dex, if we consider the whole sample (e.g. primary and secondary samples), consistent with the mean uncertainty observed for starburst galaxies (Meurer et al. 1999). A large contribution ( dex) to the observed scatter in Eq.(5) is due to the uncertainty on the estimate of and . This result confirms once more that the relation for normal galaxies deviates from the one observed for starbursts, as pointed out by previous studies of nearby galaxies (i.e. Bell 2002; Kong et al. 2004; Boissier et al. 2005; Buat et al. 2005; Seibert et al. 2005; Burgarella et al. 2005, Boissier et al. in prep.) and individual HII regions in nearby galaxies (Calzetti et al. 2005).
3.1 The dependence on the birthrate parameter
What physical mechanisms drive the difference observed in the between normal star forming galaxies and starbursts? Recently Kong et al. (2004) interpreted the offset as an effect of the different star formation history experienced by galaxies and proposed that the distance from the starburst IRX-UV can be predicted using the birthrate parameter (e.g. the ratio of the current to the mean past star formation activity, Kennicutt et al. 1994). In order to test if the perpendicular distance from the relation for starbursts correlates with the star formation history of normal galaxies, we compute the birthrate parameter following Boselli et al. (2001):
| (6) |
where is the fraction of gas that stellar winds re-injected into the interstellar medium during their lifetime ( 0.3, Kennicutt et al. 1994), is the age of the galaxy (that we assume 12 Gyr), is the dark matter contribution to the ratio at the optical radius (assumed to be 0.5; Boselli et al. 2001). We compute the H-band luminosity following Gavazzi et al. (2002a):
where is the distance to the source (in Mpc), and the SFR from the H luminosity (corrected for contamination and for dust extinction using the Balmer decrement, see Appendix A) following Boselli et al. (2001):
| (7) |
Fig.2 shows the relation between the birthrate parameter (eq.6) and the distance from the relation for starburst galaxies. The two quantities are correlated (0.40, corresponding to a correlation probability 99.8%) but with a large scatter. Given the value of observational uncertainties, it is not worth trying to use the observed trend to reduce the dispersion in the relation for normal galaxies. This result confirms that part of the dispersion in the relation for normal star forming galaxies appears an effect of the different star formation history experienced by galaxies, as proposed by Kong et al. (2004).
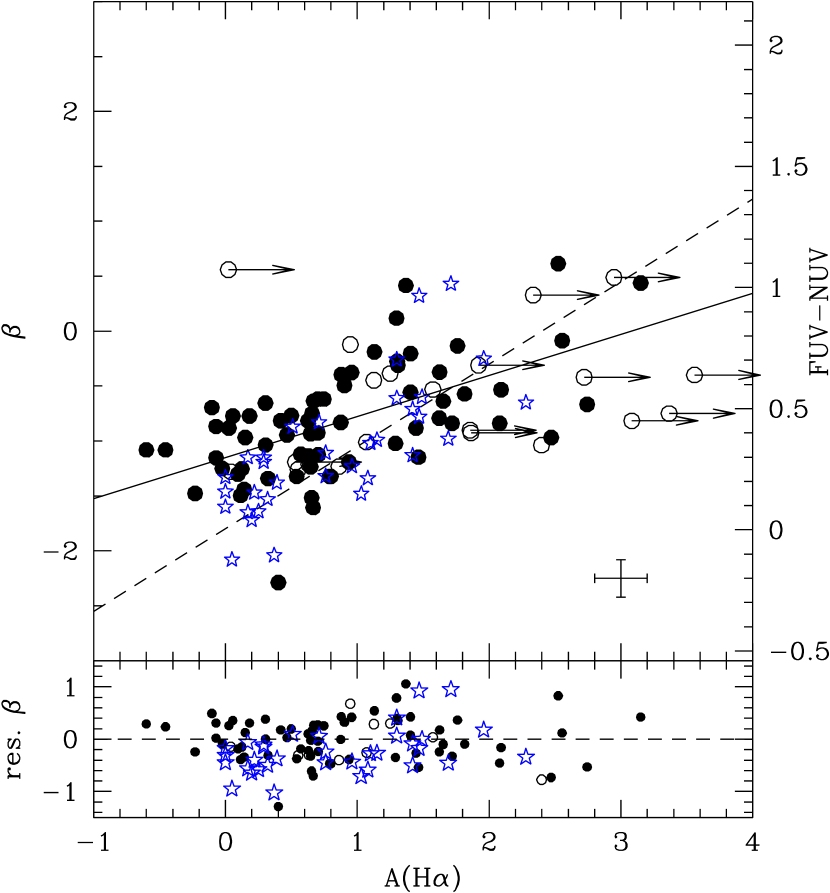
4 The -) relation
Calzetti et al. (1994) found a strong relationship between the ultraviolet spectral slope and the Balmer decrement H/H. For our starburst sample these two quantities are correlated (0.81) as follows (see also blue stars in Fig.3):
| (8) |
This empirical relation was used by Calzetti et al. (1994) to deduce an attenuation law (the Calzetti law), often applied to high redshift galaxies (i.e. Steidel et al. 1999; Glazebrook et al. 1999). Contrary to the relation the Calzetti law has not yet been tested for a sample of normal star forming galaxies. Buat et al. (2002) showed that for normal star forming galaxies the attenuation derived from the Calzetti law is 0.6 larger than the one computed from ratio. This result has been recently confirmed by Laird et al. (2005) on star forming galaxies at 1. In order to check the Calzetti law on our sample we use the measure of the H/H described in Appendix A. Fig. 3 shows the relation between and ) for our sample (empty and filled circles). For the primary sample we obtain 0.58 (99.9%) and:
| (9) |
flatter than for starburst galaxies (see Fig.3). At low normal galaxies show on average a less steep ultraviolet spectral slope than starbursts. In addition normal galaxies with the same value of span a range of 1 mag in ). At higher attenuation the two samples appear consistent. Our result suggest that the Calzetti law cannot be applied to normal galaxies. On the contrary, the relation between and ) for normal galaxies, could be used to obtain a new attenuation law.
5 Relations between dust attenuation indicators and global properties.
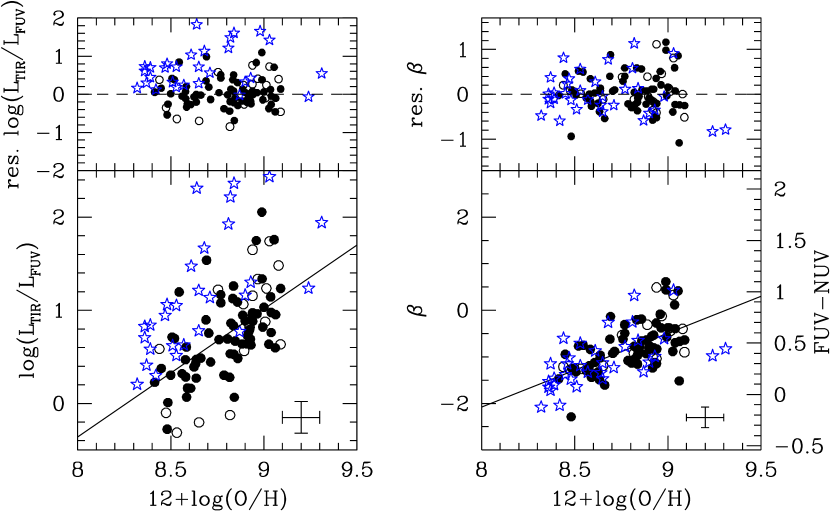
5.1 Metallicity
Heckman et al. (1998) have shown that the ultraviolet spectral slope and metallicity of starbursts are well correlated. To determine the metal content of our galaxies we average five different empirical determinations based on the following line ratios: (Zaritsky et al. 1994; McGaugh 1991), (Kewley & Dopita 2002), (van Zee et al. 1998) and (Dutil & Roy 1999). The mean uncertainty in the abundances is . In Fig. 4 we study the relationship between the gas metallicities and the ratio (left-panel) and (right-panel) for normal star forming and starburst galaxies. For normal galaxies the ratio correlates (0.59, 99.9%) with the gas abundance:
| (10) |
with a dispersion of in .
As for the relation normal galaxies differ from starbursts.
At comparable metallicity normal galaxies show a lower (lower attenuation) than
starbursts, in agreement with the recent result by Boissier et al. (2004)
who studied radial extinction profiles of nearby late-type galaxies
using FOCA and IRAS observations.
Unexpectedly we find however that normal star forming galaxies
follow exactly the same (significant, , 99.9%) relationship between metallicity and
ultraviolet spectral slope determined for starbursts by Heckman et al. (1998)
(see right panel of Fig.4).
This might indicate that even though a normal and a starburst galaxy
with similar gas metallicity have similar
UV spectral slopes, they suffer from a significantly different dust attenuation,
perhaps suggesting a different dust geometry (Witt & Gordon 2000).
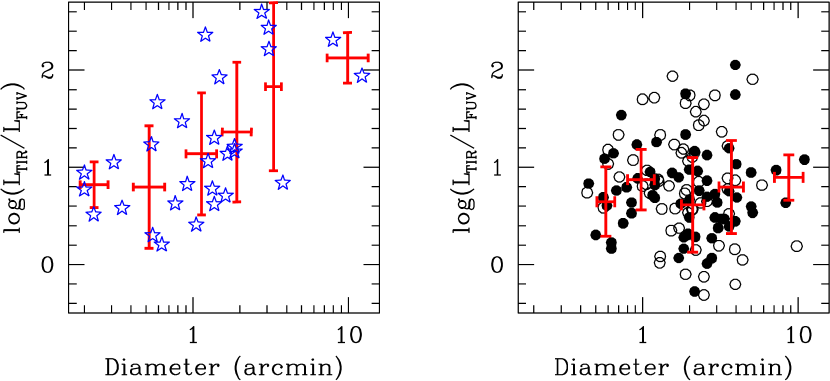
However we stress that this effect might occur due
to aperture effects in the IUE data: while is not significantly
contaminated by aperture effects, the ratio could be overestimated
producing the observed trend (the total infrared luminosity is obtained by
integrating the IRAS counts over the full galaxy extension, while the ultraviolet one
is taken from IUE’s significantly smaller aperture ).
This idea could be supported by the correlation (, 99.9% see Fig.5) observed
between the starbursts’ optical
diameters and the ratio, completely absent in our sample of normal galaxies
(, 25%).
GALEX observations of starburst galaxies will rapidly solve this riddle.
We also checked the dependence of the dust attenuation on gas to dust ratio.
Unfortunately, given the large errors on the estimate of the dust mass,
we only obtain a weak relationship between the two quantities (see Appendix B).
5.2 Luminosity
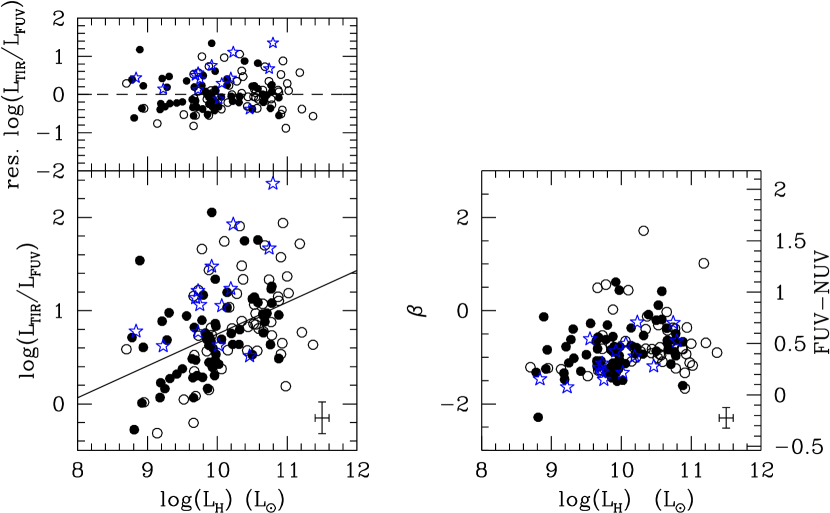
Since it is well known that the metallicity of normal galaxies strongly correlates with galaxy luminosity (e.g. Skillman et al. 1989; Zaritsky et al. 1994) and mass (e.g. Tremonti et al. 2004), it is worth considering the correlation between attenuation and galaxy luminosity. Fig.6 shows the relationships between the dust attenuation indicators and and the H-band luminosity. The infrared to far ultraviolet ratio correlates (0.49, 99.9%) with the total H-band luminosity:
| (11) |
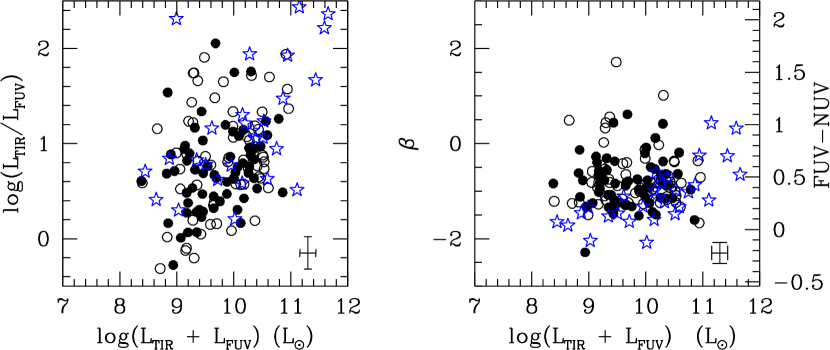
The dispersion of this relation is in . Since the H-band luminosity is proportional to the dynamical mass (Gavazzi et al. 1996), this implies a relationship between dust attenuation and dynamical mass. Also in starbursts the total H-band luminosity is correlated (0.37, 99.5%) with the ratio and the great part of starbursts appear offset (to 99% confidence level) from the relation of normal galaxies. On the contrary, no difference is observed between the two samples in the - plot, in agreement with what observed for metallicity. Finally Fig.7 shows the relation between the bolometric luminosity () and the dust attenuation, computed assuming that the UV emission is absorbed by dust and emitted in the far infrared. The correlation coefficient (0.31, 98%) indicates that the two quantities correlate, as for starburst galaxies (Heckman et al. 1998). This is not the case if we examine the relation between the ultraviolet spectral slope and the bolometric luminosity (Fig.7 right panel): while there is no correlation (, 20%) for our sample of normal galaxies, a clear relation (, 99.9%) holds for starbursts. Starbursts with higher bolometric luminosity (high TIR emission) show lower ultraviolet slope, consistent with the idea that high TIR emission corresponds to high attenuation (low ).
5.3 Surface brightness
Wang & Heckman (1996) interpreted the increase of dust attenuation with rotational velocity (or mass) as due to the variations in both the metallicity and surface density of galactic disk with galactic size. Fig.8 shows the variation of the effective H-band surface brightness (defined as the mean surface brightness within the radius that contains half of the total galaxy light) and the dust attenuation. The two quantities are strongly anti-correlated (-0.63, 99.9%):
| (12) |
with a scatter of in : 1.2 lower than the value obtained for H-band luminosity and consistent with the one obtained for the gas metallicity. Unfortunately in this case we cannot compare the behaviour of normal galaxies with the one of starbursts due to the lack of an estimate of for the starbursts. Does this relation indicate that UV dust extinction depends on the thickness of stellar disk, or does it follows from the correlation between attenuation and star formation surface density? To attack this question we determine the SFR density (defined as the ratio between the SFR determined from H (eq.7) and optical galaxy area). Fig.9 shows the relation between the SFR density and . The two quantities are correlated (0.44, 99.9%) with a dispersion of in , 1.2 larger than the one observed for the mean H-band surface brightness444The difference between the two relations does not change if instead of the half-light radius, we use the total radius to estimate . Since the contribution of observational uncertainties to the scatter in the two relations is the same (), our result might suggest that the UV attenuation is primarily correlated with the thickness of stellar disk, supporting the hypothesis of Wang & Heckman (1996) that both gas metallicity and star surface density are directly connected with the physical properties of dust (i.e. quantity and spatial distribution).
5.4 ratio
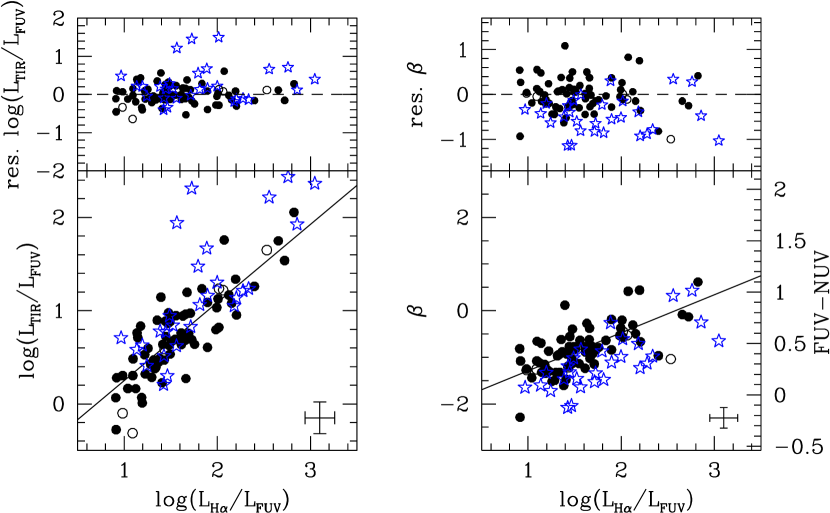
Buat et al. (2002) suggested that the ratio could be another potential attenuation indicator but they found a scattered correlation between and , confirmed by Bell (2002). This correlation is expected since both H and UV emission are star formation indicators. The H luminosity comes from stars more massive than 10 M⊙ and it traces the SFR in the last yr while the UV luminosity comes from stars of lower mass (M) and it can be used as an indicator of the SFR in the last yr. This means that under the condition that the star formation is approximately constant in the last yr the ratio (corrected for attenuation) should be fixed. Thus the ratio between the extinction corrected and the observed should be a potential attenuation indicator. In Fig.10 we analyze the relationship between the dust attenuation and the ratio, where is the H luminosity corrected for dust attenuation using the Balmer decrement and for the contamination of . The two quantities turn out to be strongly correlated (0.76, 99.9%):
| (13) |
The dispersion around this relation is in ,
consistent with the one
observed for the relation.
The high correlation and low scatter between the two quantities
is expected since the two variables are mutually related: the FUV luminosity appears
in both axes and and are known to be correlated (Kewley et al. 2002),
explaining why in the left panel of Fig.10 starbursts and normal galaxies show the same trend.
The right-panel of Fig.10 shows the relation between the ultraviolet slope
and the ratio.
In this case starbursts and normal galaxies behave differently:
at any given starbursts have an higher
than normal galaxies, consistent with
what expected for galaxies experiencing a burst of star formation (Iglesias-Páramo et al. 2004).
A secure determination of the Balmer decrement for large samples is still a hard task, especially
at high redshift, thus
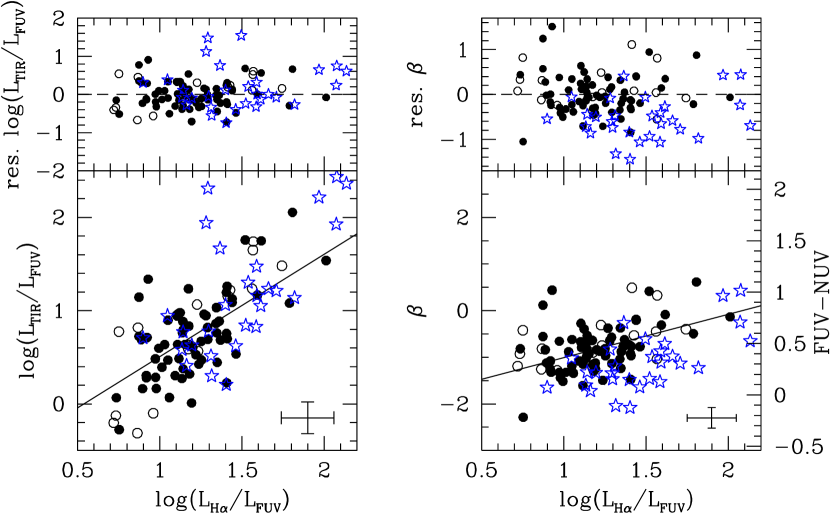
we look for a relation similar to Eq.(13) using the observed H luminosity ().
The and ratios are
yet correlated (see Fig.11) but the correlation coefficient is lower than the previous case (0.49, 99.9%).
The best linear fit gives:
| (14) |
with a mean absolute deviation of (3.3 higher than for Eq.14).
6 A cookbook for determining ratio in optically-selected galaxies
In this paper we investigated the relations between dust attenuation,
traced by the ratio, and other global properties of normal star forming galaxies.
Furthermore we compared the dust attenuation in normal and starbursts galaxies using multiwavelength datasets.
The amount of dust attenuation is found to correlate with the UV colors, gas metallicity,
mass and mean surface density but, generally speaking, differently for normal and starburst galaxies.
Determine whether this difference is real or is due to aperture effects requires
the analysis of GALEX observations for a sample of starburst galaxies.
The dispersion in the relation
correlates with the birthrate parameter ,
suggesting that the observed scatter is, at least partly, due to differences in the star formation history.
These results stress that estimating the UV dust attenuation, and consequently
the star formation rate of normal galaxies (at high redshift in particular) is highly uncertain
(50%)
when rest-frame far infrared observations are not available.
Moreover the sample selection criteria could strongly affect its properties, as
recently pointed out by Buat et al. (2005) and Burgarella et al. (2005).
They studied the dust attenuation properties and star formation activity in a UV and in a FIR
selected sample, showing that the former shows correlations
with global galaxy properties, such as mass and bolometric luminosity,
that the FIR selected sample does not.
Their results stress that the dust attenuation
properties are very heterogeneous and that cannot be derived in a robust
manner when far infrared observations are not available.
However the present investigation has shown that
among optically-selected samples of normal galaxies with no nuclear activity a number of
empirical relations exists,
allowing to derive the ratio (and its uncertainty).
Once the attenuation at UV is determined it can be transformed to any other ,
only knowing the shape of the attenuation law and dust geometry
(i.e. Calzetti et al. 1994; Gavazzi et al. 2002a; Boselli et al. 2003).
In Table 1 we list all the relations, their associated r.m.s., mean absolute
deviation from the best fit (m.a.d.)555
The mean absolute deviation is less sensitive to the contribution of outliers than the standard deviation.
For a Gaussian distribution the mean absolute deviation (m.a.d.) is , while it is lower (higher)
for a heavier (lighter) tailed distribution. As shown in Table 1 the values obtained for r.m.s. and m.a.d. are consistent
with the ones expected for a Gaussian distribution and
the Spearman correlation coefficient.
Before we proceed describing our recipes, we have to investigate whether the scatter
in these relations is physical or is only driven by
observational uncertainties. In the latter case, in fact, our cookbook
would not be very useful, since it would be valid only for observations with the
same uncertainties than our datasets.
For H-band luminosity, H-band surface brightness, ratio and metallicity
the contribution of observational uncertainties to the observed
scatter varies from 18% (r.m.s.) for to 40% (r.m.s.)
for and : even accounting for
the contribution of measurements errors, the relative difference in the scatter of these relations
does not change. On the contrary this confirms that the relation involving
is the one with the highest ”physical” dispersion, while for the other three relations the scatter is similar.
The situation is worse for the relations involving and the ratio:
the contribution of observational errors
is 70-76% ().
Thus it is impossible to determine which of these two relations
has the lowest scatter and represents
the best way to estimate dust attenuation without far infrared observations.
We can conclude that observational errors could account for the difference scatter observed in the relations
involving and the ratio, but not for the difference observed
in all the other relations.
Our results can thus be used to suggest different ways to correct for UV dust attenuation.
Ia) The relation still represents one of the best
way to quantify dust attenuation. The uncertainty in the value of
is .
Ib) If the UV spectral slope is unknown but we know (corrected for attenuation)
we can obtain the ultraviolet attenuation using equation (13), with a r.m.s. of .
This relation is valid under the assumption that the
star formation rate is approximately constant
in the last yr.
IIa) If we know , but no estimate of A(H) is available,
we can use Eq.(14) (rms).
IIb) If neither nor H luminosity are available we are left with the relations
with H-band surface brightness666Since we need H flux to estimate metallicity,
Eq.(10) cannot be used in this case. (r.m.s.) and, in the worse case,
III) H-band luminosity
(rms ).
Summarizing, these relations allow us
to estimate the value of the ratio with an average uncertainties of0.32 dex.
This value corresponds approximately to 0.5 mag,
assuming (the mean value for our sample)
and using the model of Buat et al. (2005).
This is the lowest uncertainty on the estimate of the ratio in absence of
far infrared observations.
However we caution the reader that this value holds only for an optically-selected sample and that samples selected
according to different criteria, especially FIR-selected, could contain higher dispersions.
Appendix A Estimate of )
The attenuation in the Balmer lines can be deduced from the comparison of the observed ratio with the theoretical value of 2.86 obtained for the recombination case B, an electronic density and temperature . The variation of this value with density its negligible and with temperature is 5% (in the range between 5000 K and 20000 K, Caplan & Deharveng 1986). The underlying absorption was deblended from the H emission line using a multiple component fitting procedure. To do this the emission line is measured and subtracted from the spectra. The resulting absorption line is also measured with respect to a reference continuum. These two measurements are used as first guess in a fitting algorithm which fits jointly the emission and absorption lines to the reference continuum. For objects whose is detected in emission but the deblending procedure is not applied (no absorption feature is evident) a mean additive correction for underlying absorption equal to -1.8 in flux and -1.4 Åin EW is used. These values correspond to the fraction of the (broader) absorption feature that lies under the emission line. We adopt a dust screen geometry and the Milky Way extinction curve (e.g. Kennicutt 1983; Calzetti et al. 1994). Whereas varying the extinction curves has negligible effects in the visible, the dust screen assumption seems to under-estimate the extinction by 0.2 mag compared with the amount deduced from the measurements of the thermal radio continuum (Caplan & Deharveng 1986; Bell & Kennicutt 2001). We do not apply any correction for H underlying absorption (Charlot & Longhetti 2001). However, since all the objects have , the underestimate in the value of ) is negligible. In fact no change (at a 99% significance level) is observed comparing the best fits obtained in this work and the ones obtained adding to the H the same fixed underlying absorption used for H when the underlying is not detected. We assume that the errors on ) are mainly due to the uncertainty on the H flux. These errors represent in fact the lower limits because we do not account for the uncertainty introduced by the fitting of the lines. They range from 0.01 to 0.43 mag and are found strongly anti-correlated with EW(H) (see Gavazzi et al. 2004). Adopting the definition of the Balmer decrement as in Gavazzi et al. (2004):
| (A1) |
Since the attenuation is:
| (A2) |
| (A3) |
and assuming a galactic extinction law ( = 1.47) we derive:
| (A4) |
) = 0.85 mag is obtained on average, consistent with previous studies (e.g. Kennicutt 1983, 1992; Thuan & Sauvage 1992; Kewley et al. 2002). Eleven galaxies have H undetected in emission but the underlying stellar absorption is clearly detected. For them we derive a lower limit to the H flux () using (Gavazzi et al. 2004):
| (A5) |
assuming that and emission lines have similar HWHM (Half Width Half Maximum). As shown in Eq.(A1) a change in the theoretical value of the ratio would only produce a small (5%) constant over (or under) estimate of the ionized gas attenuation, thus leaving unchanged the shape and dispersions of the observed relations, only affecting the values of the best fitting parameters.
Appendix B Dust to Gas ratio
The correlation between attenuation and metallicity can be interpreted assuming that the ultraviolet radiation produced by star forming regions suffers a dust attenuation increasing with the dust to gas ratio, which correlates with metallicity. (e.g. Issa et al. 1990; Inoue 2003). In order to check this hypothesis we compute the dust to gas ratio following Boselli et al. (2002b). In normal galaxies the dust mass is dominated by the cold dust emitting above 200 m. The total dust mass can be estimated provided that the 100-1000 m far-IR flux and the cold dust temperature are known. Fitting the SEDs of normal galaxies with a modified Planck law β , with (Alton et al. 2000), the total dust mass can be determined from the relation (Devereux & Young 1990):
| (B1) |
where depends on the grain opacity, is the far-IR flux at a given wavelength (in Jy), is the distance of the galaxy (in Mpc), is the dust temperature, and depends on . Only IRAS data at 60 and 100 m are available for our sample and, given the strong contamination of the emission at 60 m by very small grains, the 60 to 100 m ratio does not provide a reliable measure of (Contursi et al. 2001). determined by Alton et al. (1998) consistently with Contursi et al. (2001), seems to be independent of the UV radiation field, of the metallicity or of the total luminosity (Boselli et al. 2002b). Therefore we will adopt the average value K for all our galaxies introducing an uncertainty of 50% on the estimate of (equation (B1)). We then estimate the dust mass of the sample galaxies using (B1) with , consistent with Contursi et al. (2001), and =144 K for (Devereux & Young 1990). The determination of the dust to gas ratio, in a way consistent with that obtained in the solar neighbourhood, requires the estimate of the gas and dust surface densities, thus of the spatial distribution of dust and gas over the discs. Unfortunately only integrated HI and masses are available for our spatially unresolved galaxies. It is however reasonable to assume that the cold dust and the molecular hydrogen are as extended as the optical disc (Alton et al. 1998; Boselli et al. 2002b). To determine the mean HI surface density we adopt (Boselli et al. (2002b)):
where def(HI) is the galaxy HI deficiency. Thus the dust to gas ratio is obtained from the ratio of the dust surface density to the sum of molecular and neutral hydrogen surface densities. In Fig. 12 we compare the relation between the ratio (left panel) and (right panel) with the dust to gas ratio. The gas to dust ratio barely correlates with the ratio (R0.38). Contrary to metallicity, we do not find a significant correlation (R0.11) with the ultraviolet spectral slope. This is probably due to the high uncertainty in our estimate of consequent to assuming the same temperature for all our galaxies (, thus small errors (15%) on propagate onto 50% errors on ).
References
- Abazajian et al. (2005) Abazajian, K., Adelman-McCarthy, J. K., Agüeros, M. A., et al. 2005, AJ, 129, 1755
- Alton et al. (1998) Alton, P. B., Trewhella, M., Davies, J. I., et al. 1998, A&A, 335, 807
- Alton et al. (2000) Alton, P. B., Xilouris, E. M., Bianchi, S., Davies, J., & Kylafis, N. 2000, A&A, 356, 795
- Bell (2002) Bell, E. F. 2002, ApJ, 577, 150
- Bell & Kennicutt (2001) Bell, E. F. & Kennicutt, R. C. 2001, ApJ, 548, 681
- Binggeli et al. (1985) Binggeli, B., Sandage, A., & Tammann, G. A. 1985, AJ, 90, 1681
- Boissier et al. (2004) Boissier, S., Boselli, A., Buat, V., Donas, J., & Milliard, B. 2004, A&A, 424, 465
- Boissier et al. (2005) Boissier, S., Gil de Paz, A., Madore, B. F., et al. 2005, ApJ, 619, L83
- Boselli & Gavazzi (2002) Boselli, A. & Gavazzi, G. 2002, A&A, 386, 124
- Boselli et al. (2001) Boselli, A., Gavazzi, G., Donas, J., & Scodeggio, M. 2001, AJ, 121, 753
- Boselli et al. (2003) Boselli, A., Gavazzi, G., & Sanvito, G. 2003, A&A, 402, 37
- Boselli et al. (2002a) Boselli, A., Iglesias-Páramo, J., Vílchez, J. M., & Gavazzi, G. 2002a, A&A, 386, 134
- Boselli et al. (2002b) Boselli, A., Lequeux, J., & Gavazzi, G. 2002b, A&A, 384, 33
- Buat (1992) Buat, V. 1992, A&A, 264, 444
- Buat et al. (2002) Buat, V., Boselli, A., Gavazzi, G., & Bonfanti, C. 2002, A&A, 383, 801
- Buat et al. (1999) Buat, V., Donas, J., Milliard, B., & Xu, C. 1999, A&A, 352, 371
- Buat et al. (2005) Buat, V., Iglesias-Páramo, J., Seibert, M., et al. 2005, ApJ, 619, L51
- Buat & Xu (1996) Buat, V. & Xu, C. 1996, A&A, 306, 61
- Burgarella et al. (2005) Burgarella, D., Buat, V., & Iglesias-Páramo, J. 2005, MNRAS, 360, 1413
- Burstein & Heiles (1982) Burstein, D. & Heiles, C. 1982, AJ, 87, 1165
- Calzetti (1997) Calzetti, D. 1997, AJ, 113, 162
- Calzetti (2001) Calzetti, D. 2001, PASP, 113, 1449
- Calzetti et al. (1995) Calzetti, D., Bohlin, R. C., Kinney, A. L., Storchi-Bergmann, T., & Heckman, T. M. 1995, ApJ, 443, 136
- Calzetti et al. (2005) Calzetti, D., Kennicutt, R. C., Bianchi, L., et al. 2005, astro-ph/0507427
- Calzetti et al. (1994) Calzetti, D., Kinney, A. L., & Storchi-Bergmann, T. 1994, ApJ, 429, 582
- Caplan & Deharveng (1986) Caplan, J. & Deharveng, L. 1986, A&A, 155, 297
- Charlot & Fall (2000) Charlot, S. & Fall, S. M. 2000, ApJ, 539, 718
- Charlot & Longhetti (2001) Charlot, S. & Longhetti, M. 2001, MNRAS, 323, 887
- Colless et al. (2001) Colless, M., Dalton, G., Maddox, S., et al. 2001, MNRAS, 328, 1039
- Contursi et al. (2001) Contursi, A., Boselli, A., Gavazzi, G., et al. 2001, A&A, 365, 11
- Dale et al. (2001) Dale, D. A., Helou, G., Contursi, A., Silbermann, N. A., & Kolhatkar, S. 2001, ApJ, 549, 215
- Devereux & Young (1990) Devereux, N. A. & Young, J. S. 1990, ApJ, 359, 42
- Dutil & Roy (1999) Dutil, Y. & Roy, J. 1999, ApJ, 516, 62
- Gavazzi et al. (2002a) Gavazzi, G., Bonfanti, C., Sanvito, G., Boselli, A., & Scodeggio, M. 2002a, ApJ, 576, 135
- Gavazzi et al. (2003) Gavazzi, G., Boselli, A., Donati, A., Franzetti, P., & Scodeggio, M. 2003, A&A, 400, 451
- Gavazzi et al. (2002b) Gavazzi, G., Boselli, A., Pedotti, P., Gallazzi, A., & Carrasco, L. 2002b, A&A, 386, 114
- Gavazzi et al. (1999) Gavazzi, G., Boselli, A., Scodeggio, M., Pierini, D., & Belsole, E. 1999, MNRAS, 304, 595
- Gavazzi et al. (1998) Gavazzi, G., Catinella, B., Carrasco, L., Boselli, A., & Contursi, A. 1998, AJ, 115, 1745
- Gavazzi et al. (2005) Gavazzi, G., Donati, A., Cucciati, O., et al. 2005, A&A, 430, 411
- Gavazzi et al. (2000) Gavazzi, G., Franzetti, P., Scodeggio, M., Boselli, A., & Pierini, D. 2000, A&A, 361, 863
- Gavazzi et al. (1996) Gavazzi, G., Pierini, D., & Boselli, A. 1996, A&A, 312, 397
- Gavazzi et al. (2004) Gavazzi, G., Zaccardo, A., Sanvito, G., Boselli, A., & Bonfanti, C. 2004, A&A, 417, 499
- Glazebrook et al. (1999) Glazebrook, K., Blake, C., Economou, F., Lilly, S., & Colless, M. 1999, MNRAS, 306, 843
- Gordon et al. (2000) Gordon, K. D., Clayton, G. C., Witt, A. N., & Misselt, K. A. 2000, ApJ, 533, 236
- Heckman et al. (1998) Heckman, T. M., Robert, C., Leitherer, C., Garnett, D. R., & van der Rydt, F. 1998, ApJ, 503, 646
- Helou et al. (1988) Helou, G., Khan, I. R., Malek, L., & Boehmer, L. 1988, ApJS, 68, 151
- Iglesias-Páramo et al. (2002) Iglesias-Páramo, J., Boselli, A., Cortese, L., Vílchez, J. M., & Gavazzi, G. 2002, A&A, 384, 383
- Iglesias-Páramo et al. (2004) Iglesias-Páramo, J., Boselli, A., Gavazzi, G., & Zaccardo, A. 2004, A&A, 421, 887
- Inoue (2003) Inoue, A. K. 2003, PASJ, 55, 901
- Isobe et al. (1990) Isobe, T., Feigelson, E. D., Akritas, M. G., & Babu, G. J. 1990, ApJ, 364, 104
- Issa et al. (1990) Issa, M. R., MacLaren, I., & Wolfendale, A. W. 1990, A&A, 236, 237
- Kauffmann et al. (2003) Kauffmann, G., Heckman, T. M., Tremonti, C., et al. 2003, MNRAS, 346, 1055
- Kennicutt (1983) Kennicutt, R. C. 1983, ApJ, 272, 54
- Kennicutt (1992) Kennicutt, R. C. 1992, ApJ, 388, 310
- Kennicutt et al. (1994) Kennicutt, R. C., Tamblyn, P., & Congdon, C. E. 1994, ApJ, 435, 22
- Kewley & Dopita (2002) Kewley, L. J. & Dopita, M. A. 2002, ApJS, 142, 35
- Kewley et al. (2002) Kewley, L. J., Geller, M. J., Jansen, R. A., & Dopita, M. A. 2002, AJ, 124, 3135
- Kewley et al. (2005) Kewley, L. J., Jansen, R. A., & Geller, M. J. 2005, PASP, 117, 227
- Kong et al. (2004) Kong, X., Charlot, S., Brinchmann, J., & Fall, S. M. 2004, MNRAS, 349, 769
- Laird et al. (2005) Laird, E. S., Nandra, K., Adelberger, K. L., Steidel, C. C., & Reddy, N. A. 2005, MNRAS, 359, 47
- Leitherer & Heckman (1995) Leitherer, C. & Heckman, T. M. 1995, ApJS, 96, 9
- Martin et al. (2005) Martin, D. C., Fanson, J., Schiminovich, D., et al. 2005, ApJ, 619, L1
- McGaugh (1991) McGaugh, S. S. 1991, ApJ, 380, 140
- Meurer et al. (1999) Meurer, G. R., Heckman, T. M., & Calzetti, D. 1999, ApJ, 521, 64
- Meurer et al. (1995) Meurer, G. R., Heckman, T. M., Leitherer, C., et al. 1995, AJ, 110, 2665
- Morrissey et al. (2005) Morrissey, P., Schiminovich, D., Barlow, T. A., et al. 2005, ApJ, 619, L7
- Osterbrock (1989) Osterbrock, D. E. 1989, Astrophysics of gaseous nebulae and active galactic nuclei (Research supported by the University of California, John Simon Guggenheim Memorial Foundation, University of Minnesota, et al. Mill Valley, CA, University Science Books, 1989, 422 p.)
- Panuzzo et al. (2003) Panuzzo, P., Bressan, A., Granato, G. L., Silva, L., & Danese, L. 2003, A&A, 409, 99
- Salim et al. (2005) Salim, S., Charlot, S., Rich, R. M., et al. 2005, ApJ, 619, L39
- Seibert et al. (2005) Seibert, M., Martin, D. C., Heckman, T. M., et al. 2005, ApJ, 619, L55
- Skillman et al. (1989) Skillman, E. D., Kennicutt, R. C., & Hodge, P. W. 1989, ApJ, 347, 875
- Steidel et al. (1999) Steidel, C. C., Adelberger, K. L., Giavalisco, M., Dickinson, M., & Pettini, M. 1999, ApJ, 519, 1
- Thuan & Sauvage (1992) Thuan, T. X. & Sauvage, M. 1992, A&AS, 92, 749
- Tremonti et al. (2004) Tremonti, C. A., Heckman, T. M., Kauffmann, G., et al. 2004, ApJ, 613, 898
- van Zee et al. (1998) van Zee, L., Salzer, J. J., Haynes, M. P., O’Donoghue, A. A., & Balonek, T. J. 1998, AJ, 116, 2805
- Wang & Heckman (1996) Wang, B. & Heckman, T. M. 1996, ApJ, 457, 645
- Witt & Gordon (2000) Witt, A. N. & Gordon, K. D. 2000, ApJ, 528, 799
- Xu & Buat (1995) Xu, C. & Buat, V. 1995, A&A, 293, L65
- Zaritsky et al. (1994) Zaritsky, D., Kennicutt, R. C., & Huchra, J. P. 1994, ApJ, 420, 87
- Zwicky et al. (1961) Zwicky, F., Herzog, E., & Wild, P. 1961, Catalogue of galaxies and of clusters of galaxies (Pasadena: California Institute of Technology (CIT))