Quantitative Spectroscopy of Supernovae for Dark Energy Studies
1 Project Summary
Detailed quantitative spectroscopy of Type Ia supernovae (SNe Ia) provides crucial information needed to minimize systematic effects in both ongoing SNe Ia observational programs such as the Nearby Supernova Factory, ESSENCE, and the SuperNova Legacy Survey (SNLS) and in proposed JDEM missions such as SNAP, JEDI, and DESTINY.
Quantitative spectroscopy is mandatory to quantify and understand the observational strategy of comparing “like versus like”. It allows us to explore evolutionary effects, from variations in progenitor metallicity to variations in progenitor age, to variations in dust with cosmological epoch. It also allows us to interpret and quantify the effects of asphericity, as well as different amounts of mixing in the thermonuclear explosion.
While all proposed cosmological measurements will be based on empirical calibrations, these calibrations must be interpreted and evaluated in terms of theoretical explosion models. Here quantitative spectroscopy is required, since explosion models can only be tested in detail by direct comparison of detailed NLTE synthetic spectra with observed spectra.
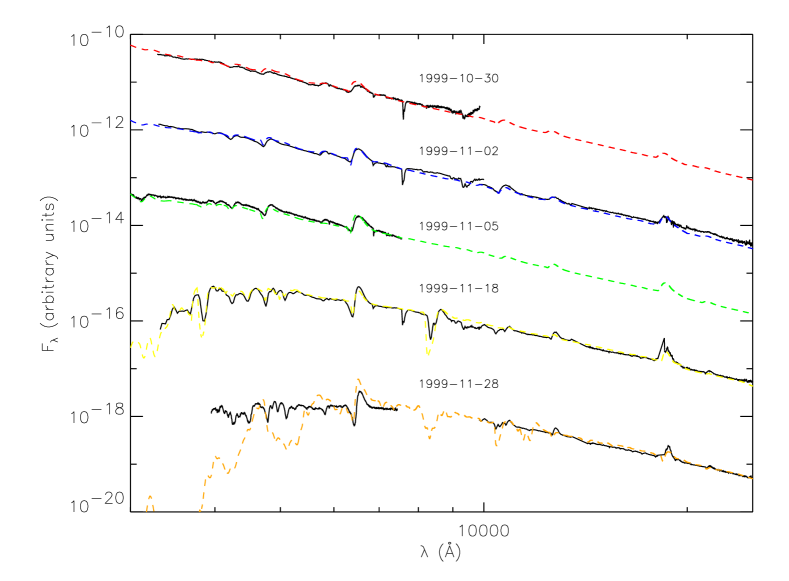
Additionally, SNe IIP can be used as complementary cosmological probes via the spectral fitting expanding atmosphere method (SEAM) that we have developed. The SEAM method in principle can be used for distance determinations to much higher than Type Ia supernovae.
We intend to model in detail the current, rapidly growing, database of SNe Ia and SNe IIP. Much of the data is immediately available in our public spectral and photometric database SUSPECT, which is widely used throughout the astronomical community.
We bring to this effort a variety of complementary synthetic spectra modeling capabilities: the fast parameterized 1-D code SYNOW; BRUTE, a 3-D Monte-Carlo with similar assumptions to SYNOW; a 3-D Monte-Carlo spectropolarimetry code, SYNPOL; and the generalized full NLTE, fully relativistic stellar atmosphere code PHOENIX (which is being generalized to 3-D).
2 Cosmology from Supernovae
While indirect evidence for the cosmological acceleration can be deduced from a combination of studies of the cosmic microwave background and large scale structure (Efstathiou et al., 2002; Bennett et al., 2003; Eisenstein et al., 2005), distance measurements to supernovae provide a valuable direct and model independent tracer of the evolution of the expansion scale factor necessary to constrain the nature of the proposed dark energy. The mystery of dark energy lies at the crossroads of astronomy and fundamental physics: the former is tasked with measuring its properties and the latter with explaining its origin.
Presently, supernova measurements of the cosmological parameters are no longer limited by statistical uncertainties, but systematic uncertainties are the dominant source of error (see Knop et al., 2003, for a recent analysis). These include the effects of evolution (do SNe Ia behave in the same way in the early universe?), the effect of intergalactic dust on the apparent brightness of the SNe Ia, and knowledge of the spectral energy distribution as a function of light curve phase (especially in the UV where are current data sets are quite limited).
Recently major ground-based observational programs have begun: the Nearby SuperNova Factory (see Aldering, 2000; Nugent & Aldering, 2000), the European Supernova Research Training Network (RTN), the Carnegie Supernova Project (CSP), ESSENCE, and the SuperNova Legacy Survey. Their goals are to improve our understanding of the utility of Type Ia supernovae for cosmological measurements by refining the nearby Hubble diagram, and to make the first definitive measurement of the equation of state of the universe using supernovae. Many new programs have recently been undertaken to probe the rest-frame UV region at moderate , providing sensitivity to metallicity and untested progenitor physics. SNLS has found striking diversity in the UV behavior that is not correlated with the normal light curve stretch parameter. As precise knowledge of the -correction is needed to use SNe Ia to trace the deceleration expected beyond 1 (Riess et al., 2004), understanding the nature of this diversity is crucial in the quest for measuring dark energy. We plan to undertake an extensive theoretical program, which leverages our participation with both SNLS and the Supernova Factory, in order to refine our physical understanding of supernovae (both Type Ia and II) and the potential systematics involved in their use as cosmological probes for the Joint Dark Energy Mission (JDEM).
In addition to SNe Ia, the Nearby Supernova Factory will observe scores of Type IIP supernovae in the Hubble Flow. These supernovae will provide us with a perfect laboratory to probe the mechanisms behind these core-collapse events, the energetics of the explosion, asymmetries in the explosion event and thereby provide us with an independent tool for precision measurements of the cosmological parameters.
The SEAM method has shown that accurate distances may be obtained to SNe IIP, even when the classical expanding photosphere method fails (see Fig. 1 and Baron et al., 2004). Another part of the SN IIP study is based a correlation between the absolute brightness of SNe IIP and the expansion velocities derived from the Fe II 5169 Å P-Cygni feature observed during their plateau phases (Hamuy & Pinto, 2002). We have refined this method in two ways (P. Nugent et al., 2005, in preparation) and have applied it to five SNe IIP at . Improving the accuracy of measuring distances to SNe IIP has potential benefits well beyond a systematically independent measurement of the cosmological parameters based on SNe Ia or other methods. Several plausible models for the time evolution of the dark energy require distance measures to and beyond. At such large redshifts both weak lensing and SNe Ia may become ineffective probes, the latter due to the drop-off in rates suggested by recent work (Strolger et al., 2004). Current models for the cosmic star-formation history predict an abundant source of core-collapse at these epochs and future facilities, such as JDEM, in concert with the James Webb Space Telescope (JWST) or the Thirty Meter Telescope, could potentially use SNe IIP to determine distances at these epochs.
Spectrum synthesis computations provide the only way to study this wealth of data and use it to quantify and correct for potential systematics and improve the distances measurements to both SNe Ia and SNe IIP.
3 Understanding the 3-D Nature of Supernovae
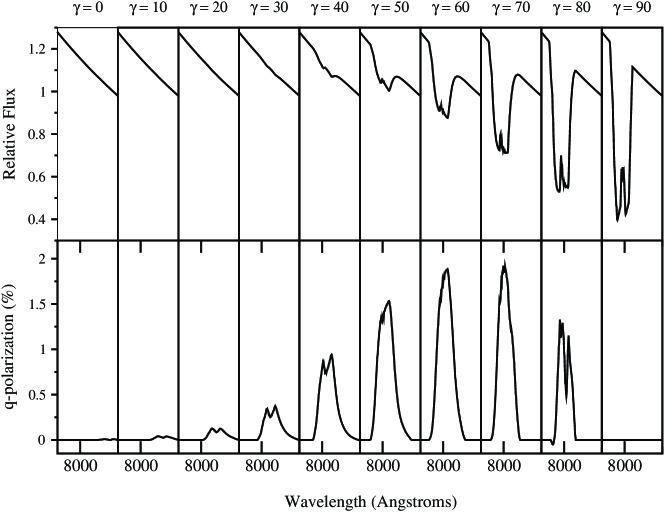
While most SNe Ia do not show signs of polarization, a subset of them do. These supernovae will play a role in determining the underlying progenitor systems/explosion mechanisms for SNe Ia which is key to ascertaining potential evolutionary effects with redshift. Flux and polarization measurements of SN 2001el (Wang et al., 2002) clearly showed polarization across the high-velocity Ca II IR triplet. A 3-D spectopolometric model fit for this object assumes that there is a blob of calcium at high-velocity over an ellipsoidal atmosphere with an asphericity of 15% (see Fig 3 and Kasen et al., 2003). Kasen & Plewa (2005) have shown that a gravitationally confined thermonuclear supernova model can also explain this polarization signature. If this is in fact the correct hydrodynamical explosion model for SNe Ia, then the parameter space for potential systematics becomes significantly smaller in their use as standard candles. Currently there are a wide variety of possible mechanisms to make a SN Ia each with its own set of potential evolutionary systematics. Thomas et al. (2004) showed that the observed spectral homogeneity implies that arbitrary asymmetries in SNe Ia are ruled out. The only way to test detailed hydrodynamical models of the explosion event is to confront observations such as those that will be obtained via the Nearby Supernova Factory with the models via spectrum synthesis.The importance of studying these events in 3-D is clear from the observations, and therefore every effort must be made to achieve this goal.
4 PHOENIX
In order to model astrophysical plasmas under a variety of conditions, including differential expansion at relativistic velocities found in supernovae, we have developed a powerful set of working computational tools which includes the fully relativistic, non-local thermodynamic equilibrium (NLTE) general stellar atmosphere and spectral synthesis code PHOENIX (Hauschildt & Baron, 2004, 1999; Hauschildt et al., 1997a, b; Allard et al., 1997). PHOENIX is a state-of-the-art model atmosphere spectrum synthesis code which has been developed and maintained by some of us to tackle science problems ranging from the atmospheres of brown dwarfs, cool stars, novae and supernovae to active galactic nuclei and extra-solar planets. We solve the fully relativistic radiative transport equation for a variety of spatial boundary conditions in both spherical and plane-parallel geometries for both continuum and line radiation simultaneously and self-consistently. We also solve the full multi-level NLTE transfer and rate equations for a large number of atomic species, including non-thermal processes.
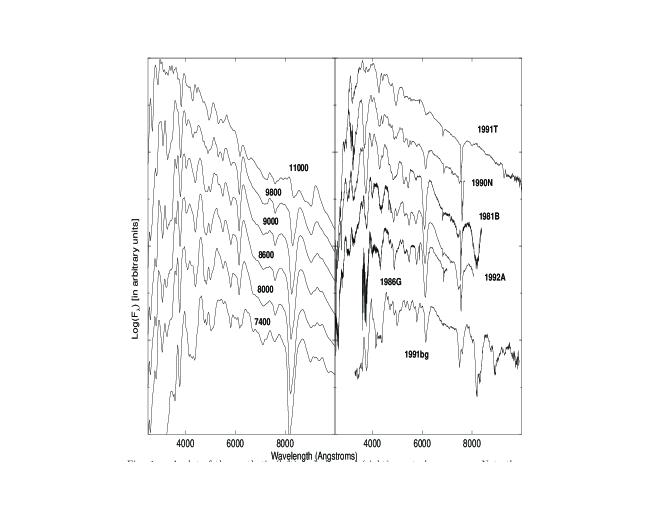
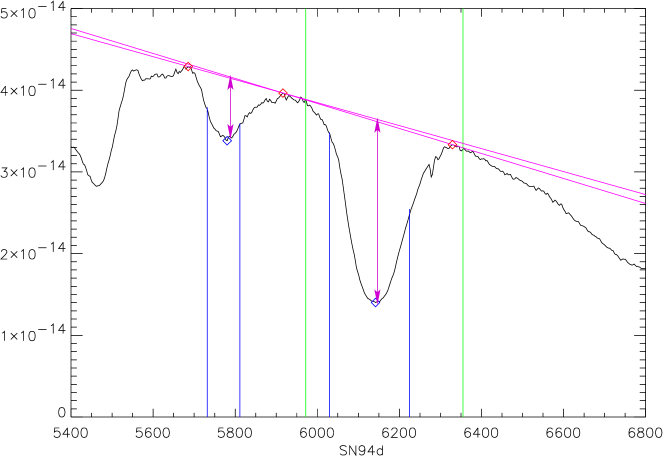
To illustrate the nature that our future research will take, we now describe some of the past SN Ia work with PHOENIX. Nugent et al. (1995), showed that the diversity in the peak of the light curves of SNe Ia was correlated with the effective temperature and likely the nickel mass (see Fig. 2). We also showed that the spectroscopic features of Si II and Ca II near maximum light correlate with the peak brightness of the SN Ia and that the spectrum synthesis models by PHOENIX were nicely able to reproduce this effect. We were able to define two spectroscopic indices and (see Figs 4–5), which correlate very well with the light curve shape parameter (Garnavich et al., 2004). These spectroscopic indices offer an independent (and since they are intrinsic, they are also reddening independent) approach to determining peak luminosities of SNe Ia. S. Bongard et al. (in preparation) have shown that measuring these spectroscopic indicators may be automated, and that they can be used with the spectral signal to noise and binning planned for the JDEM missions SNAP and JEDI.
The relationship between the width (and hence risetime) of the lightcurves of SNe Ia to the brightness at maximum light is crucial for precision cosmology. It is well known that the square of the time difference between explosion and peak brightness, is proportional to the opacity, , (Arnett, 1982; Baron et al., 1993). In an effort to find a more direct connection between SN Ia models and the light-curve shape relationships we examined the Rosseland mean opacity, , at the center of each model. We found that in our hotter, more luminous models was a factor of 2 times greater than in our cooler, fainter models. This factor of 1.4 in is very near to what one would expect, given the available photometric data, for the ratio of the light-curve shapes between the extremes of SN 1991T (an over-luminous SN Ia with a broad light curve) and SN 1991bg (an under-luminous SN Ia with a narrow light curve).
We have been studying the effects of evolution on the spectra of SNe Ia, in particular the role the initial metallicity of the progenitor plays in the peak brightness of the SN Ia. Due to the effects of metal line blanketing one expects that the metallicity of the progenitor has a strong influence on the UV spectrum Höflich et al. (1998); Lentz et al. (2000). In Lentz et al. (2000) we quantified these effects by varying the metallicity in the unburned layers and computing their resultant spectra at maximum light.
Finally we note the work we have done on testing detailed hydrodynamical models of SNe Ia (Nugent et al., 1997). It is clear from these calculations that the sub-Chandrasekhar “helium-igniter” models (see for example Woosley & Weaver, 1994) are too blue in general and that very few spectroscopic features match the observed spectrum. On the other hand, the Chandrasekhar-mass model W7 of Nomoto et al. (1984) is a fairly good match to the early spectra (which are most important for cosmological applications) of the most typical SNe Ia. Lentz et al. (2001) calculated an extensive time series of W7 and compared it with that of the well observed nearby SN Ia SN 1994D. In this work we showed that W7 fits the observations pretty well at early times, but the quality of the fits degrades by about 15 days past maximum light. We speculate that this implies that the outer layers (seen earliest) of W7 reasonable well represent normal SNe Ia, whereas the inner layers of SNe Ia are affected by 3-D mixing effects. With the work described here, we will be able to directly test this hypothesis by calculating the spectra of full 3-D hydrodynamical calculations now being performed by Gamezo and collaborators and by the Munich group (Hillebrandt and collaborators). Baron et al. (2005) have calculated very detailed NLTE models of W7 and delayed detonation models of Höflich et al. (2002). We find that W7 does not fit the observed Si II feature very well, although it does a good job in other parts of the spectrum. The delayed-detonation models do a bit better, but a highly parameterized model is the best. We will continue this work as well as extending it to 3-D models. This will significantly impact our understanding of SNe Ia progenitor, something that is crucial for the success of JDEM.
We stress that the quantitative spectroscopic studies discussed here do not just show that a proposed explosion model fits or doesn’t fit observed spectra, but provides important information into just how the spectrum forms. One learns as much from spectra that don’t fit as from ones that do.
Our theoretical work provides important constraints on the science definition of JDEM, helps to interpret the data coming in now from both nearby and mid-redshift surveys and involves ongoing code development to test 3-D hydrodynamic models, as well as both flux and polarization spectra from nearby supernovae which may indicate evidence of asphericity. Research such as this requires both manpower and large-scale computational facilities for production which can be done to some extent at national facilities such as the National Energy Research Supercomputing Center at LBNL (NERSC), and local, mid-sized computing facilities for code development which requires with the ability to perform tests with immediate turn-around.
References
- Aldering (2000) Aldering, G. 2000, in ASP Conference Proceeding: Cosmic Flows, ed. S. Courteau & M. Strauss (Chicago: University of Chicago Press)
- Allard et al. (1997) Allard, F., Hauschildt, P. H., & Starrfield, S. 1997, Ann. Rev. Astr. Ap., 35, 137
- Arnett (1982) Arnett, W. D. 1982, ApJ, 253, 785
- Baron et al. (2005) Baron, E., Bongard, S., Branch, D., & Hauschildt, P. 2005, ApJ, submitted
- Baron et al. (2004) Baron, E., Nugent, P., Branch, D., & Hauschildt, P. 2004, ApJ, 616, 91
- Baron et al. (1993) Baron, E., Young, T., & Branch, D. 1993, ApJ, 409, 471
- Bennett et al. (2003) Bennett, C. L., Halpern, M., Hinshaw, G., Jarosik, N., Kogut, A., Limon, M., Meyer, S. S., Page, L., Spergel, D. N., Tucker, G. S., Wollack, E., Wright, E. L., Barnes, C., Greason, M. R., Hill, R. S., Komatsu, E., Nolta, M. R., Odegard, N., Peiris, H. V., Verde, L., & Weiland, J. L. 2003, ApJS, 148, 1
- Efstathiou et al. (2002) Efstathiou, G., Moody, S., Peacock, J. A., Percival, W. J., Baugh, C., Bland-Hawthorn, J., Bridges, T., Cannon, R., Cole, S., Colless, M., Collins, C., Couch, W., Dalton, G., de Propris, R., Driver, S. P., Ellis, R. S., Frenk, C. S., Glazebrook, K., Jackson, C., Lahav, O., Lewis, I., Lumsden, S., Maddox, S., Norberg, P., Peterson, B. A., Sutherland, W., & Taylor, K. 2002, MNRAS, 330, L29
- Eisenstein et al. (2005) Eisenstein, D. J., Blanton, M., Zehavi, I., Bahcall, N., Brinkmann, J., Loveday, J., Meiksin, A., & Schneider, D. 2005, ApJ, 619, 178
- Garnavich et al. (2004) Garnavich, P. M. et al. 2004, ApJ, 613, 1120
- Hamuy & Pinto (2002) Hamuy, M. & Pinto, P. 2002, ApJ, in press, astro-ph/0201279
- Hauschildt & Baron (1999) Hauschildt, P. H. & Baron, E. 1999, J. Comp. Applied Math., 109, 41
- Hauschildt & Baron (2004) —. 2004, Mitteilungen der Mathematischen Gesellschaft in Hamburg, Band 23
- Hauschildt et al. (1997a) Hauschildt, P. H., Baron, E., & Allard, F. 1997a, ApJ, 483, 390
- Hauschildt et al. (1997b) Hauschildt, P. H., Schwarz, G., Baron, E., Starrfield, S., Shore, S., & Allard, F. 1997b, ApJ, 490, 803
- Höflich et al. (2002) Höflich, P., Gerardy, C., Fesen, R., & Sakai, S. 2002, ApJ, 568, 791
- Höflich et al. (1998) Höflich, P., Wheeler, J. C., & Thielemann, F.-K. 1998, ApJ, 495, 617
- Kasen et al. (2003) Kasen, D., Nugent, P., Wang, L., Howell, D. A., Wheeler, J. C., Höflich, P., Baade, D., , Baron, E., & Hauschildt, P. 2003, ApJ, 593, 788
- Kasen & Plewa (2005) Kasen, D. & Plewa, T. 2005, ApJ, 21, L41
- Knop et al. (2003) Knop, R. A., Aldering, G., Amanullah, R., Astier, P., Blanc, G., Burns, M. S., Conley, A., Deustua, S. E., Doi, M., Ellis, R., Fabbro, S., Folatelli, G., Fruchter, A. S., Garavini, G., Garmond, S., Garton, K., Gibbons, R., Goldhaber, G., Goobar, A., Groom, D. E., Hardin, D., Hook, I., Howell, D. A., Kim, A. G., Lee, B. C., Lidman, C., Mendez, J., Nobili, S., Nugent, P. E., Pain, R., Panagia, N., Pennypacker, C. R., Perlmutter, S., Quimby, R., Raux, J., Regnault, N., Ruiz-Lapuente, P., Sainton, G., Schaefer, B., Schahmaneche, K., Smith, E., Spadafora, A. L., Stanishev, V., Sullivan, M., Walton, N. A., Wang, L., Wood-Vasey, W. M., & Yasuda, N. 2003, ApJ, 598, 102
- Lentz et al. (2001) Lentz, E., Baron, E., Branch, D., & Hauschildt, P. H. 2001, ApJ, 557, 266
- Lentz et al. (2000) Lentz, E., Baron, E., Branch, D., Hauschildt, P. H., & Nugent, P. 2000, ApJ, 530, 966
- Nomoto et al. (1984) Nomoto, K., Thielemann, F.-K., & Yokoi, K. 1984, ApJ, 286, 644
- Nugent & Aldering (2000) Nugent, P. & Aldering, G. 2000, in The Greatest Explosions Since the Big Bang: Supernovae and Gamma-ray Bursts, ed. M. Livio, N. Panagia, & K. Sahu (Baltimore: Space Telescope Science Institute), 47
- Nugent et al. (1997) Nugent, P., Baron, E., Branch, D., Fisher, A., & Hauschildt, P. 1997, ApJ, 485, 812
- Nugent et al. (1995) Nugent, P., Phillips, M., Baron, E., Branch, D., & Hauschildt, P. 1995, ApJ, 455, L147
- Riess et al. (2004) Riess, A. G., Strolger, L., Tonry, J., Casertano, S., Ferguson, H. C., Mobasher, B., Challis, P., Filippenko, A. V., Jha, S., Li, W., Chornock, R., Kirshner, R. P., Leibundgut, B., Dickinson, M., Livio, M., Giavalisco, M., Steidel, C. C., Benítez, T., & Tsvetanov, Z. 2004, ApJ, 607, 665
- Strolger et al. (2004) Strolger, L. et al. 2004, ApJ, 613, 200
- Thomas et al. (2004) Thomas, R. C., Branch, D., Baron, E., Nomoto, K., Li, W., & Filippenko, A. V. 2004, ApJ, 601, 1019
- Wang et al. (2002) Wang, L. et al. 2002, ApJ, 1000, 1
- Woosley & Weaver (1994) Woosley, S. E. & Weaver, T. A. 1994, ApJ, 423, 371