11email: anna@brera.mi.astro.it 22institutetext: INAF-CNR - Istituto di Radioastronomia, Via Gobetti 101, I-40129 Bologna, Italy
22email: gioia@ira.cnr.it 33institutetext: Institute for Astronomy, University of Hawai′i, 2680 Woodlawn Drive, Honolulu, HI 96822, USA
33email: henry@ifa.hawaii.edu 44institutetext: Department of Astronomy, University of Michigan, 918 Dennison Building, Ann Arbor, MI 48109, USA
44email: cmullis@umich.edu
Unobscured QSO 2: A New Class of Objects?111Based on observations taken at the Italian Telescopio Nazionale Galileo, TNG and on observations obtained with XMM-Newton, an ESA science mission with instruments and contributions directly funded by ESA member states and NASA.
We present in this paper optical and X-ray follow up observations for three X-ray selected objects extracted from the ROSAT North Ecliptic Pole survey which is a flux-limited, completely identified survey. All three objects have X-ray luminosities in the 1044 erg s-1 regime and show narrow emission lines in their optical discovery spectra, typical of QSO 2 type objects. Spectroscopic data for the three QSO 2 candidates, obtained with the Telescopio Nazionale Galileo, confirm the widths of the H or H emission lines are less than 750 km s-1. On the other hand XMM-Newton data do not show any sign of obscuration as expected for this class of objects. The X-ray spectra of the three objects are all well fit by a single power law model with 1.7 with low energy absorption fixed to the Galactic value along the line of sight to each object. Most observational evidence supports the scenario where optical and X-ray obscurations are linked, contrary to our findings. We discuss the unanticipated results of these observations, and compute the space density in soft X-ray surveys of this possibly new class of objects. Their spatial density in the ROSAT NEP survey is 2.8 h3 Mpc-3 in a CDM model with 0.7. Unobscured QSO 2 candidates could go unrecognized in current X-ray surveys where the low hydrogen column density is inferred by a hardness ratio rather than a more precise X-ray spectrum measurement.
Key Words.:
galaxies: active; galaxies: quasars: general - X-rays; X-rays: individual: RX J1715.4+6239, RX J1724.9+6636, RX J1737.0+66011 Introduction
The phenomenology of Active Galactic Nuclei (AGN) is extremely varied with luminosities ranging over many orders of magnitude. AGN have been classified over the years into several subclasses to explain the variety of features observed like the presence or lack of broad optical emission lines, the presence and morphology of radio emission. Historically, low luminosity AGN are called Seyferts (Sy), and high luminosity AGN are called quasars (QSO). Objects are further classified as Type 1 or Type 2 according to the presence of broad or narrow optical emission lines. A recently defined class of objects are the Type 2 QSO, or QSO 2, which are heavily obscured, powerful hard X-ray emission objects. They are expected to be the luminous counterparts of the local Sy 2 galaxies with narrow optical emission lines.
Absorbed AGN are a major fraction in the total emission budget of the diffuse X-ray Background (XRB; Schmidt et al., 1998), as was first predicted by Setti & Woltjer (1989). The model was later refined by Madau et al. (1994), Comastri et al. (1995), Gilli et al. (1999), among others. In more recent years the XRB was directly resolved with Chandra by Mushotzky et al. (2000), Brandt et al. (2001), Giacconi et al. (2001), Rosati et al. (2002), and with XMM-Newton by Hasinger et al. (2001). The original requirement of the Setti & Woltjer model, that the number of absorbed sources is approximately equal to that of unabsorbed ones, still holds. QSO 2 are deemed necessary to explain the hard source counts at fluxes of the order of 10-13 erg cm -2 s-1 in the ASCA 210 keV band where they should contribute at least 30% of the total emission (Gilli et al., 2001). The relative densities of absorbed and unabsorbed objects in the model can be compared to the relative densities found in the optical band. The local ratio between Sy 2 and Sy 1 in the optical band ranges from 2 (Huchra & Burg, 1992) to 4 (Maiolino & Rieke, 1995). Since there is no reason to expect a different ratio for high luminosity objects, we should expect a factor of 2-4 more QSO 2 than QSO 1. What is observed instead is a dearth of QSO 2 (see among others: Akiyama et al., 2002; Della Ceca et al., 2003; Barcons et al., 1998; Fiore et al., 1999).
Since QSO 2 are a key ingredient in models of the diffuse XRB (Comastri et al., 2000; Gilli et al., 2001), they should be more easily detected in X-ray selected samples because they have high X-ray luminosities. No X-ray survey found a sizeable number of such objects (e.g. there are no QSO 2 in the complete ASCA Large Sky Survey; Akiyama et al., 2000), and only a few candidates have been found using ASCA (Ohta et al., 1996; Akiyama et al., 2002; Della Ceca et al., 2003), ROSAT (Almaini et al., 1995; Barcons et al., 1998; Georgantopoulos et al., 1999), and Beppo-SAX (Fiore et al., 1999). Detection of QSO 2 is very controversial. Several QSO 2 candidates have been proposed in the literature, but they have often been classified later with other known types of objects. This is the case of AXJ0341.44453, proposed as a Type 2 AGN by Boyle et al. (1998), and later identified as a Narrow Line Sy 1 (Halpern et al., 1999) on the basis of a broad component in the H emission line (not observed in the discovery spectrum) plus other spectral properties (see for the classification of Narrow Line Sy 1: Osterbrock & Pogge, 1985; Goodrich, 1989). CHANDRA and XMM-Newton data have included new candidates (Stern et al., 2002; Norman et al., 2002; Dawson et al., 2001; Mainieri et al., 2002; Fiore et al., 2003; Caccianiga et al., 2004) but the number of confirmed QSO 2 is still small. Their absence in X-ray selected samples could be explained if “all” sources are perfectly Compton-thick (N cm-2), implying a complete absorption of the X-ray radiation. Alternatively, the luminosity of the nucleus could be so high that the obscuring material is effectively removed from the circumnuclear regions, leaving a totally unblocked view of the Broad Line region (BLR). Both interpretations seem unlikely. It has been suggested (Risaliti et al., 2003) that some soft X-ray weak quasars with red optical counterparts might be optically broad-lined objects with an intrinsically weak and flat X-ray spectrum. This model seems to be supported by the fact that there is no one-to-one correspondence between optical and X-ray absorption. A number of galaxies, optically classified as Sy 1, shows high intrinsic hydrogen columns or at least soft energies spectral curvatures that might be attributed to ionized absorbers (Nandra & Pounds, 1994; Fiore et al., 2001). Also a number of objects, optically classified as Sy 2, shows absorptions smaller than 1022 cm-2 even if they might still be reconciled with the unifiying scenario (see e.g. Guainazzi et al., 2001; Pappa et al., 2001; Panessa & Bassani, 2002).
The comparisons of optical and X-ray absorption has not yet been done with a large statistical sample. This will be possible in the near future for instance with the new samples identified by the XMM Survey Science Center (Della Ceca et al., 2004) or from surveys with CHANDRA (Silverman et al., 2005). First results seem to confirm that the optical and X-ray absorption are linked (Caccianiga et al., 2004). Therefore objects optically appearing as Type 2 should present a high degree of X-ray absorption. We have selected from the ROSAT North Ecliptic Pole survey (NEP; Gioia et al., 2003) three QSO 2 candidates on the basis of high X-ray luminosity and absence of broad optical emission lines. We present in this paper new optical and X-ray observations of the three NEP QSO 2 candidates present in the survey catalog and discuss the results obtained. We address the issue of the density of QSO 2 and their spectral properties in a completely identified, X-ray-flux limited sample. Throughout the paper quoted uncertainties are 90% confidence levels for one interesting parameter. We assume the currently-favored cosmological concordance model ()=(0.7, 0.3, 0.7).
| Source Name | NEP id # | PSPC FF | z (UH or MMT) | z (TNG) | NH | L0.5-2.0keV | MB |
|---|---|---|---|---|---|---|---|
| 10-13 erg cm -2 s-1 | cm-2 | 1044 erg s-1 | (from USNO B mag) | ||||
| RX J1715.4+6239 | NEP 1239 | 1.390.30 | 0.8500 | 0.8500 | 2.62 | 4.88 | -23.5 |
| RX J1724.9+6636 | NEP 1640 | 1.030.25 | 0.6792 | 0.6758 | 3.84 | 2.08 | -23.2 |
| RX J1737.0+6601 | NEP 2131 | 1.360.20 | 0.3580 | 0.3585 | 3.76 | 0.60 | -24.1 |
2 The NEP sample of QSO 2 candidates
The ROSAT data around the North Ecliptic Pole of the ROSAT All Sky Survey (RASS) have been used to construct a contiguous area survey consisting of a homogeneous X-ray flux-limited sample of 445 X-ray sources (Mullis, 2001; Henry et al., 2001; Voges et al., 2001; Gioia et al., 2003). The region around the NEP possesses the deepest exposure and consequently the greatest sensitivity of the entire RASS (Voges et al., 1999). Hence, the 9∘ 9∘ survey region centered at 18, 66∘33′ covers the deepest, wide-angle contiguous region ever observed in X-rays. This unique combination of depth plus wide, contiguous solid angle provides the capabilities of detecting both high-redshift objects and large scale structure. A comprehensive program of optical follow-up observations to determine the nature of each of the X-ray sources in the NEP sample led to the identification of all but two NEP sources (Gioia et al., 2003). There is evidence that at least one of the two unidentified sources is a blend and that both may be spurious.
The main constituents of the catalog are AGN (49%), either Type 1 or Type 2 according to the broadness of their permitted emission lines with the cut-off at FWHM2000 km s-1 for classification purposes. There are 198 AGN 1 and 21 AGN 2, where under the term AGN we include both Seyfert and QSO. We further divide QSO and Seyfert galaxies according to their X-ray luminosity and put the dividing line at L erg s-1 in the keV energy band. Only three of a total of 219 AGN are QSO 2 candidates. These objects have narrow permitted emission lines (MgII 2798 Å and H with FWHM1000 km s-1) and show high-ionization emission lines like [NeIII] 3869 Å (see two of the spectra in Fig. 1 (top) and Fig. 2). The 99.6% identification rate implies that QSO 2 are a relatively small fraction of the total AGN population, at least in the soft X-ray keV energy band. The properties of the three candidates are given in Table 1. The explanation of each column is given below:
-
•
Columns (1) and (2): Object ROSAT name and internal NEP survey identification number.
-
•
Column (3): Unabsorbed PSPC flux and its error in the standard ROSAT energy band (0.5-2.0 keV) derived from the count rate assuming the source has a power law spectrum (photon index 2), with absorption fixed at the galactic value for the source position.
-
•
Columns (4) and (5): Redshift as measured at various telescopes, UH stands for the University of Hawai′i 2.2m telescope, MMT for the Multiple Mirror 6.5m Telescope and TNG for the 3.6m Telescopio Nazionale Galileo.
- •
-
•
Column (7): Rest-frame, K-corrected luminosity in the 0.5–2.0 keV energy band. Note that K-correction for a power law spectrum is and is thus unity for .
-
•
Column (8): Absolute Blue Magnitude from brightest B magnitude in USNO-B1 (http://www.nofs.navy.mil/data/fchpix/ ).
The luminosity derived for these objects, L erg s-1, as well as their optical magnitude are in the QSO class range. Variations of B and R magnitudes from the USNO catalog at different epochs, with differences ranging from 0.1 up to 1.6 mag, show the variability nature of these objects consistent with the AGN classification.
| Line id | NEP 1239 | NEP 1640 | NEP 2131 |
|---|---|---|---|
| km s-1 | km s-1 | km s-1 | |
| NeV | 819 | ||
| OII | 801 | ||
| NIII | 460 | ||
| H | 633 | ||
| H | 453 | 270 | |
| OIII4958 | 458 | 480 | 741 |
| OIII5007 | 457 | 623 | 707 |
| NeI | 608 | ||
| H | 726 |
3 Observations and Data Analysis
In this section we present the discovery optical spectra for two of the three QSO 2 candidates obtained at the University of Hawai′i (UH) 2.2m telescope and the new optical spectroscopy performed at the Italian 3.6m Telescopio Nazionale Galileo (TNG), plus the X-ray follow-up observations acquired with XMM-Newton. We first describe the optical spectroscopy, and then present the X-ray data.
3.1 Optical Spectroscopic Data
The optical spectra of the NEP QSO 2 candidates, taken at the UH 2.2m telescope of the Mauna Kea Observatory with the Wide Field Grism Spectrograph, are shown in Fig. 1 and Fig. 2 for two of the three QSO 2 candidates. These spectra are the original discovery spectra and have relatively low signal to noise ratio. However, the presence of [NeIII] is indicative of high-ionization line objects. New spectroscopic observations were carried out at the TNG 3.6m telescope located at Roque de Los Muchachos Observatory in the Canary islands on 2004, May 19, and June 19, 22 and 23. The new spectra were acquired to obtain higher resolution and larger wavelength coverage in the optical-IR regime in order to confirm that the permitted lines are narrow, including H when present in the observed wavelength range.
We used the low resolution spectrograph DOLORES (Device Optimized for the LOw RESolution). The Dolores camera was operated at the f/3.2 focus. The camera is equipped with a Loral thinned and back-illuminated CCD with 2048 x 2048, 15 pixels which provided a derived scale of 0.275 arcsec pixels-1, and a field of view of about 9.4 x 9.4 arcmin. A combination of medium and high resolution spectra were obtained centered in the blue or red/infrared part of the spectrum, according to the redshift of each QSO 2 candidate. We used the MR-I grism for NEP 1239, the highest redshift object at z0.85 for a total exposure of 2.5 hours divided into three exposures of 3000s each. We requested also an infrared spectrum to check for the presence of H. This spectrum however was never acquired due to the faintness of the object which was not visible when the observation was performed. We may speculate that the object probably varied (as is common for AGN) at the time of the TNG observations. In fact NEP 1239 is the only object with a ROSAT PSPC flux (see Tables 1 and 4) which is about twice the value of the XMM-Newton flux measured almost simultaneously to the TNG observations. For NEP 1640 (z0.6758) the HR-I and MR-I grisms were used for a total exposure of about 2h divided into 4500s for the HR-I and 3000s for the MR-I, while for NEP 2131 (the lowest redshift object at z0.358) the MR-B (700s) and MR-I (1100s) grisms were used. The HR-I grism provides a pixel scale in spectroscopic mode of 0.8 Å pixels-1. The slitlet width of 1′′ provided a spectral resolution of 3 Å FWHM. The wavelength coverage was approximately 7360–8900 Å . The MR-I grism gives a pixel scale of 1.8 Å pixels-1, a spectral resolution of 7 Å FWHM, and a wavelength coverage of approximately 8400–12,000 Å which in reality turned out to be only up to 10,000 Å . The MR-B grism provides a pixel scale of 1.7 Å pixels-1, a spectral resolution of 6 Å FWHM, and a wavelength coverage of approximately 3500–7000 Å . All the values are for 1slit used.
The optical data were analyzed using standard IRAF222http://iraf.noao.edu reduction packages. The redshifts measured at the TNG 3.6m for the three objects are in perfect agreement with the previously determined redshifts from the discovery spectra as can be seen in Table 1. The TNG spectra for the three objects are shown in Fig. 1 (bottom), Fig. 2 (center and bottom) and Fig. 3. The following properties, listed also in Table 2, can be derived from the optical spectra of the three objects:
-
•
NEP 1239: the TNG redder wavelength spectrum (see Fig. 1) for this object at z0.85 nicely complements the UH spectrum and shows narrow H (FWHM453 km s-1) and the [OIII] doublet emission lines (FWHM458 km s-1 for [OIII] 4958 Å ; FWHM457 km s-1 for [OIII] 5007 Å ). The H region is outside the wavelength range of the TNG spectrum, so unfortunately no information is available. The log ([OIII] 5007 / H) is 0.79, which places it in the Seyfert 2 region of the spectral classification plots of Veilleux & Osterbrock (1987).
-
•
NEP 1640: in the UH 2.2m spectrum (Fig. 2-top) four narrow emission lines were detected: MgII, [OII], [NeIII] and [OIII] respectively. The two TNG spectra are shown in the same figure (the High Resolution spectrum in the middle, and the Medium Resolution spectrum at the bottom). The H emission line is visible in the HR spectrum with a measured FWHM270 km s-1, while [NeI] is better visible in the bottom spectrum of Fig. 2. The respective rest-frame full widths half maxima are FWHM480 km s-1 for [OIII] 4958 Å , FWHM623 km s-1 for [OIII] 5007 Å and FWHM608 km s-1 for [NeI] 5199 Å . H for this object at z0.6758 would fall at 11,000 Å , outside the range covered by this spectrum. The log ([OIII] 5007 / H) is 0.94, even higher than the NEP 1239, which can be again classified from the optical spectrum as a Seyfert 2 object.
-
•
NEP 2131: only for this object at z0.358 we were able to detect H. No UH spectrum was taken. The Multiple Mirror telescope spectrum obtained for us in July 97 by John Huchra is not given here since it is very similar to the TNG MR-B spectrum shown in Fig. 3 (top). The lines have the following widths: [NeV] has FWHM819 km s-1, [OII] has FWHM801 km s-1, [NeIII] has FWHM460 km s-1, H has FWHM633 km s-1, [OIII] 4958 Å has FWHM741 km s-1 and [OIII] 5007 Å has FWHM707 km s-1. H is not detected, an upper limit gives a flux less than 2.2 erg cm-2 s-1 Å -1. The log ([OIII] 5007 / H) is 1.22. H is visible in the TNG MR-I spectrum (bottom in Fig. 3). There are several sky lines which did not subtract well and which are indicated as “sky”. The FWHM of H is 726 km s-1 while the FWHM of [NII] is 804 km s-1. The log ([NII] 6583/H) is equal to 0.09, while log ([SII] (6712+6731)/H) is equal to -0.5. The line ratios place this object in the Seyfert 2 region of the diagnostic plots by Veilleux & Osterbrock (1987) or according to the recent revision of Kauffmann et al. (2003).
Thus all the emission lines detected in the three QSO 2 candidates are narrow lines, all with a FWHM less than 1000 km s-1, well within the cut-off broadness of 2000 km s-1 set for classification purposes in the NEP survey.
| NEP id # | Date | Instrument | Total | Flare-free | Total | Flare-free | |
|---|---|---|---|---|---|---|---|
| Net Counts | Net Counts | Exp. Time | Exp. Time | ||||
| (0.5-10 keV) | (0.5-10 keV) | sec | sec | ||||
| NEP 1239 | 06/27/2004 | MOS1 | 414.129.6 | 105.812.3 | 32,602 | 11,755 | |
| MOS2 | 485.833.6 | 150.414.1 | 32,575 | 12,165 | |||
| pn | 1238.077.0 | 299.818.8 | 24,761 | 5,837 | |||
| NEP 1640 | 03/11/2004 | MOS1 | 416.422.2 | 217.315.7 | 29,372 | 13,233 | |
| and 04/14/2004 | MOS2 | 427.223.4 | 243.616.1 | 29,385 | 15,093 | ||
| pn | 1339.945.4 | 412.420.7 | 26,612 | 6,022 | |||
| NEP 2131 | 05/14/2004 | MOS1 | 1063.941.5 | 685.027.3 | 30,955 | 21,433 | |
| MOS2 | 960.439.7 | 661.726.7 | 31,061 | 21,533 | |||
| pn | 2387.379.5 | 1892.945.6 | 24,063 | 16,905 |
3.2 XMM-Newton Data
XMM-Newton (Jansen et al., 2001) observed NEP 1239, NEP 1640 and NEP 2131
as part of the GO program in four epochs, March through June 2004,
with the European Photon Imaging Camera (EPIC) pn
(Struder et al., 2001) and with the EPIC MOS CCD arrays (Turner et al., 2001).
The journal of the observations is reported in Table 3.
The pn and MOS instruments were operating in full-frame mode with the
thin filter (thick for NEP 1640) applied. Event files produced from
the standard pipeline processing have been examined to recognize
high background time intervals (using the version 6.1.0 of the Science
Analysis Software, SAS, and the latest calibration files released by the
EPIC team). Only events corresponding to pattern 0-12 for MOS and pattern
0-4 for pn have been used333see the XMM-Newton Users’
Handbook
http://xmm.vilspa.esa.es/external/xmm_user_support/documentation/uhb/XMM_UHB.htm.
Good time intervals were selected by applying thresholds of 0.35 counts
s-1 in the MOS and 1 counts s-1 in the pn to the photons at
energies greater than 10 keV. At these higher energies counts come mostly
from background.
The net exposure times, before data cleaning, are of the order of 24-32ks
as listed in Table 3. These exposure times reduce to 5-21ks after
data cleaning thus reducing dramatically the count statistics.
The available statistics after cleaning becomes so poor that we decided
to retain time intervals of background flares. Given the point-like
morphology of the sources the total background count rate under their
extraction regions is still not very high even in the presence of
possible flares. On the other hand the improvement in source statistics
is much higher than the drawback of having a high noise.
In any case, we have performed analysis on both the total and flare-free
datasets and we find results consistent within the errorbars for
all parameters. Net counts and exposure times in seconds, before and
after cleaning (Total and Flare-free), are reported in Table 3.
X-ray source counts were extracted in circular regions centered on the
source with radius 30′′ (except for
NEP 1640 where a smaller 20′′ radius was used due to
the presence of other sources close to the target) and background
counts were extracted in a nearby source-free circular region
using a radius of 100′′. For only one source, NEP 1640,
the X-ray observations were performed in two diferent epochs.
The datasets were independently analyzed. Both source and background
spectra have been summed, while response matrices and auxiliary
files are the average of the two exposures, weighted by the different
exposure times. Response matrices at the position of the target source
have been generated using the SAS tasks arfgen and rmfgen.
The two MOS spectra are summed to improve the statistics.
Since the resulting relative normalization between the MOS and pn instruments
is always within 10% we give only fluxes for the MOS.
3.3 Spectral Analysis
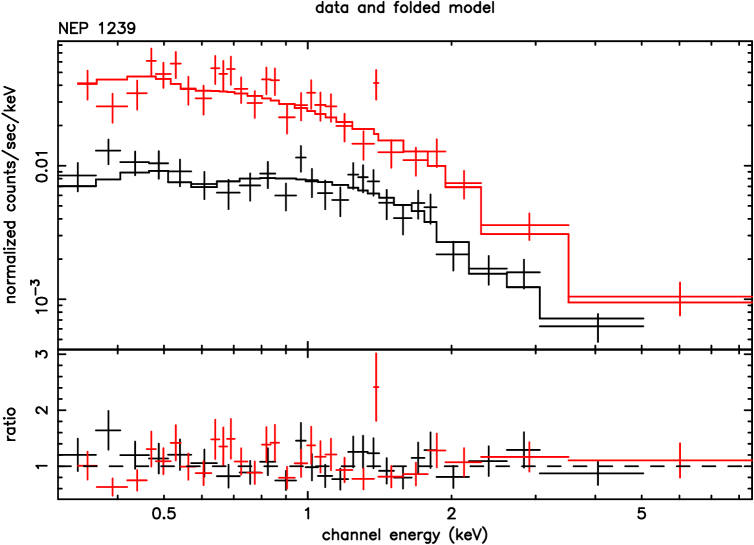
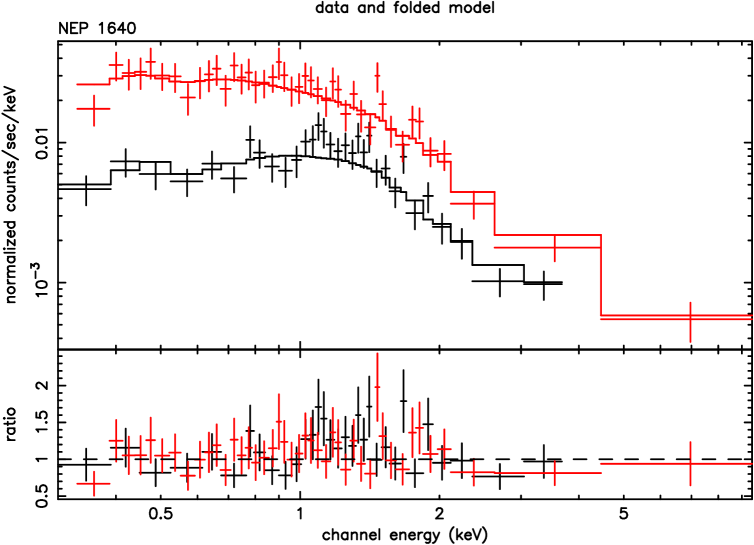
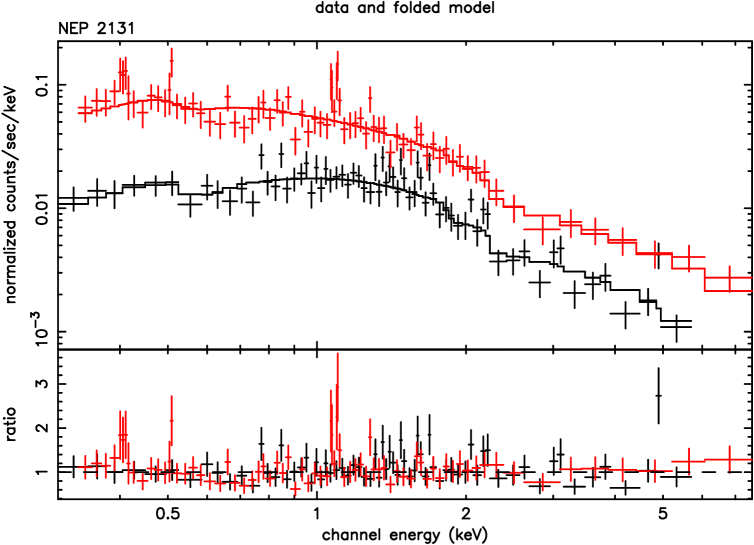
We used XSPEC (version 11.3.1) for spectral modelling. Spectral bins below 0.5 keV were excluded because of uncertain calibration, and those above 6 (10) keV where excluded for MOS (pn) because of the low statistical significance. Spectra were binned to have at least 20 counts and at least a significance of 4 in each bin. MOS and pn spectra were jointly fitted with independent relative normalizations to account for possible intercalibration differences or mismatches. The spectra are well fitted by a single power law model with low energy absorption fixed at the Galactic value along the line of sight to each object (Elvis et al., 1994; Stark et al., 1992) (see Table 1). Results are summarized in Table 4. The second column gives the values of the power low slope when the NH is fixed to the Galactic values of Table 1, while the third column indicates the range of additional intrinsic NH when it is left free to vary. The following columns list the values and degrees of freedom, null hypothesis probabilities, XMM-Newton fluxes and luminosities in different energy bands. The X-ray spectra are shown in figures 4 through 6. Taken at face value the X-ray spectra are not consistent with an obscuration scenario, that is the expected significant absorption at low energies, typical of QSO 2 objects, is not seen in any of the three XMM spectra. This is very surprising since the three objects all have the characteristics of QSO 2, that is narrow optical emission lines and X-ray luminosities at the 1044 erg s-1 level or higher.
| Name | NH | /dof | P | f0.5-2keV | f2-10keV | L2-10keV | |
|---|---|---|---|---|---|---|---|
| 1020 cm-2 | % | 10-13 erg cm-2 s-1 | 10-13 erg cm-2 s-1 | 1044 erg s-1 | |||
| NEP 1239 | 1.76 | 1.03/51 | 40 | 0.61 | 1.01 | 3.1 | |
| NEP 1640 | 1.88 | 0.88/72 | 75 | 0.82 | 1.14 | 2.2 | |
| NEP 2131 | 1.50 | 1.02/143 | 41 | 1.39 | 3.4 | 1.3 |
Unabsorbed fluxes and rest-frame K-corrected luminosities; NH is the range of total absorption at the quasar redshift, when left free to vary. P is the null hypothesis probability.
The X-ray spectrum for the first object, NEP 1239, is given in Fig. 4. The spectrum is well fitted by a power law model with 1.76 and shows no sign of absorption at low energies. When left free the total NH is cm-2 at the quasar redshift. Its 0.5–2 keV flux is about half the ROSAT NEP flux. Such variations are not unusual for AGN in the X-ray band (Mushotzky et al., 1993). The source probably was in a bright state at the time of the ROSAT observation thus favouring its detection. Even at the lower flux observed by XMM-Newton NEP 1239 would have made the cut-off threshold for inclusion in the sample of QSO 2 candidates. The faintness of the source was probably the reason why the NICS spectrum could not be taken (see Sect. 3.1). The fainter X-ray continuum should give more contrast to the presence of a Fe-line, which is however not detected (see below).
The spectrum of NEP 1640 (Fig. 5) is again well fit by a power law model with 1.88, with Galactic absorption. When left free to vary the total NH ranges between cm-2 at the quasar redshift.
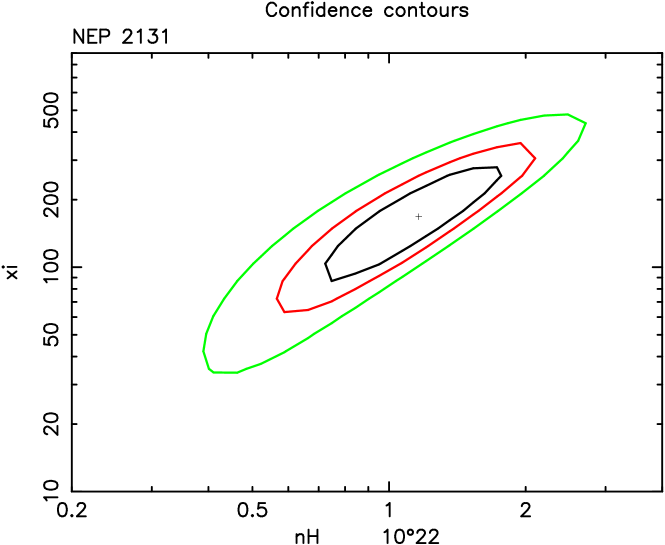
NEP 2131 has a rather flat spectrum (see Fig. 6). The fit is good, from a statistical point of view (see Table 4). When left as a free parameter the total NH is cm-2 at the quasar redshift. We can nonetheless investigate the possibility that the flatness is only apparent and indicative of absorption. A good fit is obtained by fixing the power law slope to the canonical value, with an absorption in the range (1.1 – 2.5) 1021 cm-2 (in the source rest frame). The residual low energy excess is well described by a thermal plasma (model mekal in XSPEC) with kT 0.16 keV. The standard explanation for the soft X-ray excess is thermal emission originating directly from the hot inner accretion disk (Malkan & Sargent, 1982). However for a sample of low redshift quasars in which both MBH and are measured (Porquet et al., 2004), the expected maximum temperature in the geometrically thin, optically thick accretion disk scenario is of the order of tens of eV, while the measured temperatures in the soft excess are of a few hundred eV. Compton upscattering of soft (EUV) disk photons in a hot plasma (the corona above the disk) is therefore a more realistic scenario for these objects. The measured temperature for the possibile soft excess in NEP 2131 with the same diskpn model as in Porquet et al. (2004) yields kT (7.5 keV, lower than what is measured for the low redshift quasars, but not enough to be explained by the accretion disk directly. An alternative scenario implies the presence of a ionized, high column density absorber. We have tested it by adding an ionized warm absorber (absori in XSPEC) to the power law fit. The formal fit gives an N and log. The contour plot of the error uncertainty of the 2 parameters is shown in Fig. 7. The formal best fit values are similar to those of the Sy 1 NGC 3783 (Netzer et al., 2003), which has a much higher statistics. However, the addition of the new component affects the spectrum only below keV. In this energy range the addition of a new component is significant only at 97% confidence (according to the F-test).
For the three sources, if the observed spectrum is due to reflection over a neutral medium, we would expect a prominent iron K line at around 6.4 keV rest-frame (see e.g. Matt et al., 1996). No line is evident in any of the three objects spectrum. However, given the relatively poor statistics, we fitted a narrow 6.4 keV line to each spectrum and derived the following equivalent width (EW) upper limits. For NEP 1239 we derive EW 250 eV, for NEP 1640 EW 190 eV, for NEP 2131 EW 240 eV. To better investigate the possibile presence of a Fe line we also used the software FLEX (described in Maccacaro et al., 2004; Braito et al., 2005) which searches for high S/N excesses in unbinned spectra. Even with this ad-hoc procedure no excess due to a possible Fe line at the source redshift was found in any of the three objects.
4 Discussion and Conclusions
From the optical point of view the three NEP objects all have the properties of Seyfert 2 objects both in the UH 2.2m and in the higher resolution TNG 3.6m spectra. The absence of a broad component in the H or H emission lines implies an extinction of at least a magnitude which for standard galactic relationship, NH/A cm-2 (Predehl & Schmitt, 1995), corresponds to N cm-2. We cannot set a more stringent limit from optical data since the broad components of H and H are not detected. However this lower limit is larger than the upper limit derived from simple modeling of the X-ray data. Within the Unified Model (Antonucci, 1993) we assume that the BLRs in these objects are obscured by some kind of medium, usually referred to as the “torus”. The optical light is mainly absorbed by dust, and the X-ray radiation by gas. The torus contains both media and therefore it absorbs both the optical and the X-ray emission. This relation between optical and X-ray absorption is supported by observational evidence (see e.g. Caccianiga et al., 2004), where optical and X-ray classification for obscuration agree, that is the optical and X-ray measured absorptions seem to be linked, or at least present in the same objects. There are a few known counter-examples (e.g. Brusa et al., 2003; Page et al., 2003; Nandra & Pounds, 1994) in which the X-ray derived absorption is higher than what is seen in the optical. This situation can have different explanations. It could be due to a different dust-to-gas ratio, to the presence of “large” dust grains (Maiolino et al., 2001), or to the dust being swept out by the ionizing radiation.
In the three objects under study here we have a situation where an absorber masks the radiation coming from an external zone, the BLR, but not the one from the inner zone, the nucleus. The X-ray spectrum is in fact well fitted by a canonical power law slope () with no requirement for additional intrinsic absorption at the source. Only if one assumes a more complex model, which is not statistically required by the data (as in NEP 2131 where the model has two additions: the absorption at low energies and an extra thermal component in the same energy range to account for the residuals), then a larger value for the intrinsic absorption is required. These three objects also differ from other objects, like NGC 4698, which is a peculiar Seyfert 2 with no intrinsic absorption, possibly the end product of a merger event (see e.g. Bertola et al., 1999), because they have high X-ray luminosities. Pappa et al. (2001) describe NGC 4698 as either a dusty warm absorber, or as an object with intrinsic lack of Broad Line clouds due to its low X-ray luminosity (i.e. lack of ionizing radiation to illuminate the clouds). Georgantopoulos & Zezas (2003) recompute the source luminosity to avoid contamination of other sources and reach the same conclusion of a lack of Broad Line Regions possibly due to low accretion rate. The three NEP objects all have luminosities at L erg cm-2 s-1 level thus making this explanation even less viable.
By using a sample of optically selected Seyfert 2, Panessa & Bassani (2002) estimate that the fraction of such galaxies which is Compton thin (N cm-2) is of the order of 10–20%. They propose the following explanations: either the BLRs are covered by a dusty obscuring material (dust patches, dust lanes, HII regions) or the BLRs are absent, weak or faded away. This interpretation is supported by the low (L erg s-1) luminosity of the nuclei. In addition the percentage of Compton thin objects seems to decrease with increasing luminosity, so this interpretation it’s not useful for our case. At higher luminosity, L erg s-1, Caccianiga et al. (2004) report a Sy 1.9 with no absorption representing, albeit large uncertainties, a fraction in their sample of 12%, similar to that found by Panessa & Bassani (2002). The presence of BLR clouds has been linked to the accretion rate (Nicastro, 2000) in such a way that there is an upper limit to the width of the lines corresponding to a minimum accretion rate dictated by the conditions of a Shakura & Sunyaev (1973) accretion disk. Thus low luminosity, low accretion rate nuclei cannot have Broad Emission Lines. The case for the present QSO2 is however more complex: they might have a very low accretion rate or, conversely, a very high one that would give origin to a BLR very far away from the nucleus and therefore in a region of low velocities that do not widen the lines.
There is always the possibility that the torus in the three NEP objects is Compton thick. The X-ray component would then be the reflection off the far side of the torus, that mantains the same slope as the direct component which is however completely blocked in the observed energy range. However, the FX/F[OIII] ratio for the three NEP objects has values consistent with “normal” type 1 objects, albeit within the calibration uncertainties of the optical spectra (for the use of the FX/F[OIII] as a diagnostic to find Compton thick objects, (see Maiolino et al., 1998; Panessa & Bassani, 2002). Furthermore, we would expect in the reflection spectra a prominent line (EW 1 keV) from neutral Fe (Matt et al., 2001). This line is not observed in any of the three objects. A further obstacle to the Compton thick interpretation is the high LX observed. If this is just a fraction (0.1-10%) of the total power, the intrinsic luminosity would be very high (1045-47 erg s-1). The spatial/volume density would need to be compared with the density of known AGN, that decrease accordingly by 2-5 orders of magnitude for increasing luminosity (see e.g. the XLF in Miyaji et al., 2000). The NEP QSO2 would represent a higher and higher fraction, even exceeding by orders of magnitude the density of known AGN.
The most similar object we have found in literature is H1320551 (Barcons et al., 2003), which is a Seyfert 1.8/1.9. We do not have the same spectral resolution and S/N as the above authors, so we cannot exclude that also our candidates have a broad base to the Balmer lines, but the overall shape is the same. Barcons et al. (2003) suggest that the narrow line region is internally reddened in H1320+551, but with a small covering factor over the nuclear emission, and that the Balmer decrement of the BLR is an instrisic property rather than caused by reddening or absorption. H1320551 has a weak Fe K detection (EW 400eV) too faint for the source to be Compton-thick. A similar example is XBSJ031146.1-550702 classified as Sy 1.9 by Caccianiga et al. (2004). Its X-ray emission does not show significant absorption and is probably Compton-thin. If one assumes that what is seen in these sources at X-ray wavelengths is actually the direct nuclear component then one could still keep the Unified Model paradigm by assuming that the intervening gas is completely ionized, and therefore transparent to the X-ray radiation, while the dust in the torus absorbs the optical BLR. This in turn implies that the accretion is inefficient: moderate accretion rate with low radiative efficiency in the form of either an Advection Dominated Accretion Flow (ADAF; see e.g. Narayan & Yi, 1995) or a Radiatively Inefficient Accretion Flow (RIAF; see e.g. Quataert, 2003), and therefore at sub-Eddington regimes. To be sub-Eddingtion (i.e. Lbol/L) implies L erg s-1 for these objects and therefore M M⊙. At the moment we cannot estimate the black hole mass, but this would be a crucial information to acquire to push the limits of the Unified Models.
The virtually complete identification rate of the ROSAT NEP survey (99.6%, Gioia et al., 2003) allows us to derive for the first time an estimate of the spatial density of such sources in soft X-ray sky. The spatial density of the NEP QSO 2 candidates is with a density-weighted average luminosity of L erg s-1. We can compare it with the most recent estimates in literature (see discussion in Ueda et al., 2003). The NEP point is an order of magnitude below any of the different redshift bin curves in Fig. 15 of Ueda et al. 2003. Therefore this indicates that this class of soft X-ray selected unobscured QSO2, if it is indeed a new class, and if the are really unobscured provides a very small contribution to the total luminosity density. Since these are most probably objects with no absorption, they do not make up the missing population of the XRB. This result is not completely unexpected since the sources have been selected to be bright in the soft X-ray band of ROSAT, while obscured objects are better detected in hard X-rays where the reflection component becomes dominant, and/or the direct component is not absorbed. Similar objects might be present in current X-ray surveys. For instance, unobscured QSO 2 candidates might be lurking in hard X-ray surveys like the ASCA Medium Sensitivity Survey (Akiyama et al., 2003), where the low hydrogen column density is inferred by a hardness ratio rather than from a more precise X-ray spectrum. See the large crosses at the bottom of Fig. 10a in Akiyama et al. (2003) which represent AGN with no broad H, low NH (log NH 20) but large X-ray luminosity (log LX 44). Also the XMM-Newton Bright Serendipitous Survey (Della Ceca et al., 2004) contains possibile unobscured QSO2 candidates. A large fraction (more than 60%) of the Narrow Line AGN in this survey (see Fig. 4a in Della Ceca et al., 2004, and relative discussion) has an hardness ratio in the same range as the Broad Line AGN. Only a couple of these sources might have a luminosity in the QSO range (Caccianiga private communication). A similar interesting object with narrow optical emission lines, high X-ray luminosity and no evidence for obscuration in the X-ray spectrum, namely XLEO J0332-2744, was recently published in Braito et al. (2005). However, differently from the three NEP objects, XLEO J0332-2744 shows a strong (EW = 0.5 - 1.9 keV) Fe-line which is not present in our X-ray spectra.
Further observations are needed to strengthen our findings. We need a better coverage of the H region, we need to measure the optical extinction directly from the optical continuum shape, and possibly the central Black Hole mass that is expected to be in the 1010 M⊙ range. Ultimately higher energy X-ray observations will say the final word on the presence of a Compton thick absorber in these objects.
Acknowledgements.
The work presented here is based on observations made with the Italian Telescopio Nazionale Galileo (TNG) operated on the island of La Palma by the Centro Galileo Galilei of the INAF (Istituto Nazionale di Astrofisica) at the Spanish Observatorio del Roque de los Muchachos of the Instituto de Astrofisica de Canarias and on observations obtained with XMM-Newton, an ESA science mission with instruments and contributions directly funded by ESA member states and NASA. A special thank to Valentina Braito for performing the FLEX check. We would like to thank our colleagues Luigi Foschini, Laura Maraschi, Nick Scoville and Paola Severgnini for many useful discussions. We thank an anonymous referee for a number of useful suggestions and comments. IMG thanks the hospitality of the Institute for Astronomy of the University of Hawai′i where part of this paper was written. She also notes that this work was done in spite of the continued efforts by the Italian government to dismantle publicly-funded fundamental research. This work was partially supported by NASA grant NNG05GA70G.References
- Akiyama et al. (2000) Akiyama, M., Ohta, K., Yamada, T., et al. 2000, ApJ, 532, 700
- Akiyama et al. (2002) Akiyama, M., Ueda, Y., & Ohta, K. 2002, ApJ, 567, 42
- Akiyama et al. (2003) Akiyama, M., Ueda, Y., Ohta, K., Takahashi, T., & Yamada, T. 2003, ApJS, 148, 275
- Almaini et al. (1995) Almaini, O., Boyle, B. J., Griffiths, R. E., et al. 1995, MNRAS, 277, L31
- Antonucci (1993) Antonucci, R. 1993, ARA&A, 31, 473
- Barcons et al. (1998) Barcons, X., Carballo, R., Ceballos, M. T., Warwick, R. S., & Gonzalez-Serrano, J. I. 1998, MNRAS, 301, L25
- Barcons et al. (2003) Barcons, X., Carrera, F. J., & Ceballos, M. T. 2003, MNRAS, 339, 757
- Bertola et al. (1999) Bertola, F., Corsini, E. M., Vega Beltrán, J. C., et al. 1999, ApJ, 519, L127
- Boyle et al. (1998) Boyle, B. J., Almaini, O., Georgantopoulos, I., et al. 1998, MNRAS, 297, L53
- Braito et al. (2005) Braito, V., Maccacaro, T., Caccianiga, A., Severgnini, P., & Della Ceca, R. 2005, ApJ, 621, L97
- Brandt et al. (2001) Brandt, W. N., Alexander, D. M., Hornschemeier, A. E., et al. 2001, AJ, 122, 2810
- Brusa et al. (2003) Brusa, M., Comastri, A., Mignoli, M., et al. 2003, A&A, 409, 65
- Caccianiga et al. (2004) Caccianiga, A., Severgnini, P., Braito, V., et al. 2004, A&A, 416, 901
- Comastri et al. (2000) Comastri, A., Fiore, F., Giommi, P., et al. 2000, in Broad Band X-ray Spectra of Cosmic Sources, 833–+
- Comastri et al. (1995) Comastri, A., Setti, G., Zamorani, G., & Hasinger, G. 1995, A&A, 296, 1
- Dawson et al. (2001) Dawson, S., Stern, D., Bunker, A. J., Spinrad, H., & Dey, A. 2001, AJ, 122, 598
- Della Ceca et al. (2003) Della Ceca, R., Braito, V., Beckmann, V., et al. 2003, A&A, 406, 555
- Della Ceca et al. (2004) Della Ceca, R., Maccacaro, T., Caccianiga, A., et al. 2004, A&A, 428, 383
- Elvis et al. (1994) Elvis, M., Lockman, F. J., & Fassnacht, C. 1994, ApJS, 95, 413
- Fiore et al. (2003) Fiore, F., Brusa, M., Cocchia, F., et al. 2003, A&A, 409, 79
- Fiore et al. (2001) Fiore, F., Giommi, P., Vignali, C., et al. 2001, MNRAS, 327, 771
- Fiore et al. (1999) Fiore, F., La Franca, F., Giommi, P., et al. 1999, MNRAS, 306, L55
- Georgantopoulos et al. (1999) Georgantopoulos, I., Almaini, O., Shanks, T., et al. 1999, MNRAS, 305, 125
- Georgantopoulos & Zezas (2003) Georgantopoulos, I. & Zezas, A. 2003, ApJ, 594, 704
- Giacconi et al. (2001) Giacconi, R., Rosati, P., Tozzi, P., et al. 2001, ApJ, 551, 624
- Gilli et al. (1999) Gilli, R., Risaliti, G., & Salvati, M. 1999, A&A, 347, 424
- Gilli et al. (2001) Gilli, R., Salvati, M., & Hasinger, G. 2001, A&A, 366, 407
- Gioia et al. (2003) Gioia, I. M., Henry, J. P., Mullis, C. R., et al. 2003, ApJS, 149, 29
- Goodrich (1989) Goodrich, R. W. 1989, ApJ, 342, 224
- Guainazzi et al. (2001) Guainazzi, M., Fiore, F., Matt, G., & Perola, G. C. 2001, MNRAS, 327, 323
- Halpern et al. (1999) Halpern, J. P., Turner, T. J., & George, I. M. 1999, MNRAS, 307, L47
- Hasinger et al. (2001) Hasinger, G., Altieri, B., Arnaud, M., et al. 2001, A&A, 365, L45
- Henry et al. (2001) Henry, J. P., Gioia, I. M., Mullis, C. R., et al. 2001, ApJ, 553, L109
- Huchra & Burg (1992) Huchra, J. & Burg, R. 1992, ApJ, 393, 90
- Jansen et al. (2001) Jansen, F., Lumb, D., Altieri, B., et al. 2001, A&A, 365, L1
- Kauffmann et al. (2003) Kauffmann, G., Heckman, T. M., Tremonti, C., et al. 2003, MNRAS, 346, 1055
- Maccacaro et al. (2004) Maccacaro, T., Braito, V., Della Ceca, R., Severgnini, P., & Caccianiga, A. 2004, ApJ, 617, L33
- Madau et al. (1994) Madau, P., Ghisellini, G., & Fabian, A. C. 1994, MNRAS, 270, L17+
- Mainieri et al. (2002) Mainieri, V., Bergeron, J., Hasinger, G., et al. 2002, A&A, 393, 425
- Maiolino et al. (2001) Maiolino, R., Marconi, A., & Oliva, E. 2001, A&A, 365, 37
- Maiolino & Rieke (1995) Maiolino, R. & Rieke, G. H. 1995, ApJ, 454, 95
- Maiolino et al. (1998) Maiolino, R., Salvati, M., Bassani, L., et al. 1998, A&A, 338, 781
- Malkan & Sargent (1982) Malkan, M. A. & Sargent, W. L. W. 1982, ApJ, 254, 22
- Matt et al. (1996) Matt, G., Brandt, W. N., & Fabian, A. C. 1996, MNRAS, 280, 823
- Matt et al. (2001) Matt, G., Guainazzi, M., Perola, G. C., et al. 2001, A&A, 377, L31
- Miyaji et al. (2000) Miyaji, T., Hasinger, G., & Schmidt, M. 2000, A&A, 353, 25
- Mullis (2001) Mullis, C. R. 2001, Ph.D. Thesis
- Mushotzky et al. (2000) Mushotzky, R. F., Cowie, L. L., Barger, A. J., & Arnaud, K. A. 2000, Nature, 404, 459
- Mushotzky et al. (1993) Mushotzky, R. F., Done, C., & Pounds, K. A. 1993, ARA&A, 31, 717
- Nandra & Pounds (1994) Nandra, K. & Pounds, K. A. 1994, MNRAS, 268, 405
- Narayan & Yi (1995) Narayan, R. & Yi, I. 1995, ApJ, 452, 710
- Netzer et al. (2003) Netzer, H., Kaspi, S., Behar, E., et al. 2003, ApJ, 599, 933
- Nicastro (2000) Nicastro, F. 2000, ApJ, 530, L65
- Norman et al. (2002) Norman, C., Hasinger, G., Giacconi, R., et al. 2002, ApJ, 571, 218
- Ohta et al. (1996) Ohta, K., Yamada, T., Nakanishi, K., et al. 1996, ApJ, 458, L57+
- Osterbrock & Pogge (1985) Osterbrock, D. E. & Pogge, R. W. 1985, ApJ, 297, 166
- Page et al. (2003) Page, K., Turner, M., Reeves, J., O’Brien, P., & Sembay, S. 2003, Astronomische Nachrichten, 324, 167
- Panessa & Bassani (2002) Panessa, F. & Bassani, L. 2002, A&A, 394, 435
- Pappa et al. (2001) Pappa, A., Georgantopoulos, I., Stewart, G. C., & Zezas, A. L. 2001, MNRAS, 326, 995
- Porquet et al. (2004) Porquet, D., Reeves, J. N., O’Brien, P., & Brinkmann, W. 2004, A&A, 422, 85
- Predehl & Schmitt (1995) Predehl, P. & Schmitt, J. H. M. M. 1995, A&A, 293, 889
- Quataert (2003) Quataert, E. 2003, Astronomische Nachrichten Supplement, 324, 435
- Risaliti et al. (2003) Risaliti, G., Elvis, M., Gilli, R., & Salvati, M. 2003, ApJ, 587, L9
- Rosati et al. (2002) Rosati, P., Tozzi, P., Giacconi, R., et al. 2002, ApJ, 566, 667
- Schmidt et al. (1998) Schmidt, M., Hasinger, G., Gunn, J., et al. 1998, A&A, 329, 495
- Setti & Woltjer (1989) Setti, G. & Woltjer, L. 1989, A&A, 224, L21
- Shakura & Sunyaev (1973) Shakura, N. I. & Sunyaev, R. A. 1973, A&A, 24, 337
- Silverman et al. (2005) Silverman, J. D., Green, P. J., Barkhouse, W. A., et al. 2005, ApJ, 618, 123
- Stark et al. (1992) Stark, A. A., Gammie, C. F., Wilson, R. W., et al. 1992, ApJS, 79, 77
- Stern et al. (2002) Stern, D., Moran, E. C., Coil, A. L., et al. 2002, ApJ, 568, 71
- Struder et al. (2001) Struder, L., Briel, U., Dennerl, K., et al. 2001, A&A, 365, L18
- Turner et al. (2001) Turner, M. J. L., Abbey, A., Arnaud, M., et al. 2001, A&A, 365, L27
- Ueda et al. (2003) Ueda, Y., Akiyama, M., Ohta, K., & Miyaji, T. 2003, ApJ, 598, 886
- Veilleux & Osterbrock (1987) Veilleux, S. & Osterbrock, D. E. 1987, ApJS, 63, 295
- Voges et al. (1999) Voges, W., Aschenbach, B., Boller, T., et al. 1999, A&A, 349, 389
- Voges et al. (2001) Voges, W., Henry, J. P., Briel, U. G., et al. 2001, ApJ, 553, L119