PKS 074367: An Ultra-luminous Accretion Disk and a High Kinetic Luminosity Jet
Abstract
In this letter, deep radio observations of the quasar PKS 074367 are presented that reveal a central engine capable of driving jets with enormous kinetic luminosity, . This result is significant because archival optical spectral data indicates that the accretion disk has a thermal luminosity, . Furthermore, estimates of the central black hole mass from line widths indicate that . This suggests that neither a large nor suppresses jet power in quasars, despite claims that they do in the recent literature. Earlier studies have found and are correlated in blazars. However, by removing the BL-Lacs and leaving only the quasars in the sample, we found that is very weakly correlated with in the subsample.
1 Introduction
The connection between accretion flow parameters and radio jet production is a mysterious one. It has been argued in Wang et al (2004) that the jet kinetic luminosity, , is correlated with the bolometric luminosity of the thermal emission, , produced by the accretion flow in blazar type AGN. However, using virtually identical techniques as Wang et al (2004), Celotti et al (1997) came to the opposite conclusion. In order to shed some light on this issue, we explore this question from a different perspective for the particular case of quasars. The vast majority () of quasars are radio quiet whether their lies just above the Seyfert 1/ quasar dividing line or if they are at the other extreme, . This observation indicates that there are additional parameters, beyond that , that control the power of the radio jet. We note that the very high , FRII radio source, Cygnus A, (according to (1.1) of this article), harbors a hidden quasar with just above the Seyfert 1/ quasar dividing line and has a low Eddington rate, the ratio of to the Eddington accretion rate, Young et al (2002); Tadhunter et al (2003). Cygnus A is an extremely powerful FR II radio source even when compared with low frequency selected samples at high redshift (Willott et al, 1999). It has two orders of magnitude higher than most FR II quasars (see Chapter 10 of Punsly (2001) and references therein). Thus, Cygnus A provides a well studied ”standard” candle for an extremely powerful FR II source. This motivated us to explore the opposite extreme in the quasar family, the very powerful quasar PKS 074367, which is luminous in all frequency bands and seemed to be a likely candidate for extremely high jets. In sections 3 and 4, it is shown that it has a has a powerful accretion luminosity, , , a strong unresolved VLBI radio core and prominent radio lobes. Even though the quasar is at a redshift of (Bechtold et al., 2002), both the radio core and the radio lobe flux densities are .
In section 5, it is demonstrated that the high for these two extreme ends of the quasar range, Cygnus A and PKS 0743-067, are not out of line with the properties of the quasar population as a whole. By studying a sample of quasars from Wang et al (2004), we find that is not correlated with for radio loud quasars that possess blazar cores. Secondly, we demonstrate that the inverse correlation claimed between and in Wang et al (2004), although true, is a trivial consequence of the fact that is not correlated with in quasars. The primary conclusion of this study is that the intrinsic power of a quasar jet is not, to first order, controlled by the accretion rate.
We have performed deep radio observations with the Australia Telescope National Facility (ATCA) in order to understand the radio structure of PKS 0743673; the lobe emission alone would qualify it for the 3C catalogue if the source were in the Northern Hemisphere, our observations indicate that the jet kinetic luminosity, , is far more powerful than that in Cygnus A.
2 The Radio Observations
Previously, Rayner et al (2000) imaged the radio structure of PKS 0743673 at 4.8 GHz with the ATCA. We performed deep observations at 2.496, 4.800 and 8.640 GHz in order to image the source structure and obtain higher resolution as well as spectral and polarization data. It is essential to obtain both higher resolution and accurate spectral data to assess the energy content of the extended structure. Our 8.640 GHz map is shown in Figure 1.

The data from our ATCA observations are presented in Table 1. Quasars with a strong flat spectrum core often have Doppler enhanced kpc scale jets (Punsly, 1995). Thus, an estimate of in PKS 074367 requires an analysis of the data in Table 1 in order to determine if the jet and lobe emission to the east of the nucleus is Doppler enhanced or not. The components E1, E2, E3 denote the eastern jet/lobe components in Figure 1, numbered consecutively from west to east.
| Comp. | ||||
| (GHz) | (Jy) | % | ||
| 2.496 | W | 0.17 | 11 | … |
| C | 1.34 | 7 | … | |
| E1 | … | … | … | |
| E2 | 0.53 | 11 | … | |
| E3 | 0.75 | 14 | … | |
| 4.800 | W | 0.08 | … | 1.16 |
| C | 1.17 | 8 | 0.21 | |
| E1 | 0.02 | 28 | … | |
| E2 | 0.31 | 22 | 0.82 | |
| E3 | 0.45 | 15 | 0.78 | |
| 8.640 | W | 0.04 | … | 1.17 |
| C | 1.25 | 5 | 0.06 | |
| E1 | 0.01 | 52 | … | |
| E2 | 0.16 | 26 | 0.98 | |
| E3 | 0.24 | 15 | 0.93 |
In Figure 1, the magnetic field (perpendicular to the electric field vectors plotted) at the core is parallel to the jet direction and remains parallel to the jet direction along the length of the jet, even though the eastern jet goes through a large apparent bend. At the end of the eastern jet, the magnetic field switches to being perpendicular to the jet direction, typical of a radio galaxy hot spot.
3 Estimating the Jet Kinetic Luminosity
In order to avoid the ambiguities associated with Doppler enhancement, we estimate the jet kinetic luminosity from the isotropic extended emission, applying a method that allows one to convert 151 MHz flux densities, , measured in Jy, into estimates of kinetic luminosity, , from Willott et al (1999); Blundell and Rawlings (2000) by means of the formula derived in Punsly (2005):
| (3-1) | |||
| (3-2) |
where is the total optically thin flux density from the lobes (i.e., no contribution from Doppler boosted jets or radio cores). We assume a cosmology with =70 km/s/Mpc, and . In order to implement this technique, one needs to determine which components are optically thin and which are Doppler enhanced.
There are two possible interpretations of the data that one can use to calculate . The most straightforward approach is to note that all of the emission is optically thin and the large angular size of the source, , argues against significant Doppler enhancement of the large-scale structures. However, we choose the most conservative approach: assume that all of the eastern emission is part of a jetted system and it is all Doppler enhanced, even the hot spot to some extent (this would explain why the eastern hot spot is more luminous than the western hot spot). If the source were symmetric and viewed in the sky plane then an upper limit to the total flux would be twice the observed flux from the western hotspot, 340 mJy at 2.496 GHz. Extrapolating this to 151 MHz, yields a lobe flux of 8.8 Jy. Inserting this value into (3.1) yields ergs/sec. This equates to 2.5 times the kinetic luminosity of Cygnus A computed by the same method. If the eastern lobe is not Doppler enhanced then the kinetic luminosity is even larger. We note that no 151 MHz observations of PKS 0743673 have been made. However, Large et al (1981) measured the total flux density at 408 MHz to be 8.6 Jy. This measurement will be dominated by the extended emission of the source, making an estimate of 8.8 Jy at 151 MHz for the unbeamed emission conservative.
A 2.3 GHz VLBI measurement of PKS 0743-67 was made in Preston et al (1989). A secondary unresolved radio structure, presumably a strong knot in a jet, is directed to the east of the core towards the base of the kpc jet seen in figure 1. The VLBI emission is dominated by an unresolved core on the 10 milliarcsecond scale with 1.2 Jy. Not only is the time averaged from PKS 0743-67 enormous, but the powerful parsec scale core indicates that the source is still likely to be highly energetic at the current time.
4 Estimating the Eddington Ratio
One can estimate as in Laor (1998), , a method that has been applied to both radio quiet and radio loud quasars. We apply this formula to the flux density at from the spectrum of PKS 0743-67 in Alighieri et al (1994), yielding . When making an estimate of the accretion flow luminosity, the strong radio core might raise some concern about contamination of the optical emission via a high frequency synchrotron spectrum associated with the base of the jet. Thus, alternatively, one could get an estimate of using the method of Wang et al (2004) that depends on line luminosity. Following the discussion in section 3 of Wang et al (2004), the CIV/Ly line strength ratio of the composite quasar spectra in Francis et al (1991), and eqn(1) of Wang et al (2004) implies that the total broad line luminosity is , where is the CIV line strength. Secondly, Wang et al (2004) estimate , thus . Using the CIV line strength from Alighieri et al (1994) this implies , in close agreement with the estimate above from the spectrum directly.
One can estimate using the value above in conjunction with a mass estimate of the black hole mass, , from the same CIV emission line. The estimator of of Vestergaard (2002) requires the luminosity at , . To be consistent with the philosophy of not using the continuum spectrum, one can instead estimate from the that is derived from the CIV line strength above with the aid of the relation from Laor (1998), and assuming a typical quasar optical spectral index of 0.7 as was done in Wang et al (2004) (the spectrum in Alighieri et al (1994) yields a similar value, 0.75). One finds a central black hole mass of and . One can check this result independently using the H line of PKS 0743-67 measured in Espey et al (1989) and the estimators in Greene and Ho (2005), and . Converting the line luminosity to as for the CIV estimate above, one finds and .
5 Comparison With Other Results
Ostensibly, the existence of a high and high source such as 0743-67 appears at odds with the result of Wang et al (2004), is inversely correlated with . The large Q of Cygnus A appears at odds with the other conclusion of Wang et al (2004), Q is positively correlated with . However, closer inspection of the raw data used in Wang et al (2004) indicates that this is not actually the case.
The virtue of the estimates in Wang et al (2004) is that they use the parsec scale jet emission to estimate contemporaneously with the estimate of . However, we warn the reader that such estimates are very sensitive to the uncertain Doppler factor. The method that Wang et al (2004) adopted from Celotti et al (1997) assumes that the X-ray energy emission is from synchrotron self Compton emission (SSC), however Dermer and Schlickheiser (1993) showed that external Compton (ECS) scattering of quasar disk photons or broad line region photons by energetic particles in the jet will usually dominate the high energy quasar spectrum, since ECS emission is enhanced by the jet Lorentz factor to the sixth power. This type of estimator can lead to enormous errors in the estimated values of . As an example, Wang et al (2004) estimate for 4C 52.27 (1317+520), , where is the kinetic luminosity of Cygnus A. By contrast, using the radio maps in Hintzen et al (1983) and the isotropic estimator in (3.1), we find a more reasonable value of .
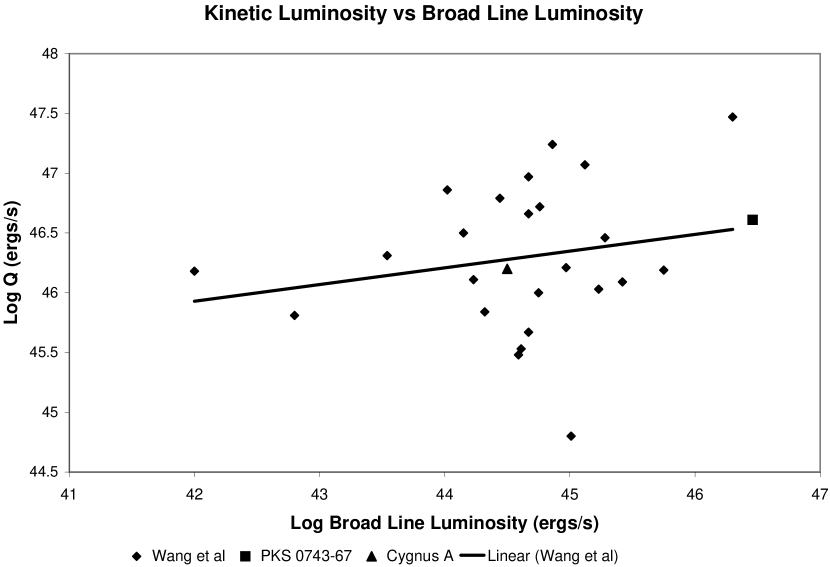
First of all, Wang et al (2004) present data in their log-log plot in figure 1a indicating that and have a strong linear correlation (note that they assume that ). However, if one removes the BL-Lacs from the sample and fit a line to just the quasars on a log-log plot that is otherwise identical to figure 1a of Wang et al (2004) then the squared multiple regression correlation coefficient, . If one removes the extreme estimate associated 4C 52.27 that was given above, the linear fit is even worse, and this result is displayed in figure 2a. This corresponds to a correlation coefficient, and the probability of getting this by chance is . The data in figure 2 is lifted directly from Wang et al (2004), so all the estimates are identical. The data of Wang et al (2004) actually shows that and are very weakly correlated in quasars.
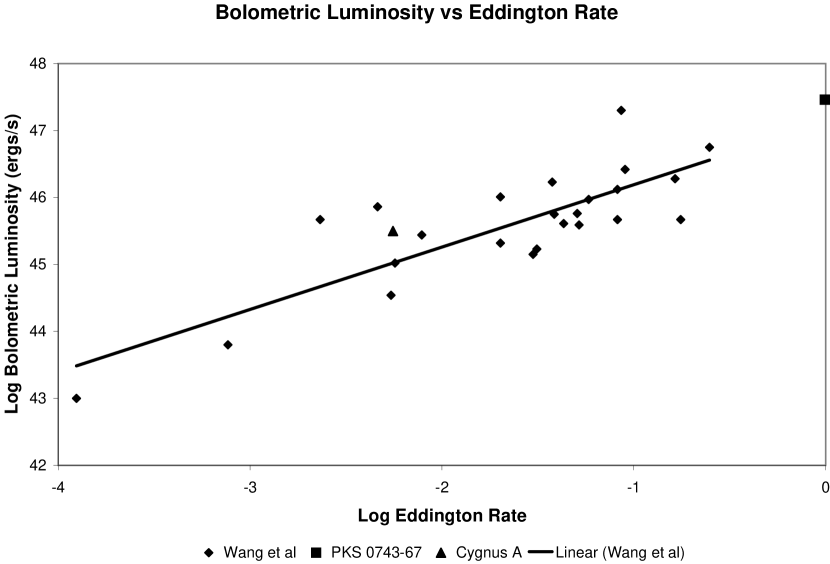
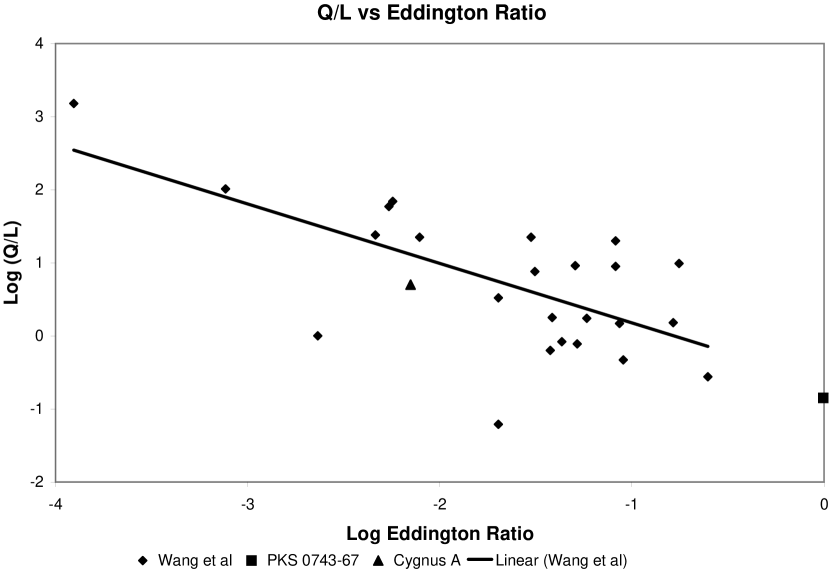
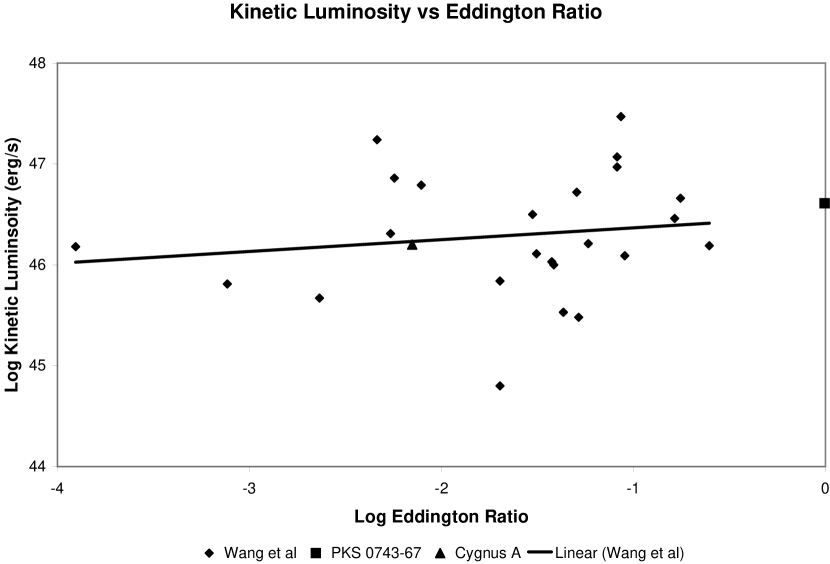
The other result of Wang et al (2004) that and are inversely correlated actually follows trivially as a consequence of the fact that is uncorrelated with for quasars and is strongly correlated with . This latter correlation is not surprising; it is the strongest correlation amongst quasar parameters in Wang et al (2004), the best linear fit is (see figure 2b). The correlation coefficient is and . Since is uncorrelated with , it follows that (where we have introduced the symbol to represent correlation) and from figure 2b. Combining the two relations, it follows that , i.e., and are inversely correlated as shown in figure 2c. The best linear fit is and the correlation coefficient for and is for the subsample of quasars, with . The anti-correlation of and is spurious: there is no direct causal link between the these two variables as expressed statistically by small value of the partial correlation coefficient of versus with held fixed, -0.030. Finally, we note that this result does not imply that there is the potentially interesting correlation between and as evidenced by figure 2d. The correlation is very weak, and .
6 Conclusion
PKS 074367 is an example of a quasar that has an ultra-luminous accretion flow, , a very high Eddington rate, with , and is presently active as evidenced by the powerful unresolved VLBI radio core. By contrast, the high source Cygnus A lies at the low end of the quasar range of and has a small and is also presently active as evidenced by the jet extending from the lobes to within a few light years of the central black hole (see figure 1.10 of Punsly (2001)). Using a large sample of quasars in figure 2, it was shown that is uncorrelated with . Hence, the diverse values of in Cygnus A and PKS 0743-67 should not be unexpected. It appears that to first order, the parameters and are unrelated to the intrinsic quasar jet power. This is consistent with the observation that of quasars are radio quiet, from the most luminous quasars down to the quasar/Sevfert 1 dividing line. Consider the wide range of in quasars that are associated with very powerful jets. It is argued in Semenov et al (2004) and Punsly (2001) that a significant large scale magnetic flux near a rapidly spinning black hole is the missing ingredient and is the primary determinant of FRII quasar jet power, not the accretion flow.
References
- Alighieri et al (1994) Alighieri, S. diSergeo, et al 1994, MNRAS 269 998
- Bechtold et al. (2002) Bechtold, J. et al 2002, ApJ, 140, 143
- Blundell and Rawlings (2000) Blundell, K., Rawlings, S. 2000, AJ 119 1111
- Celotti et al (1997) Celotti, A., Padovani and Ghisellini, G. 1997, MNRAS 286 415
- Dermer and Schlickheiser (1993) Dermer, C., Schlickheiser, R. 1993, ApJ 416 458
- Espey et al (1989) Espey, B., Carswell, R., Bailey, J., Smith, M., Ward, M., 1989 ApJ 342 666
- Francis et al (1991) Francis, P. et al 1991, ApJ 373 465
- Greene and Ho (2005) Greene, J., Ho, L. 2005 astro-ph/0508335 to appear in ApJ
- Hintzen et al (1983) Hintzen, P., Ulvestad, J., Owen, F. 1983, AJ 88 709.
- Large et al (1981) Large, M.I., Mills, B.Y., Crawford, D.F. & Sutton, J.M. 1981, MNRAS, 194, 693
- Laor (1998) Laor, A. 1998, ApJL 505 L83
- Laor (2000) Laor, A. 2000, ApJ 543 L111
- Preston et al (1989) Preston., R. et al 1989, AJ 981
- Punsly (1995) Punsly, B. 1995, AJ 109 1555
- Punsly (2001) Punsly, B. 2001, Black Hole Gravitohydromagnetics (Springer-Verlag, New York)
- Punsly (2005) Punsly, B. 2005, ApJL 623 L12
- Rayner et al (2000) Rayner, D., Norris, R., Sault, R. 2000, MNRAS 319, 484
- Semenov et al (2004) Semenov, V. Dyadechkin, S., Punsly, B. 2004, Science 305 978
- Tadhunter et al (2003) Tadhunter, C. et al 2003, MNRAS 342 861
- Vestergaard (2002) Vestergaard, M 2002, ApJ 571 733
- Wang et al (2004) Wang, J.-M., Luo, B, Ho, L. 2004, ApJL 615 9
- Willott et al (1999) Willott, C., Rawlings, S., Blundell, K., Lacy, M. 1999, MNRAS 309 1017
- Young et al (2002) Young, A. et al 2002, ApJ 564 176