Simultaneous XMM-Newton and ESO VLT observations of SN 1995N: probing the wind/ejecta interaction ††thanks: Based on observations collected at ESO (programs 71.D-0265(A) and 71.D-0265(B)). Based on observations obtained with XMM-Newton (Obs. ID 0149620201), an ESA science mission with instruments and contributions directly funded by ESA Member States and NASA.
Abstract
We present the results of the first XMM-Newton observation of the interacting type IIn supernova 1995N, performed in July 2003. We find that the 0.2–10.0 keV unabsorbed flux dropped at a value of erg cm-2 s-1, almost one order of magnitude lower than that of a previous ASCA observation of January 1998. From all the available X-ray measurements, an interesting scenario emerges where the X-ray light emission may be produced by a two-phase (clumpy/smooth) CSM. The X-ray spectral analysis shows statistically significant evidence for the presence of two distinct components, that can be modeled with emission from optically thin, thermal plasmas at different temperatures. The exponent of the ejecta density distribution inferred from these temperatures is . From the fluxes of the two spectral components we derive an estimate of the mass loss rate of the supernova progenitor, , at the upper end of the interval exhibited by red super-giants. Coordinated optical and infrared observations allow us to reconstruct the simultaneous infrared to X-ray flux distribution of SN 1995N. We find that, at 9 years after explosion, the direct X-ray thermal emission due to the wind/ejecta interaction is times larger than the total reprocessed IR/optical flux.
keywords:
supernovae: general — supernovae: individual: SN 1995N — infrared: stars — ultraviolet: stars – X-rays: stars — X-rays: individual: SN 1995N| Start Date | MJD | Observatory | Instrument | Range/Filter/Grism | Program/Obs. ID |
|---|---|---|---|---|---|
| 2003-07-27 | 52847.2 | XMM-Newton | EPIC pn+MOS, OM | 0.2–10 keV, | 0149620201 |
| 2003-07-30 | 52850.0 | VLT | FORS2 | , grism 300V+GG435 | 71.D-0265(A) |
| 2003-07-30 | 52850.1 | VLT | ISAAC | 71.D-0265(B) |
1 Introduction
Among all core-collapse supernovae, the particular subclass of Type IIn supernovae shows prominent multi-component hydrogen emission lines in their optical spectra. Type IIn supernovae have been termed also compact supernova remnants or Seyfert 1 impostors, because of the peculiar profiles of the emission lines and the similarity of their spectra to those of the Broad Line Region in AGNs. These lines are thought to originate from the reprocessing of radiation generated by a violent collision of the supernova ejecta with a dense surrounding gas released by the progenitor star in a previous evolutionary stage. The interaction generates forward and reverse shock waves which bound the shocked wind and ejecta. This mechanism appears to be the non-relativistic analogue of the blast wave interaction occurring in -ray burst afterglows. The pressure and temperature behind the shocks are sufficiently high that the post-shock ejecta and circumstellar material (CSM) may become powerful X-ray emitters (Chevalier & Fransson, 1994, 2001). At the same time synchrotron radiation is generated by electrons accelerated up to relativistic energies at the shock front.
In the “standard” model of X-ray emission from circumstellar interaction the forward shock produces a hot shell ( K), while the reverse shock produces a denser, cooler ( K) shell with much higher emission measure, from which the observed soft X-ray emission arises (Chevalier & Fransson, 1994). The post-shock material can be a more efficient radiator if the explosion occurs in a dense circumstellar shell with density cm-3 (Terlevich et al., 1992). Alternatively, if the progenitor stellar wind is clumpy, the interaction of the forward shock with clumps of gas can give rise to cooler X-ray emission, with a temperature lower than that expected from interaction with a smooth wind (Chugai, 1993).
Only 20 supernovae have been detected at X-ray energies. Recent detections include SN 1988Z (Aretxaga et al., 1999), SN 1995N (Fox et al., 2000), SN 1998bw (Iwamoto al., 1998), SN 1999em and SN 1999gi (Schlegel et al., 2001). Although soon after the explosion the X-ray emission may arise from Compton down-scattered -ray photons produced in the radioactive decays of 56Ni and 56Co (see e.g. the case of SN 1987A; Itoh al. 1987), in most cases evidence has been gathered in favour of the circumstellar interaction origin of the observed radiation. SN 1988Z and SN 1995N are Type IIn supernovae with a very large inferred X-ray luminosity ( erg s-1). SN 1999em and SN 1999gi are “regular” Type IIP (plateau) supernovae whose X-ray emission is about two orders of magnitude lower than that of Type IIn supernovae. This is usually attributed to the fact that in these supernovae the CSM is less dense and hence the ejecta interaction less strong. On the other hand, the powerful X-ray emission of the “hypernova” SN 1998bw is probably originated by synchrotron radiation produced by non-thermal electrons accelerated at the shock front.
Several Type IIn supernovae show also an extraordinarily large late-time infrared (IR) emission whose origin is still debated. The data are interpreted as thermal emission from dust, but its origin and the mechanism through which it is heated at the observed temperatures ( 1000 K) does not appear to be established (Gerardy et al., 2002). Several possibilities have been discussed, including dust forming in the ejecta, pre-existing dusty circumstellar medium heated by the supernova shock (or a precursor), IR echo powered by emission from shock interaction with the circumstellar medium (Pozzo et al., 2004). For this type of supernovae multi-wavelength observations may provide crucial information about the mass-loss history in the late evolutionary stages of the progenitor star, the distribution of the ejecta and circumstellar wind (CSW), and the energy of the explosion.
Of special interest in this context is the case of SN 1995N, discovered in May 1995 (Pollas et al., 1995). Supernova 1995N is hosted in the irregular galaxy complex known as Arp 261, at a distance of 24 Mpc, whose center is occupied by the (IB(s)m pec) peculiar galaxy MCG-02-38-017. The epoch of explosion is not known but may be estimated to be about 10 months before the optical discovery (Benetti et al., 1995). Fransson et al. (2002) assumed an explosion date of 1994 July 4, about 2 years before the first X-ray observation. Throughout this paper we adopt this assumption for the explosion epoch. SN 1995N has been extensively observed in the optical (Fransson et al., 2002; Pastorello et al., 2005). From an analysis of the emission line profile in the optical and UV spectra at epochs between 321 and 1799 days after the explosion, Fransson et al. (2002) found evidence of three distinct velocity components for the gas, suggesting a clumpy circumstellar medium or an aspherical distribution of the surrounding gas.
X-ray emission has been detected with ROSAT and ASCA at different epochs. The first X-ray observation of SN 1995N was performed with ROSAT HRI on 1996 July 23 (1.3 ks; Lewin et al. 1996), followed by other two exposures taken on 1996 August 12 (17 ks) and on 1997 August 17 (19 ks; see Fox et al. 2000). An ASCA observation was performed on 1998 January 19 ( 90 ks for SIS and GIS; Fox et al. 2000).
The high X-ray luminosity ( erg s-1) places SN 1995N in a small group of Type IIn supernovae with strong circumstellar interaction (along with SN 1978K, SN 1986J, SN 1988Z), making it an ideal target for studying the X-ray spectral evolution and light curve of Type IIn supernovae. The X-ray light curve from 2 to 3.5 years after explosion suggests that the CSM is distributed inhomogeneously and that the average X-ray luminosity does not decline significantly (Fox et al., 2000). In the model of Chevalier & Fransson (1994) a decline in flux is expected if the forward/reverse shock luminosity is dominated by free-free emission, whereas a radiative reverse shock front leads to a roughly constant luminosity when line emission is dominant. Both behaviours have been observed (in SN 1986J and SN 1978K, respectively). Fox et al. (2000) found that the ASCA spectrum of SN 1995N is consistent with a simple bremsstrahlung model with absorption ( keV, cm-2), although also a power-law with photon index and a slightly higher column density provides an acceptable fit. The spectral fitting hints towards the presence of spectral features near 1.8 keV, appropriate for fluorescent silicon emission (Si K-shell lines).
In this paper we present the results of a XMM-Newton observation of SN 1995N, performed in July 2003, along with those obtained from a simultaneous optical/infrared observation carried out at ESO. The paper is organized as follows. In §2 we present our XMM-Newton observation and the adopted X-ray data reduction procedure. §3 is devoted to the X-ray spectral analysis of SN 1995N and two other field sources, while in §4 we present the OM images of the field. §5 reports the X-ray light curve of SN 1995N from all the available X-ray measurements. In §6 we present the results from our coordinated optical/IR observations of SN 1995N. Finally, results are discussed in §7 and conclusions summarized in §8.
| Source number | Source name | RA [J2000] | DEC [J2000] | MOS count ratea | pn count ratea |
|---|---|---|---|---|---|
| (hh:mm:ss.sss) | (0 : ′ : ′′) | ( s-1) | ( s-1) | ||
| 1 | 14:49:08.616 | 10:18:58.75 | – | – | |
| 2 | X-1 | 14:49:15.088 | 10:11:16.26 | 1.150.11 | 3.660.17 |
| 3 | 14:49:16.410 | 10:16:01.28 | – | – | |
| 4 | 14:49:23.522 | 10:14:02.68 | – | – | |
| 5 | X-2/SN 1995N | 14:49:28.359 | 10:10:14.52 | 0.960.07 | 3.30.16 |
| 6 | 14:49:30.762 | 10:10:33.77 | – | – | |
| 7 | X-3 | 14:49:32.720 | 10:09:48.75 | 0.850.10 | – |
| 8 | 14:49:53.662 | 10:06:22.50 | – | – | |
| 9 | 14:49:53.927 | 10:15:16.25 | – | – | |
| 10 | 14:49:56.098 | 09:59:41.23 | – | – | |
| 11 | 14:50:08.673 | 10:11:45.12 | – | – | |
| 12 | 14:50:11.622 | 10:13:23.64 | – | – |
a Background subtracted
| Model | Parameter(s) | (dof) | Fluxa | |
|---|---|---|---|---|
| POWER-LAW | 1.9 | =2.0 | 1.18(58) | |
| MEKALb | 0.1 | =4.6 keV | 1.21(58) | |
| POWER-LAW+MEKALb | 1.4 | =1.5 | 0.78(56) | |
| =0.8 keV | ||||
| MEKALb+MEKALb | 1.3 | =0.8 keV | 0.76(56) | |
| =9.4 keV |
a Unabsorbed 0.2-10 keV flux in units of erg cm-2 s-1.
b Solar abundance (frozen).
2 X-ray observation and data reduction
We observed SN 1995N with XMM-Newton on July 27–28, 2003, 9 years after the estimated date of explosion (Table 1). The observation (ID 0149620201) lasted 72 ks, but was heavily affected by solar flares. The three XMM EPIC cameras (MOS1, MOS2 and pn) operated in Prime Full Window mode with the thin filter. The EPIC MOS observation was split into two exposures of and ks, respectively, while only one uninterrupted EPIC pn exposure of ks was taken. The two RGS instruments show insufficient counts to perform any statistically significant analysis.
Data screening, region selection and event extraction were performed using the XMMSAS (v 5.4) software package. Data were filtered using the good time intervals when the total off-source count rate above 10 keV was counts s-1 for the EPIC MOS and counts s-1 for the EPIC pn, leaving 22 and 14 ks of useful data, respectively. After filtering, the first, shorter EPIC MOS exposure had a very small number of source photons ( 25) and was then discarded. Although the standard criterion for filtering MOS data recommended by the XMM Science Operation Center (XMM-SOC-CAL-TN-0018) is counts s-1, we decided to take a slightly higher threshold ( counts s-1) to have an acceptable statistics in the MOS data. Any residual contamination caused by solar flares should not affect seriously our results because intense solar flares typically have counts s-1 and EPIC MOS data have been analyzed jointly with the pn data (always below the recommended threshold).
| Source | Model | Parameter(s) | (dof) | |
|---|---|---|---|---|
| X-1 | POWER-LAW | 0.8 | =2.1 | 0.89(65) |
| BREMSSTHRALUNG | 0.1 | =3.5 keV | 0.98(65) | |
| X-3 | POWER-LAW | 2.8 | =2.8 | 0.98(36) |
| BREMSSTHRALUNG | 1.1 | =1.9 keV | 1.01(36) |
A filtered XMM EPIC image of the field is shown in Figure 1. A list of sources with peak counts larger than the average counts of the adjacent background is reported in Table 2. The position of SN 1995N (RA=14h49m28s.359, DEC=10′14′′.52 [J2000]) is within 0.6′′ from the accurate radio position by Van Dyk et al. (1996) (RA=14h49m28s.313, DEC=10′13′′.92 [J2000]). Besides SN 1995N, other two sources appear to have comparable brightness, a field object (labeled X-1) positionally coincident with a cataloged star (GSC2 S231011112849) and the nucleus of the galaxy MCG-02-38-017 (labeled X-3).
3 X-ray spectral analysis
3.1 XMM EPIC spectrum of SN 1995N
Source counts were extracted from a circular region of radius 20′′ centered on the source position. Background counts were extracted from a circular region of radius 40′′, on the same CCD. The net source count rate is reported in Table 2. A total of 420 and 460 photons were collected from the EPIC MOS and pn cameras, respectively.
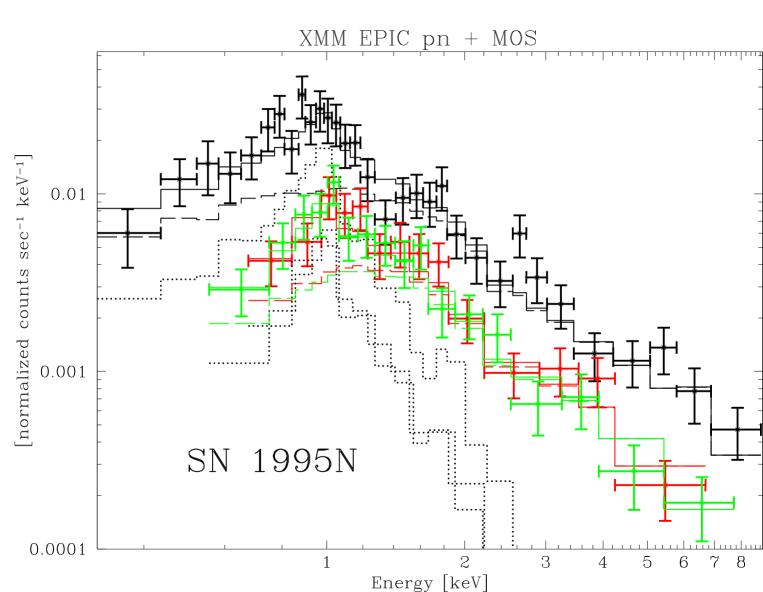
XMM EPIC MOS and pn spectra were binned requiring at least 15 counts per bin. They are shown in Figure 2. Joint MOS and pn spectral fits were performed in the 0.2-10.0 keV interval with XSPEC (v. 11.2.0). An overall normalization constant was included to minimize the effects of possible relative calibration uncertainties among the different instruments (typical fractional difference 5-10%). Despite the low statistics, the fit with single component models is not fully satisfactory (; see Table 3). The best fit is obtained with a dual MEKAL111The MEKAL model is the spectrum emitted by an optically thin, thermal plasma. model, convolved with interstellar absorption (see Figure 2). The best fitting column density of the interstellar medium is cm-2, while the temperatures of the two MEKAL components are and 9.5 keV (see Table 3). The improvement over a single component model is significant at the 4.1 level. We tried also to perform spectral fits by varying the chemical composition of the two MEKAL components with respect to solar. Increasing or decreasing the chemical abundances up to 30% in both components gives spectral fits comparable to those obtained with solar composition.
Taking the best-fitting spectral model (MEKAL+MEKAL), the absorbed/unabsorbed flux in the 0.2-10.0 keV band is / erg cm-2 s-1 (corresponding to a luminosity L = erg s-1, at the distance of the host galaxy Mpc), about an order of magnitude lower than that of the ASCA observation of January 1998.
3.2 XMM EPIC spectrum of sources X-1 and X-3
The spectral analysis for sources X-1 and X-3 was performed as described in the previous section. The count rates are reported in Table 2. Source X-3 falls in a gap in the EPIC pn image and then only the MOS data were used. For X-1, joint MOS and pn spectral fits were performed. In both cases spectral fits were performed in the 0.2-10.0 keV interval with an overall normalization constant. As shown in Table 4, both an absorbed bremssthralung and a power-law can satisfactorily reproduce the observed spectrum, while a single blackbody component is ruled out by the data ( and 1.4, respectively). Assuming a power-law spectrum with the parameters reported in Table 4, the unabsorbed fluxes in the 0.2-10.0 keV band derived from the EPIC MOS cameras are erg cm-2 s-1 and erg cm-2 s-1 for sources X-1 and X-3, respectively. From the parameters of the X-ray spectral fit and the existence of a likely counterpart identified with the GSC2 field star S231011112849, we tentatively conclude that source X-1 may be an X-ray binary in our Galaxy. The space density of such objects at this flux level is not known. As mentioned in § 2, object X-3 is spatially coincident with the nucleus of the galaxy MCG-02-38-017. The best fitting power-law model gives parameters roughly consistent with emission from a low-luminosity AGN.
4 OM imaging
During the XMM-Newton observation of SN 1995N a series of 5000 s exposures of the field in the , , , and bands was also taken with the OM222Note that the XMM OM , , bands do not exactly coincide with the standard Johnson , and band-passes. For a definition of the effective wavelengths of these filters see e.g. Royer et al. (2000) and Mason et al. (2001).. The exposures (3 per band) were astrometrically calibrated using standard IRAF tasks starting from the positions of GSC2 ESO field stars. The intrinsic accuracy of this procedure is 0.5′′. The calibrated images were then summed together. Nothing is visible at the position of SN 1995N in the , , and bands. Using the detection limit count rates of the single images and the conversion factors reported in the XMM-SAS User’s Guide (v. 3.0), we estimate the following upper limits for the flux of SN 1995N: erg cm-2 s-1, erg cm-2 s-1, erg cm-2 s-1, erg cm-2 s-1.
A faint object is indeed detectable inside the X-ray error box of SN 1995N in the summed image shown in Figure 3. The object is at the limit of detectability in each single frame. The position in the summed image is RA=14h49m28s.336, DEC=10′13′′.77, within 0.4′′ from the radio position of SN 1995N. Within the errors of the astrometric calibration, we then identify this object with SN 1995N. The lack of catalogs of reference stars in the band prevent us from performing an accurate photometric calibration in this band. Thus, in order to estimate a lower limit for the flux emitted by SN 1995N, we use the detection limit count rate of a single image. Because SN 1995N is slightly above threshold, we can safely assume erg cm-2 s-1.
5 X-ray light curve of SN 1995N
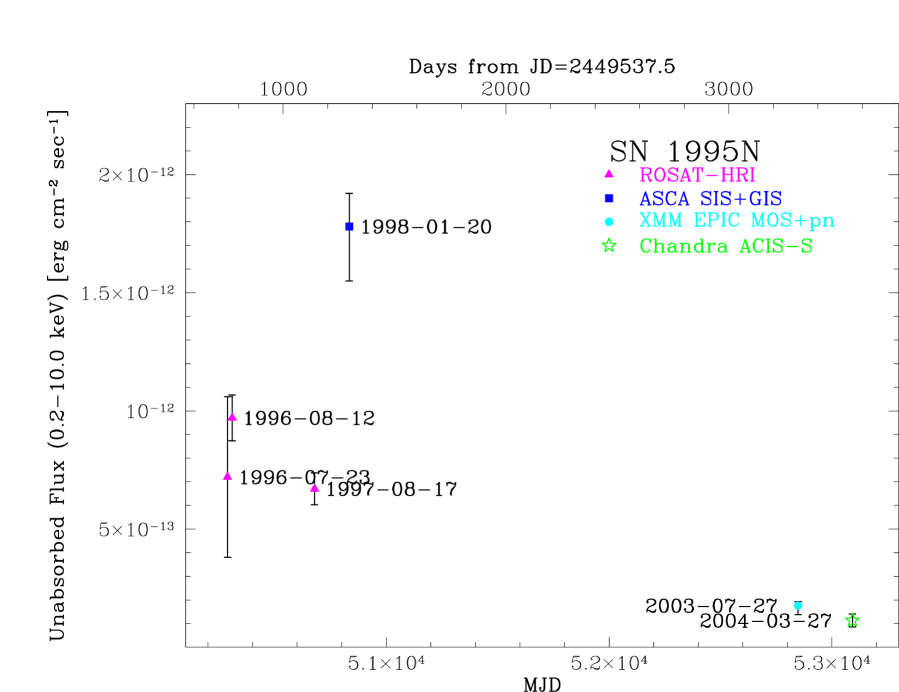
Figure 5 shows the 0.2-10 keV unabsorbed fluxes derived from all the available X-ray observations of SN 1995N. The ROSAT fluxes were derived assuming a dual Raymond-Smith model (similar to the best fitting dual MEKAL model) with the same parameters reported in Table 3. For the ASCA fluxes, the original measurement from Fox et al. (2000), averaged between the SIS and GIS instruments and extrapolated to the 0.2-10 keV interval, is erg cm-2 s-1. It should be noted, however, that in our XMM image two field sources (6 and 7) are sufficiently close to the supernova to be unresolved in the previous ASCA observation. In particular, the flux emitted by one of these sources (7 or X-3) is not negligible in comparison with that of SN 1995N. Assuming that it remained constant and subtracting it from that of the supernova, we find that the actual ASCA flux of SN 1995N should have been erg cm-2 s-1. This is the value reported in Figure 5. For XMM, the fluxes are the average between the different instruments (MOS1, MOS2, pn, respectively). The XMM value refers to the best fitting MEKAL+MEKAL model ( erg cm-2 s-1; see Table 3). Finally, we report also a recent measurement obtained with Chandra (Chandra et al., 2005), extrapolated to the 0.2-10 keV interval.
It is worth noting in Figure 5 the large decrease in the X-ray flux between the ASCA and XMM observations, indicating that the supernova has started its X-ray decline. This conclusion is independent of the different spectral models used to calculate the XMM flux (see Table 3), and is consistent with the recent Chandra measurement.

6 Coordinated optical and Infrared observations of SN 1995N
Coordinated optical and IR observations of SN 1995N were performed with the ESO VLT telescopes (VLT+FORS2, VLT+ISAAC) on July 30, 2003 (Table 1). Two optical spectra of 1460 s each were obtained with UT4 equipped with FORS2, using the grism 200V and the separation order filter GG435. The spectral resolution is about 10 A and the wavelength range is 4200-9600 A. All data were reduced in the IRAF environment, either using IRAF tasks or specific procedures developed by our group. The two spectra were combined together and calibrated in wavelength using comparison spectra of He-Ar and He-Ne lamps. The flux calibration was performed using spectrophotometric standards. The estimated error on the flux is . The VLT spectrum is shown in Figure 6. Photometry in the bands was performed on the VLT images, using a PSF-fitting technique. Photometric errors were estimated placing artifical stars with the same magnitude and profile as the SN, at positions close (few arcsecs) to that of the SN, and then computing the deviations of the measured artificial stars magnitudes. All the photometric measurements are reported in Table 5. The band VLT image is shown in Figure 4.
After years SN 1995N is still well detected in all optical/IR bands. During the 1998-2003 time interval, the decline in the and band magnitudes has been and 2.2 mag, corresponding to a flux decrement of a factor 30 and 8, respectively. This is rather slow if compared to the typical radioactive decay decline of Type II SNe ( mag/100 days for 56Co), confirming that the IR/optical emission is powered by the interaction of the ejecta with the CSM (with radioactive decay of heavy isotopes playing only a minor role). A comparison of the decline rate of SN 1995N in the X-ray and bands shows that, between 1998 and 2003 (epochs of the ASCA and XMM observations), the X-ray flux has decreased by a factor 10, while the band emission has dropped much more (a factor 30). In 2003 the X-ray luminosity exceeds that in the band by approximately one order of magnitude (see Table 6). Thus, in 1998, .
The optical spectrum is dominated by the H balmer lines, [O III] 4959-5007Å, [O I] 6300-6364 Å, [O II] 7320-7330 Å(see Figure 6). In addition, weak emission features of He I are visible. The total flux of H decreases by a factor 60 between the first spectrum of Fransson et al. 2002 (1996 June 22) and our VLT spectrum (2003 July 30). In the same period, the flux of H decreases by a factor 12 (i.e. the Balmer decrement reduces by a factor 5). Similar to H is the evolution of the total flux for the He I and [O III] 4969-5007Ålines. However, over the same period the fluxes of the [O I] and [O II] doublets show very small changes, remaining roughly constant.
The H emission lines in our VLT spectrum of July 30, 2003, show an asymmetric profile, with two different components: a broader component with FWHM = 2670 km s-1 and a narrower one with FWHM = 1270 km s-1. As noted by Fransson et al. (2002), the H profile has a significant evolution with time, showing a deficit of flux in the red wing compared to the blue wing at the same velocity. Moreover, the broader emission component seems to peak at bluer wavelengths. This may be explained by the contribution of dust formed into the ejecta or pre-existing in the CSM (e.g. Pozzo et al. 2004; Gerardy et al. 2002).
| date | MJD | instr. | |||||||
|---|---|---|---|---|---|---|---|---|---|
| 30/07/03 | 52850.0 | 22.62 | 21.84 | 20.79 | 21.00 | – | – | – | 1 |
| 30/07/03 | 52850.1 | – | – | – | – | 20.96 | 19.75 | 18.01 | 2 |
1 VLT+FORS2; 2 VLT+ISAAC
| 0.23 | 0.060 | 0.035 | 0.058f | 0.061f | 0.13f | 0.059f | 0.026f | 0.059f | 0.13f |
a Fluxes are in units of erg cm2 s-1
b [0.2-10] keV band
c Effective wavelength of the filter: 2070 A (Royer et al., 2000)
d Effective wavelength of the filter: 2905 A (Royer et al., 2000)
e Effective wavelength of the filter: 3472 A (Royer et al., 2000)
f Fractional error 1%
7 Discussion
SN 1995N is one of the few supernovae detected in X-rays at an age of 9 years (see e.g. SN 1988Z). Until the last ASCA observation of January 1998, SN 1995N did not appear to show any significant decline in the X-ray flux. In fact, on the basis of the ROSAT and ASCA data alone, there was some evidence that from 2 to 3.5 years after the explosion the X-ray flux may have first dimmed by 30% and then brightened (Fox et al., 2000). Our XMM observation shows that, at an age of 9 years, almost one order of magnitude decrease in the X-ray flux of SN 1995N has occurred (see Figure 5).
Using a recent Chandra observation (March 2004), Chandra et al. (2005) find that, after subtracting the contamination of nearby sources from the ASCA measurement, the light curve in the soft X-ray band (0.1-2.4) appears to be consistent with a linear decline. However, considering also the hard X-ray emission, the evolution of the X-ray light curve appears more complex. According to Chugai (1993) and Fox et al. (2000), the early behavior of the X-ray light curve (up to 3.5 years after the explosion) may originate from a clumpy CSW, where variations of the clump properties (e.g. density) with distance result in fluctuations of the X-ray flux. But such variations may also be consistent with a smooth CSW, where there is some degree of dishomogeneity along the radial direction. In any case, the significant decline at an age years shows that the supernova may have finally entered the X-ray decline phase. Indeed, from all the available X-ray data, an interesting scenario emerges where a two-phase CSM contributes to the X-ray emission. Until 3-4 years, the shock crosses a rather clumpy wind and the X-ray flux is strongly contaminated by clump emission, while later the CMS becomes smoother and emission is dominated by interaction with the diffuse gas.
We find statistically significant evidence for two thermal (MEKAL) components from the best fit of the XMM EPIC spectrum. The temperature of the cooler phase ( keV), is consistent with the temperature of the thermal plasma behind the reverse shock (Chevalier & Fransson, 1994). The temperature of the hotter phase ( keV) is similar to the temperature of the single-component spectral fit of the ASCA data performed by Fox et al. (2000). Thus this component, that dominates the high-energy tail of the spectrum, did not undergo significant spectral evolution, similarly to what observed for the high-temperature component of the X-ray spectrum of SN 1978K (Schlegel et al., 2004). As noted by Fox et al. (2000), the temperature of this hot gas is lower than expected for emission from the forward shock wave. However, if we interpret it as the temperature of the gas heated by the forward-shock, we can derive the exponent of the ejecta density distribution from the expression , where is the exponent of the CMS density distribution (Fransson et al., 1996). Assuming a constant and homogeneous stellar wind (), from the values of the temperatures and inferred from the X-ray spectrum we obtain , rather low but still consistent with the range of values reported by Chevalier & Fransson (1994) (see also the recently reported value for SN 1978K; Schlegel et al. 2004).
From the X-ray luminosity of the reverse shock it is possible to derive an estimate of the mass loss rate of the super-giant progenitor from which the CSW originated. Assuming that the post-shock gas is cooling efficiently through line emission, the total luminosity of the reverse shock is (Chevalier & Fransson, 2001)
| (1) |
where is the mass loss rate in units of , the CSW velocity in units of 10 km s-1, the ejecta velocity close to the shock in units of km s-1, and . From the unabsorbed flux of the low temperature MEKAL component ( erg cm-2 s-1) we derive erg s-1 ( Mpc). Taking we then obtain . As reported in the previous section, the simultaneous VLT spectrum shows that the velocity of the broader, faster component of the H balmer lines is km s-1. Taking this velocity as representative of the bulk ejecta velocity, we find for .
At an age of 9 years, the X-ray luminosity of SN 1995N is still dominated by a high temperature thermal component. If this represents emission from gas behind the forward shock, we can use also the luminosity of this component to derive an estimate of . In fact, assuming electron-ion equipartition, the total free-free luminosity of the forward shock is (Chevalier & Fransson, 2001)
| (2) |
where is the free-free Gaunt factor. Because in the typical physical conditions behind the forward shock electrons and ions are not in thermal equilibrium, equation (2) is meant to provide only a crude estimate of . From the unabsorbed flux of the high temperature MEKAL component ( erg cm-2 s-1) we derive erg s-1 ( Mpc). At days (epoch of the XMM observation), we then have and hence . The two estimates of the mass loss rate prior to the explosion of the progenitor of SN 1995N appear to be roughly consistent. Averaging between them, we find , at the upper end of the interval exhibited by red super-giants.
Albeit the smooth wind/ejecta interaction model appears to be qualitatively consistent with the XMM data, there are however some quantitative difficulties. The value of the column density of the cool shell is (Chevalier & Fransson, 2001)
| (3) |
For and , we obtain cm-2, significantly larger than the value of derived from the X-ray spectral fit of the XMM data. Furthermore, in the model of Chevalier & Fransson (1994) the forward shock is assumed to be adiabatic, while the reverse shock is radiative. The critical time when the cooling time equals the time since explosion for the forward shock is (Chevalier & Fransson 1994, 2001)
| (4) |
For typical parameters, s and hence radiative cooling is not significant for the forward shock (while it may be important for years for the reverse shock). Using again and , the critical time for SN 1995N is year. Radiative cooling may still be significant at the time of the XMM observation. Assuming that the forward shock emission dominates, and the forward shock luminosity at the epoch of the ASCA observation would have been 2.5 times larger, which is not sufficient to account for 0.2-10 keV flux inferred from the ASCA measurement, even taking into account the contamination from nearby sources. This may be further evidence that the emission up to 3.5 years was contaminated by clumps. It should be noted, however, that a certain spectral evolution at high energies between the ASCA and XMM observations would be expected, whereas the observations do not show any evidence of it.
Because of the decrease in the X-ray flux and the strong contamination by solar flares, the statistics of the EPIC spectrum is not sufficient to detect X-ray spectral lines. Therefore, we can not test the suggestion by Fox et al. (2000) about the possible existence of a Silicon spectral feature near 1.8 keV, although some residuals are present in the EPIC pn spectrum at 1.8, 2.6 and 5.4 keV. However decline in the X-ray flux is signaling that the SN has started to evolve towards the remnant stage, in agreement also with the increase in strength of the forbidden O lines observed in the optical spectrum (Pastorello et al., 2005). Future X-ray observations will then be important for detecting X-ray line emission. In this respect, we note that, in a Chandra spectrum taken almost 9 months later, Chandra et al. (2005) report evidence of emission features around 1 keV that they identify as Ne lines.
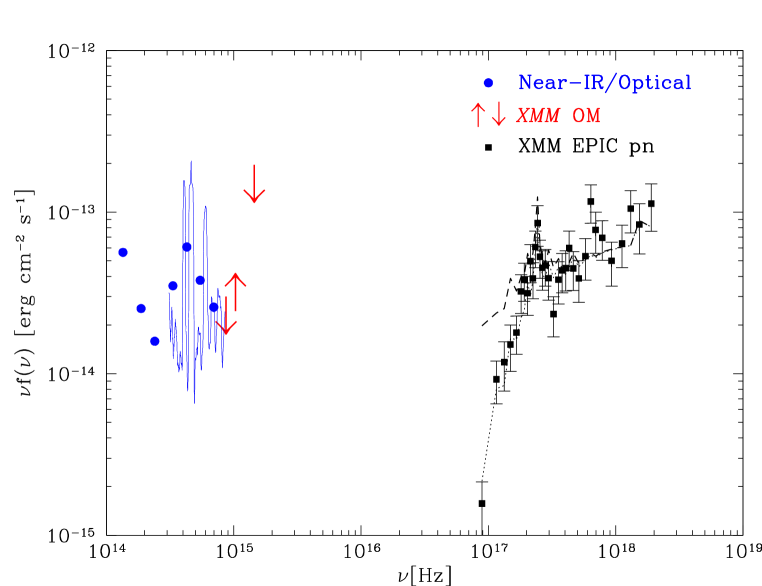
Thanks to our coordinated XMM-ESO VLT observing program we have been able to construct the simultaneous broadband flux distribution of SN 1995N from the IR to the X-ray bands (see Table 6 and Figure 7). Most of the total energy output comes from the direct X-ray thermal emission due to the wind/ejecta interaction, whereas, at 9 years after the explosion, reprocessed optical and near IR emission are less important. The band emission of SN 1995N is believed to be produced by reprocessing of X-ray radiation by dust formed in the ejecta or pre-existing in the CSM (see e.g. Gerardy et al. 2002). Together, the fluxes in the and bands amount to 15% of the X-ray flux. The band flux is approximately 2 times larger than that in the neighbouring optical bands because of the significant contribution of a few prominent lines (H, [OI] 6300-6364, [OII] 7320-7330). In particular, the H line is thought to originate from recombination and collisional excitation of gas in the photo-ionized ejecta and in the cool shell bound by the reverse shock and the contact discontinuity. The H flux measured from the optical spectrum is 5.5 10-15 erg cm2 s-1. This is 20% of the flux of the low temperature component. This result does not appear to be in agreement with the findings of Chevalier & Fransson (1994) that 1 % of the reverse shock luminosity is emitted as H, fairly independent of density and other physical parameters. However, it should be noted that significant reverse shock emission may be present in the far-UV, soft X-ray (below 0.2 keV) spectral region, thus increasing the total X-ray flux.
The detection of SN 1995N in the band of the XMM OM shows that significant UV emission accompanies the X-ray luminosity, in agreement with the reprocessing of the X-ray flux that is expected to occur in these environments. The origin of this emission is usually ascribed to Ly and other lines of highly ionized species, as C III-IV, NIII-V, O III-VI, that are produced in the un-shocked ejecta, photo-ionized by the reverse shock (e.g. Chevalier & Fransson 2001).
At the epoch of our multi-wavelength observation, the IR emission has greatly diminished. The power emitted in the band amounts to 7% of the total X-ray flux. This late time near IR luminosity is consistent with the simple picture of re-processing of a small fraction of the optical and X-ray radiation by a pre-existing dusty circumstellar medium heated by the supernova shock (see e.g. Gerardy et al. 2002). As the shock moves away from the region where the bulk of the dust is located, the emission quenches.
8 Conclusions
We observed SN 1995N with XMM-Newton at 9 years after the estimated date of explosion. We found that the 0.2–10.0 keV flux of SN 1995N dropped at a value of erg cm-2 s-1, about one order of magnitude lower than that of a previous ASCA observation performed more than 6 years ago (January 1998). The decline in the X-ray flux is signaling that SN 1995N has probably started to evolve towards the remnant stage.
Interpreting the evolution of the X-ray light curve is not straightforward. A complex scenario where a two-phase (clumpy and smooth) CSM contributes to the observed X-ray emission is consistent with the available data.
The EPIC spectrum of SN 1995N shows statistically significant evidence for the presence of two distinct thermal (MEKAL) components at temperatures of 0.8 and 9.5 keV, respectively. If they are interpreted as the temperatures of the gas behind the reverse/forward shocks, we derive that the exponent of the ejecta density distribution is .
Assuming that the observed X-ray luminosities of the hard/soft spectral components represent the forward/reverse shock emission, we derive an estimate of the mass loss rate of the progenitor, , at the upper end of the interval exhibited by red super-giants.
The X-ray data were obtained within the framework of a multi-wavelength (IR/optical/UV/X-ray) observational campaign. The simultaneous infrared to X-ray flux distribution of SN 1995N shows that the direct X-ray thermal emission due to the wind/ejecta interaction is times larger than the total reprocessed IR/optical flux. At the epoch of our multi-wavelength observation, the IR emission has greatly diminished.
Acknowledgments
This work has been partially supported by the Italian Ministry for Education, University and Research (MIUR) under grant PRIN-2002-027145. We thank an anonymous referee for valuable comments.
References
- Aretxaga et al. (1999) Aretxaga, I. et al., 1999, MNRAS, 309, 343
- Benetti et al. (1995) Benetti, S. et al., 1995, IAU Circ. 6170
- Chandra et al. (2005) Chandra, P., Ray, A., Schlegel, E.M., Sutaria, F.K. & Pietsch, W. 2005, ApJ, in press
- Chevalier & Fransson (1994) Chevalier, R. & Fransson, C. 1994, ApJ, 420, 268
- Chevalier & Fransson (2001) Chevalier, R., & Fransson, C., 2001, in “Supernovae and Gamma-Ray Bursts”, edited by K. W. Weiler (Springer-Verlag) (astro-ph/0110060)
- Chugai (1993) Chugai, N.N. 1993, ApJ, 414, L101
- Fox et al. (2000) Fox, D.W. et al., 2000, MNRAS, 319, 1154
- Fransson et al. (1996) Fransson, C. et al. 1996, ApJ, 461, 993
- Fransson et al. (2002) Fransson, C. et al. 2002, ApJ, 572, 350
- Gerardy et al. (2002) Gerardy, C.L. et al. 2002, ApJ, 575, 1007
- Itoh al. (1987) Itoh, M. et al., 1987, Nature, 330, 233
- Iwamoto al. (1998) Iwamoto K. et al., 1998, Nature, 395, 672
- Lewin et al. (1996) Lewin, W.H.G. et al.,1996, IAU Circ. 6445
- Mason et al. (2001) Mason, K.O. et al. 2001, A&A, 365, L36
- Pastorello et al. (2005) Pastorello, A. et al. 2005, in preparation
- Pollas et al. (1995) Pollas, C. & Albanese, D. 1995, IAU Circ. 6170
- Pozzo et al. (2004) Pozzo, M. et al. 2004, MNRAS, 352, 457
- Royer et al. (2000) Royer, P. et al. 2000, A&A Suppl. Ser., 145, 351
- Schlegel et al. (2001) Schlegel, E.M., 2001, ApJ, 556, L25
- Schlegel et al. (2004) Schlegel, E.M. et al. 2004, ApJ, 603, 644
- Terlevich et al. (1992) Terlevich, R. et al., 1992, MNRAS, 255, 713
- Van Dyk et al. (1996) van Dyk, S.D. et al., 1996, IAU Circ. 6386