Measurement of throughput variation across a large format volume-phase holographic grating
Naoyuki Tamura, Graham J. Murray, Ray M. Sharples, David J. Robertson, & Jeremy R. Allington-Smith
Centre for Advanced Instrumentation, Department of Physics, University of Durham, South Road, Durham, DH1 3LE, UK
naoyuki.tamura@durham.ac.uk
Abstract
In this paper, we report measurements of diffraction efficiency and angular dispersion for a large format ( 25 cm diameter) Volume-Phase Holographic (VPH) grating optimized for near-infrared wavelengths (0.9 1.8 m). The aim of this experiment is to see whether optical characteristics vary significantly across the grating. We sampled three positions in the grating aperture with a separation of 5 cm between each. A 2 cm diameter beam is used to illuminate the grating. At each position, throughput and diffraction angle were measured at several wavelengths. It is found that whilst the relationship between diffraction angle and wavelength is nearly the same at the three positions, the throughputs vary by up to 10% from position to position. We explore the origin of the throughput variation by comparing the data with predictions from coupled-wave analysis. We find that it can be explained by a combination of small variations over the grating aperture in gelatin depth and/or refractive index modulation amplitude, and amount of energy loss by internal absorption and/or surface reflection.
OCIS codes: (050.7330) Diffraction and gratings, volume holographic gratings; (300.6340) Spectroscopy, infrared
References and links
- [1] S. C. Barden, J. A. Arns, and W. S. Colburn, “Volume-phase holographic gratings and their potential for astronomical applications,” in Optical Astronomical Instrumentation, S. D’Odorico, ed., Proc. SPIE 3355, 866–876 (1998).
- [2] S. C. Barden, J. A. Arns, W. S. Colburn, and J. B. Williams, “Volume-Phase Holographic Gratings and the Efficiency of Three Simple Volume-Phase Holographic Gratings,” Publication of Astronomical Society of Pacific 112, 809–820 (2000).
- [3] P. -A. Blanche, S. L. Habraken, P. C. Lemaire, and C. A. J. Jamar, “Large-scale DCG transmission holographic gratings for astronomy,” in Specialized Optical Developments in Astronomy, E. Atad-Ettedgui and S. D’Odorico, eds., Proc. SPIE 4842, 31–38, (2003).
- [4] M. Kimura, T. Maihara, K. Ohta, F. Iwamuro, S. Eto, M. Iino, D. Mochida, T. Shima, H. Karoji, J. Noumaru, M. Akiyama, J. Brzeski, P. R. Gillingham, A. M. Moore, G. Smith, G. B. Dalton, I. A. J. Tosh, G. J. Murray, D. J. Robertson, and N. Tamura, “Fibre-Multi-Object Spectrograph (FMOS) for Subaru Telescope,” in Instrument Design and Performance for Optical/Infrared Ground-based Telescopes, M. Iye, and A. F. Moorwood, eds., Proc. SPIE 4841, 974–984, (2003).
- [5] H. Kogelnik, “Coupled-wave theory for thick hologram gratings,” Bell System Tech. J. 48, 2909–2947, (1969).
- [6] R. D. Rallison, R. W. Rallison, and L. D. Dickson, “Fabrication and testing of large area VPH gratings,” in Specialized Optical Developments in Astronomy, E. Atad-Ettedgui and S. D’Odorico, eds., Proc. SPIE 4842, 10–21, (2003).
- [7] G. A. Smith, W. Saunders, T. Bridges, V. Churilov, A. Lankshear, J. Dawson, D. Correll, L. Waller, R. Haynes, and G. Frost, “AAOmega: a multipurpose fiber-fed spectrograph for the AAT,” in Ground-based Instrumentation for Astronomy, A. F. Moorwood, and M. Iye, eds., Proc. SPIE 5492, 410–420, (2004).
- [8] N. Tamura, G. J. Murray, P. Luke, C. Blackburn, D. J. Robertson, N. A. Dipper, R. M. Sharples, and J. R. Allington-Smith, “Cryogenic Tests of Volume-Phase Holographic Gratings I. Results at 200 K,” Experimental Astronomy, 15, 1–12, (2003).
1 Introduction
Volume-Phase Holographic (VPH) gratings potentially have many advantages over classical surface-relief gratings ([1]; [2]). They are already in operation in some existing astronomical spectrographs and their use is also planned for a number of forthcoming instruments (e.g., [7]). In applications to spectrographs for extremely large telescopes, one has to consider that the beam diameter in a spectrograph will become very large ( 30 cm or even larger) to obtain a reasonably high resolving power and consequently large optics and dispersing elements will be demanded. In this respect, VPH gratings may have an advantage. Unlike classical surface relief gratings, VPH gratings with such large formats can be rather easily fabricated at a reasonable cost. However, the optical uniformity across the aperture has rarely been investigated, despite the fact that during certain stages of fabrication, there is a significant risk of introducing spatial variation. In particular, the uniformity of diffraction efficiency and angular dispersion, the key to the performance of a spectrograph, should be confirmed by experiments. We note that throughput measurements at the two positions (centre and corner) of a VPH grating with the size of 16 cm 20 cm and the line density of 1520 lines/mm are presented ([6]) but the grating was made before the manufacturer’s fabrication process was improved and it shows a large difference in diffraction efficiency between the centre and corner of the grating.
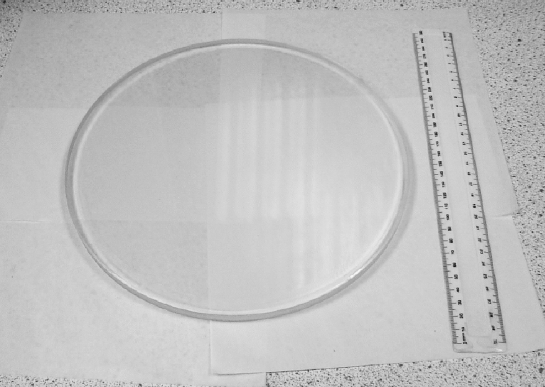
In this paper, results from measurements of throughput and angular dispersion of a large format grating are presented. A picture of the grating is shown in Fig. 1. This grating was manufactured by Ralcon Development Lab for the FMOS project (e.g., [4]) with a diameter of 25 cm. The line density is 385 lines/mm and thus the peak of diffraction efficiency is around 1.3 m at the Bragg condition when the incident angle of an input beam to the normal of the grating surface is 15∘. The measurements are performed at wavelengths between 0.9 m and 1.6 m. In the next section, we will describe the test facility and the measurement procedures. Note that the grating investigated here has the same specification as that used for the cryogenic tests ([8]), but this element has not previously been exposed to vacuum or cryogenic temperature.
2 The test set-up and measurements
| Manufacturer | Product ID | Comments | |
|---|---|---|---|
| Light source | Comar | 12 LU 100 | Tungsten-halogen lamp |
| Monochromator | Oriel Instruments | Cornerstone 130, | 600 lines/mm grating, |
| Model 74000 | Blaze at 1 m | ||
| Visible blocking filter | Comar | 715 GY 50 | Transparent at nm |
| Near-infrared detector | Indigo Systems | AlphaNIR | 320 256 InGaAs array |
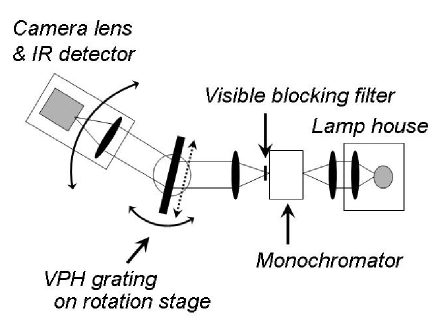
In Fig. 2, the overall configuration of the optical components used for the measurements is indicated (detailed information for the main components is given in Table 1). Light exiting from the monochromator is collimated and used as an input beam to illuminate the VPH grating. The spectral band-width of this input beam is set by adjusting the width of the output slit of the monochromator. The slit width and the corresponding spectral band-width were set to 0.5 mm and 0.01 m, respectively, throughout the measurements; the beam diameter was set to 2 cm by using an iris at the exit of the lamp house.
The input beam is diffracted by the grating, and the camera section consisting of lenses and a near-infrared detector (320 256 InGaAs array) is scanned to capture the diffracted beam. The output slit of the monochromator is thus re-imaged on the detector. Since the detector exhibits some sensitivity at visible wavelengths, a visible blocking filter which is transparent at wavelengths longer than 0.75 m is inserted after the monochromator to reduce contamination of visible light from higher orders.
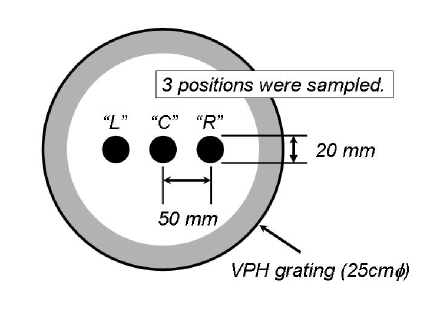
The basic measurement procedures are as follows: First, the brightness of the lamp and the wavelength of light exiting from the monochromator are fixed (the brightness of the lamp is kept constant by a stabilized power supply during the measurement cycle at a given wavelength), and the total intensity included in the image of the slit is measured without the VPH grating. Then, the VPH grating is inserted at an angle to the optical axis, and the intensities of the zero and first order () diffracted light are measured. The diffraction angle is also recorded. Next, the grating is set at a different incident angle and the intensities of the diffracted light and diffraction angles are measured again. After these measurements are repeated for all the incident angles of interest, a different wavelength is chosen and the same sequence is repeated. The brightness of the lamp can be changed when moving from one wavelength to another: a higher brightness is used at shorter wavelengths because the system throughput is lower. After all the incident angles and wavelengths are scanned, the grating position is moved and fixed on the rotation stage so that a different position of the grating aperture is illuminated. We sampled three positions as shown in Fig. 3 (labelled as “L”, “C”, and “R”). Since each position of the grating illuminated is mechanically located at the centre of the rotation stage, any aiming errors of illumination angles to the grating are expected to be equally small at all the measured positions.
3 Results and discussions
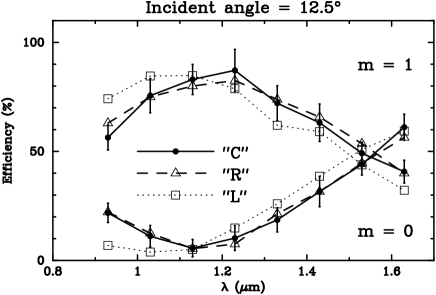
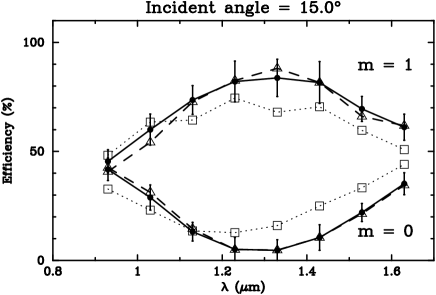
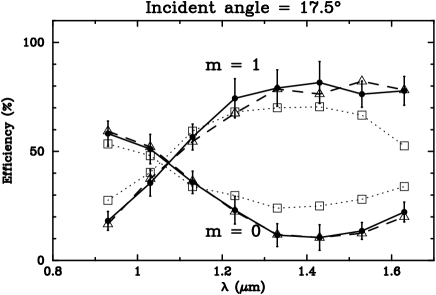
In Fig. 4, 6, and 6, diffraction efficiency measured at the three positions is plotted against wavelength for incident angles of 12.5∘, 15.0∘, and 17.5∘, respectively. Random errors are dominated by fluctuations of the bias level of the detector on short timescales ( sec) and the error bars are calculated from a typical value of these fluctuations (for clarity error bars are shown only for the data at the position “C”). The measurements suggest that, independently of incident angle, the throughputs at the position “L” tend to be at variance with the others; the difference in throughput can be 10 %. The differences are seen in the measurements both of the zero and first order diffractions in a mutually compensating manner; when the throughput of the first order diffraction is lower, that of the zero order is higher, and vice versa. Also, on the whole, the peak of the throughput appears to shift towards shorter wavelengths (this is clearest at an incident angle of 12.5∘). These suggest that the differences originate in the diffraction process, and are not due primarily to some additional absorption or reflection at that position.
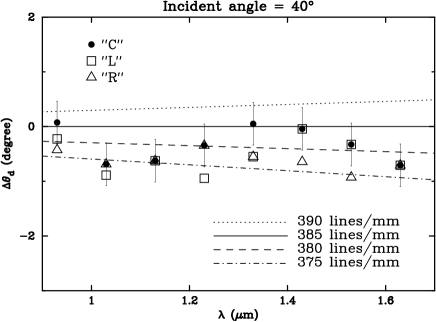
Measurements of diffraction angles are given in Fig. 7. The difference of diffraction angle from that predicted for a line density of 385 lines/mm (the nominal line density of the VPH grating) and for an incident angle of 40∘ is plotted against wavelength. The predicted relationship for line density of 375, 380, and 390 lines/mm is also shown for comparison. The data points show the actual measurements at the three positions. The error is typically 0.4∘, which is estimated from a comparison of the diffraction angles measured at the position “C” with those measured mechanically afterwards for the same incident angle (see [8]). Again, for clarity, the error bars are shown only for the data points at the position “C”. A large incident angle was chosen for this test because the greater the incident angle is, the more sensitive are the results to changes in line density. While the data points show some scatter around the predicted relationships, this plot indicates that the diffraction angles measured at one position exhibit no clear discrepancy from the others and that the spectral dispersion is nearly independent of position. The scatter of the data points in Fig. 7 is probably due to measurement errors and thus the line density is likely to be rather uniform across the grating. Line density is normally well controlled in the manufacturing process, with a typical accuracy of 1 line/mm over a grating aperture. Nevertheless, it is worth treating the range between 375 lines/mm and 385 lines/mm, where the data points are scattered, as an upper limit for the variation of the line density in the following analysis.
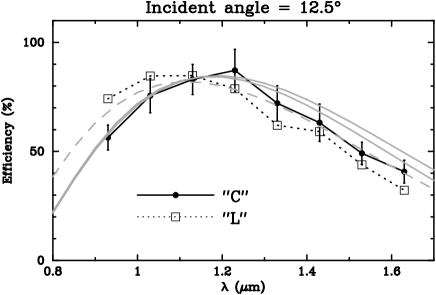
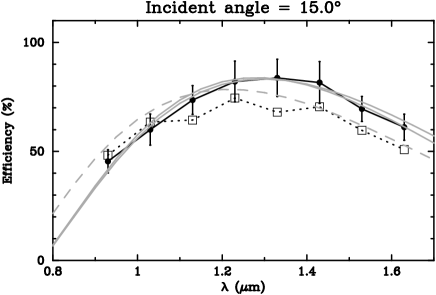
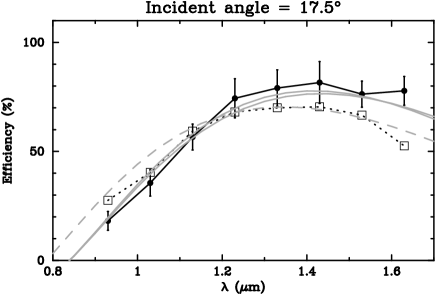
Now we try to identify which parameters vary across the grating, by comparing the measured diffraction efficiency with the predictions from coupled-wave analysis ([5]). In Fig. 8, 10, and 10, the throughput curves measured at the positions “C” and “L” for incident angles of 12.5∘, 15.0∘, and 17.5∘ are plotted, respectively, in the same way as for Fig. 4, 6, and 6. Note that the throughput curve measured at the position “R” is consistent with that at the position “C” and is therefore not shown here for clarity. Overplotted are three model predictions which are described by grey smooth (solid and dashed) curves. Two grey solid lines show the predictions for different line densities; 375 and 385 lines/mm. In calculating these theoretical predictions, a refractive index modulation amplitude of 0.05 and a dichromated gelatin depth of 12 m are assumed. Also, 15% energy loss (presumed to be caused by a combination of internal absorption and surface reflection) is assumed at all the wavelengths, to better fit the predictions to the measurements. It should be emphasized that these assumptions are used in calculating all the grey solid curves plotted in Fig. 8, 10, and 10. The energy lost by internal absorption in the dichromated gelatin layer is estimated to be 1% below 1.8 m (e.g., [1]) and those by combined surface reflections at boundaries between glass and air are 10%. Our data may therefore indicate a larger internal absorption. There may also be some energy loss due to surface reflections at boundaries between gelatin and glass, although this is expected to be very small because the refractive indices are similar.
The fact that the predictions for line densities of 375 and 385 lines/mm lie close together indicates that even if the line density varies across the grating at this level (as suggested by Fig. 7), the discrepancy of the throughput curve at the position “L” cannot be fully explained. On the other hand, the grey dashed line, fitting better to the measurements at the position “L”, shows the model prediction where a dichromated gelatin depth of 11 m is assumed, instead of 12 m. Furthermore, 3% additional energy loss (hence 18% in total) is assumed. The refractive index modulation amplitude is the same as before (0.05) and the line density is 385 lines/mm. Nearly identical model predictions to those described with the grey lines in Fig. 8, 10 and 10 can be obtained by adopting a refractive index modulation amplitude of 0.045 instead of changing the gelatin thickness. A combination of small variations in the gelatin thickness and/or refractive index modulation amplitude, and the energy loss due to internal absorption and/or surface reflection are therefore equally likely candidates for the throughput variation, at least for this grating. Variations of the gelatin thickness across a VPH grating by 1 m have been suggested by direct measurements on a 14 cm 15 cm grating with a line density of 850 lines/mm ([3]). However, since refractive index modulation amplitude is proportional to exposure, an uneven exposure within the grating aperture is also a possible cause of the spatial variation.
4 Summary & Conclusion
In this paper, we report measurements of diffraction efficiency and angular dispersion of a large format ( 25 cm diameter) VPH grating optimized for near-infrared wavelengths (0.9 1.8 m). The aim of this experiment is to see whether optical characteristics vary significantly across the grating. We investigated three positions in the grating aperture with a separation of 5 cm between each, using a 2 cm diameter beam to illuminate the grating. At each position, throughput and diffraction angles were measured at several wavelengths. Our data indicate that whilst the line density is nearly constant at the three positions ( 3% variation), the throughput at one position can be different by 10% due mainly to a small shift of the throughput peak towards shorter wavelengths. Comparing the data with predictions from coupled-wave analysis, we find that this throughput variation can be explained by a combination of small variations in gelatin depth and/or refractive index modulation amplitude and amount of energy lost by internal absorption and/or surface reflection. If a grating is used at a pupil plane of the spectrograph, such variations will be averaged out for all points in the field of view. However, if it is used in a non-pupil plane, careful specification of tolerances would be required to obtain a system with good astronomical performance.
In the near future, we intend to perform similar experiments to those reported here for several VPH gratings to see variations across a selection of gratings with increasing sampling points in the grating aperture. We will also conduct these experiments after exposing the gratings to vacuum and cryogenic temperatures. These results will be reported in a forthcoming paper.
Acknowledgements
We thank colleagues in Durham for their assistance with this work, particularly Peter Luke, John Bate, and the members of the mechanical workshop. We also thank the anonymous reviewer for his/her comments which were very useful to improving this paper. This work was funded by PPARC Rolling Grant PPA/G/O/2000/00485.