Supermassive Black Hole Mass Functions at Intermediate Redshifts from Spheroid and AGN Luminosity Functions
Abstract
Redshift evolution of supermassive black hole mass functions (BHMFs) is investigated up to . BHMFs at intermediate redshifts are calculated in two ways. One way is from early-type galaxy luminosity functions (LFs); we assume an correlation at a redshift by considering a passive evolution of in the local relationship. The resultant BHMFs (spheroid-BHMFs) from LFs of red sequence galaxies indicates a slight decrease of number density with increasing redshift at . Since a redshift evolution in slope and zeropoint of the relation is unlikely to be capable of making such an evolution in BHMF, the evolution of the spheroid-BHMFs is perhaps due mainly to the decreasing normalization in the galaxy LFs. We also derive BHMFs from LFs of morphologically selected early-type galaxies. The resultant BHMFs are similar to those from the red sequence galaxies, but show a small discrepancy at corresponding to an increase of SMBH number density by 0.3 dex. We also investigate how spheroid-BHMFs are affected by uncertainties existing in the derivation in detail.
The other way of deriving a BHMF is based on the continuity equation for number density of SMBHs and LFs of active galactic nucleus (AGN). The resultant BHMFs (AGN-BHMFs) show no clear evolution out to at , but exhibit a significant decrease with redshift in the lower mass range. Interestingly, these AGN-BHMFs are quite different in the range of from those derived by Merloni (2004), where the fundamental plane of black hole activity is exploited.
Comparison of the spheroid-BHMFs with the AGN-BHMFs suggests that at , the spheroid-BHMFs are broadly consistent with the AGN-BHMFs out to . Although the decrease of SMBH number density with redshift suggested by the spheroid-BHMFs is slightly faster than that suggested by the AGN-BHMFs, we presume this to be due at least partly to a selection effect on the LFs of red sequence galaxies; the colour selection could miss spheroids with blue colours. The agreement between the spheroid-BHMFs and the AGN-BHMFs appears to support that most of the SMBHs are already hosted by massive spheroids at and they evolve without significant mass growth since then.
keywords:
black hole physics - galaxies: elliptical and lenticular, cD — galaxies: evolution.1 INTRODUCTION
Recent observations provide evidence that a mass of a supermassive black hole (SMBH) in a galactic nucleus is tightly correlated with a mass or luminosity of a spheroid component of its host galaxy (e.g., Magorrian et al. 1998; Marconi & Hunt 2003, MH03 hereafter). The tight correlation suggests the presence of strong evolutionary link between SMBH and spheroid component. Using the relation, an SMBH mass function (BHMF) can be derived from local galaxy luminosity function (LF) or velocity dispersion function. Meanwhile, a local BHMF can also be calculated from cosmological evolution of LFs of active galactic nuclei (AGNs) by integrating the continuity equation for number density of SMBHs, where mass accretion onto a SMBH is assumed to power an AGN and grow the central SMBH (e.g., Cavaliere, Morrison & Wood 1971; Small & Blandford 1992; Marconi et al. 2004; Shankar et al. 2004). BHMFs derived by this method can now be more reliable than before thanks to updated LFs of hard X-ray selected AGNs (Ueda et al. 2003), which is more complete to obscured AGNs. Marconi et al. (2004) and Shankar et al. (2004) demonstrate that the local densities of SMBHs and BHMFs derived with these two ways agree with each other, if one adopts reasonable values for accretion efficiency and Eddington ratio. Furthermore, Marconi et al. (2004) indicate that the cosmic history of mass accretion rate density delineates that of star-formation rate density, and the ratio of the latter to the former is about 4000, which agrees with the mass ratio of a spheroid to a central SMBH, again strongly suggesting the co-evolution of SMBHs and spheroids.
In studying the co-evolution of SMBHs and host spheroids in further detail, one approach is to investigate redshift evolution of BHMF and correlation between black hole mass () and spheroid luminosity () or mass. While has been measured for a substantial number of high redshift QSOs (e.g., Shields et al. 2003; McLure & Dunlop 2004), it is technically challenging to directly measure dormant SMBHs at cosmological distances. However, BHMFs at high redshifts can be computed using AGN LFs and the continuity equation in the same way as in the local universe. Also, we are now in a reasonable position to be able to study BHMFs at intermediate redshifts by using LFs of early-type galaxies. Early-type galaxy LFs have recently been derived out to with good statistics from intensive imaging surveys such as COMBO-17 (Wolf et al. 2003; Bell et al. 2004b). Consequently, one can compare BHMFs from the galaxy LFs with those from AGN LFs, which may provide clues to understand the co-evolution of AGNs and host spheroids.
In this paper, we will derive BHMFs at intermediate redshifts from galaxy LFs and AGN LFs and investigate the redshift evolutions. When converting galaxy LFs to BHMFs, a correlation between and is utilized. Although a correlation between and bulge effective stellar velocity dispersion () is claimed to be tighter than that between and (Ferrarese & Merritt 2000; Gebhardt et al. 2000), measuring at cosmological distance is very hard and we thus adopt the relation in this work. It should also be emphasized that MH03 show the relation is as tight as that between and if only SMBHs whose masses are securely determined are used in the analysis. In addition, MH03 suggest that the intrinsic scatter of the relation in -band is as small as in NIR bands. One should be aware that the derivation of a BHMF from galaxy LFs contains several processes which may give significant uncertainties to resultant BHMFs. Quantifying uncertainties in BHMFs when calculated from galaxy LFs is also aimed at in this paper.
The layout of this paper is as follows. In the next section (§ 2), we describe the procedure to derive a BHMF from an early-type galaxy LF and calculate BHMFs from early-type galaxy LFs up to . We also investigate how BHMFs are affected by uncertainties and unconstrained parameters existing in this derivation. In § 3, we derive BHMFs from AGN LFs and examine its redshift evolution. In § 4, we compare the BHMFs from early-type galaxy LFs with those from AGN LFs and discuss the results. Throughout this paper, we adopt the cosmological model with km s-1 Mpc-1, and unless otherwise stated.
2 BHMF FROM EARLY-TYPE GALAXY LF
2.1 Derivation of BHMF
In this paper, we mainly use the LFs obtained by Bell et al. (2004b) from the COMBO-17 survey. The large survey area with the moderate depth brings a large number of galaxies, and the multi-band photometry covering from 3640 Å to 9140 Å with the 17 broad- and medium-band filters allows one to accurately determine the photometric redshifts. Both of these aspects are important to derive luminosity functions with good accuracy and the large survey area is especially useful to estimate its cosmic variance. They firstly investigated the rest-frame vs. colour-magnitude diagram of galaxies at a certain redshift and found the red sequence consistent with the colour-magnitude relation well established for the early-type galaxy population. They select galaxies on the red sequence and derive their rest-frame -band LFs at redshifts from 0.25 to 1.05. Bell et al. (2004b) also derived the -band LF of the local red sequence galaxies using the SDSS EDR data (Stoughton et al. 2002) by transforming the SDSS system to the standard system. We use the Schechter functions fitted to these LFs in the following analyses. A part of the survey area of the COMBO-17 was imaged with the HST/ACS and most of the galaxies on the red sequence ( %) indeed show early-type morphology (Bell et al. 2004a). It should be noted that the colour selection based on the red sequence is presumed to exclude blue ellipticals with star formation activity and/or young stellar population. In addition, small bulges in late-type galaxies can be missed, which perhaps results in a deficiency of the light part of a BHMF.
In order to convert these LFs to BHMFs, firstly the total galaxy luminosities need to be transformed to the spheroid luminosities using bulge-to-total luminosity ratios (). s of early-type galaxies at intermediate redshifts are, however, not well constrained observationally. Im et al. (2002) selected morphologically early-type galaxies at intermediate redshifts (most of the galaxies are at ) from the HST/WFPC2 data for DEEP Groth-Strip Survey (DGSS) based on s (), which are estimated by fitting radial surface brightness profiles with spheroid and exponential disk. According to their catalog, the morphologically selected early-type galaxies have a of 0.7 on average, although there is a substantial scatter. The s do not depend on redshift or luminosity in their sample. Therefore we adopt in this study, independently of redshift and galaxy luminosity.
Once LFs of spheroidal components are calculated from the early-type galaxy LFs, they can be transformed to BHMFs using an relation. In this study, we use those derived by MH03 for their galaxies in Group 1, for which measurements of and are considered to be reliable. The relation is derived for in the , , , and bands. Although the relation in -band is generally preferred because -band luminosity is considered to be the most reliable indicator of the stellar mass of a galaxy, MH03 show the intrinsic scatter of the relation is almost independent of the bands for the galaxies in Group 1. Since we will mainly use the -band LFs by Bell et al. (2004b), we adopt the -band relation described as follows:
| (1) |
In applying the relation to an LF, the intrinsic scatter of the relation needs to be considered; we adopt according to MH03.
In calculating a BHMF from a spheroid LF at a high redshift, an evolution of the relation needs to be considered. In this study, we basically consider only the effect of passive evolution in . It should be noted that if all spheroid components evolve only passively (with no growth of SMBHs), then the BHMF at the intermediate redshift does not change from that at . In fact, it is not obvious that all spheroids evolve passively at intermediate redshifts. Any other evolutions in galaxy LFs and the relation would cause the disagreement between BHMFs from galaxy LF and AGN LF, which will be discussed in § 4. We describe the passive luminosity evolution as and assume to be 1.4. This is evaluated using PEGASE Ver 2.0 (Fioc & Rocca-Volmerange 1997) for a stellar population with the solar metallicity formed at (the age at is 12 Gyr) in a single starburst with an -folding time of 1 Gyr. This value is consistent with the evolution of characteristic luminosity in the COMBO-17 LFs ().
2.2 BHMFs from early-type galaxy LFs up to
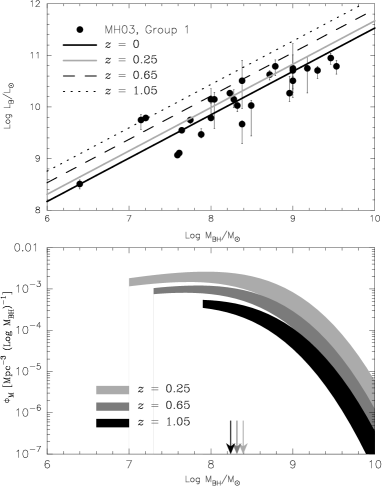
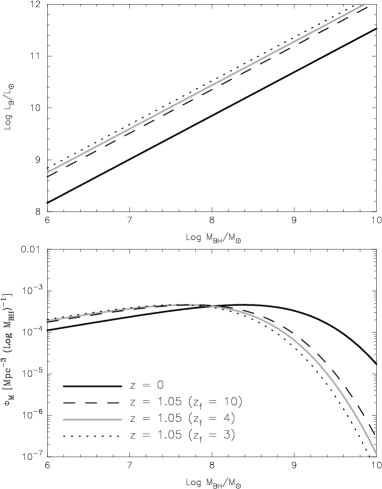
Figure 1 shows the BHMFs calculated using the COMBO-17 LFs with the prescription described above. In the upper panel, the -band of the galaxies in Group 1 by MH03 is plotted against . Black solid line indicates the best-fitting regression line to the data (i.e., the relation at ). Grey solid, black dashed, and black dot-dashed line is the relation expected at and 1.05, respectively, when the passive luminosity evolution is considered. In the lower panel, BHMFs transformed from the COMBO-17 LFs in the rest-frame band at these redshifts are indicated with shaded regions. The envelope of each BHMF shows the errors of and in the Schechter function fit to the data (Bell et al. 2004b); the upper and lower bound is defined by a BHMF with the largest and smallest and within the fitting error, respectively. The uncertainty in is dominated by cosmic variance (Bell et al. 2004b) and we adopt the larger value of the two different estimates by Bell et al. (2004b). Each BHMF is indicated down to the black hole mass corresponding to the lowest luminosity among the data points in the LF. The characteristic corresponding to at each redshift is indicated by arrow with the same colour as the BHMF.
The BHMFs in Figure 1 exhibit a redshift evolution. Since the characteristic does not largely change with redshift, this evolution is perhaps due to a density evolution of BHMFs corresponding to the decreasing normalization of the red sequence galaxy LFs (Bell et al. 2004b). We will discuss other possibilities in § 4.2.
Currently, the COMBO-17 survey provides one of the largest and most useful databases to study galaxies out to and the derived early-type galaxy LFs are therefore considered to be the most reliable so far. Nevertheless it is worth investigating the evolution of BHMF using LFs determined with other data sets, in particular to see whether the result is sensitive to selection criterion for early-type galaxy. Since early-type galaxies are selected from the colour-magnitude diagram in COMBO-17, we investigate the BHMFs derived from LFs of morphologically selected early-type galaxies by Im et al. (2002; the HST/WFPC2 data for DGSS are used) and by Cross et al. (2004; the data were taken with the HST/ACS in the guaranteed time observations). In these studies, early-type galaxies are selected based on the analyses of radial surface brightness profiles. In Im et al. (2002), the rest-frame -band LFs are derived in the two redshift bins: and , while in Cross et al. (2004), they are obtained at and .
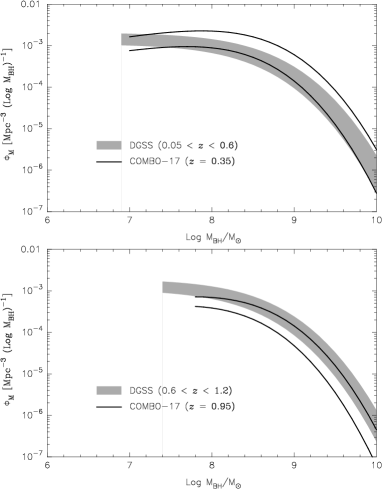
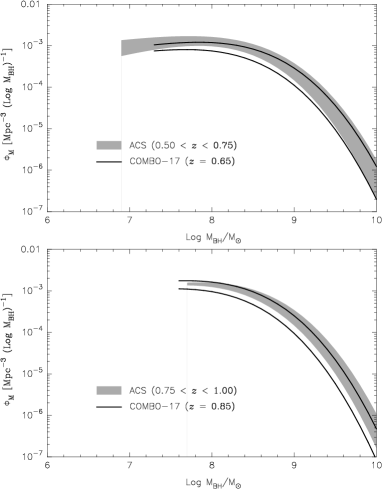
In Figures 2 and 3, the BHMFs converted from the LFs of morphologically selected early-type galaxies by Im et al. (2002) and Cross et al. (2004), respectively, are presented by shaded regions, showing the uncertainties due to the fitting errors of and in the LFs. Again these BHMFs are calculated by assuming and using the -band relation by MH03 corrected for passive luminosity evolutions. The low mass cutoff of the BHMF corresponds to the lowest luminosity among the data points in the original LF. The BHMF from the COMBO-17 LF at a similar redshift is also indicated with solid lines, showing the upper and lower bounds defined by considering the errors of and in the LF. These comparisons demonstrate that the BHMFs from the morphologically selected early-type galaxy LFs are consistent with those from the COMBO-17 survey. It should be mentioned that the BHMFs obtained from COMBO-17 LFs tend to lie below those from the morphologically selected early-type galaxy LFs at the higher redshifts; the discrepancy in number density of SMBHs at a given is estimated to be 0.3 dex. This may indicate that the contribution of blue spheroids which are not included in the COMBO-17 LFs becomes larger towards .
2.3 Source of uncertainty in the derivation of a BHMF
In the previous subsections, we showed the procedure to convert galaxy LFs to BHMFs at intermediate redshifts and presented the resultant BHMFs up to . However, there are several sources of uncertainty in the derivation. Some of them are related to the relation such as fitting error of the relation to the data points, uncertainty of its intrinsic scatter, and choice of relations. Others are due to the fact that value and passive luminosity evolution are not well constrained. In what follows, we will investigate how BHMFs are affected by these uncertainties. Unless otherwise noted, we will begin all the calculations to derive BHMFs with the LF of red sequence galaxies at (Bell et al. 2004b, the SDSS EDR data are used). We call this input LF “iLF” hereafter.
2.3.1 Fitting error and uncertainty of intrinsic scatter in relation
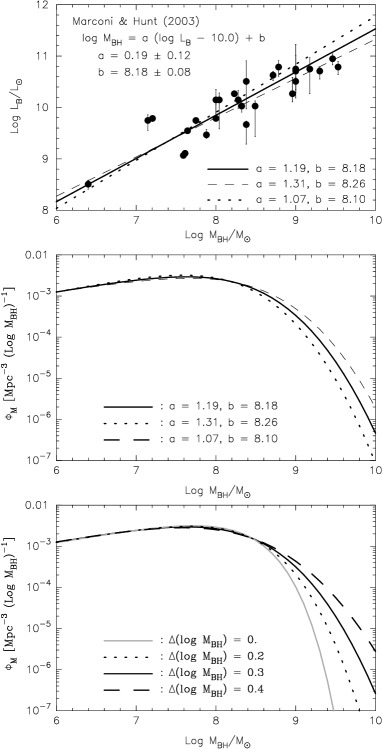
In Figure 4, the fitting error in the -band relation estimated by MH03 is demonstrated in the top panel. Three relations are shown here: One is the best-fitting regression line (solid line), and the other two are those which result in the most massive or least massive BHMFs within the fitting error. The BHMF using either of the three relations is indicated in the middle panel. In calculating the BHMFs, the intrinsic scatter (MH03) is taken into account. This shows that the part of a BHMF at is affected by this uncertainty.
We also calculate BHMFs for several values of intrinsic scatter of the relation and show the results in the bottom panel; 0 (grey solid line), 0.2 (dotted line), 0.3 (black solid line), and 0.4 (dashed line). This affects again the massive end of a BHMF (). It is suggested by MH03 to be between 0.3 and 0.4 (see also McLure & Dunlop 2002), but we note that if observational errors in are underestimated, the intrinsic scatter would be smaller.
2.3.2 relations in band and band
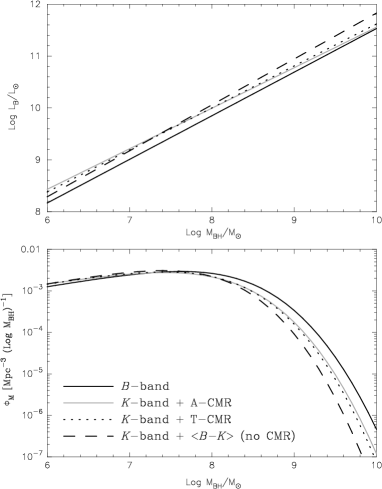
We will compare BHMFs derived from iLF using the relations calculated by MH03 either in the band or band. In order to apply the -band relation to iLF ( band), we need to convert the -band relation to a -band relation by correcting it for colour. This can be performed by using the average colour of early-type galaxy population (e.g., Marconi et al. 2004; McLure & Dunlop 2004; Shankar et al. 2004). We adopt estimated by Girardi et al. (2003) for local elliptical and S0 galaxies in field and group environments. This colour is similar to that used in Marconi et al. (2004), where = 4.1 for ellipticals and 3.95 for S0s ( is Zwicky magnitude) are used in applying the -band relation to the LFs from the CfA survey (Marzke et al. 1994). These colours are based on actual measurements by Kochanek et al. (2001) and they are converted to = 3.59 and 3.44, respectively, by using the equation given by Aller & Richstone (2002).
However, this correction ignores the colour-magnitude relation (CMR). In fact, Bell et al. (2004b) suggest that the red sequence galaxies in the COMBO-17 survey are on the CMR which is consistent with those found for E/S0s both in clusters (Bower, Lucey, & Ellis 1992; Terlevich, Caldwell & Bower 2001) and fields (Schweizer & Seitzer 1992). Therefore, we attempt to take this into account. Since CMRs in have rarely been investigated, we model a CMR using a population synthesis code (Kodama & Arimoto 1997) so as to reproduce an observed CMR in a certain set of filters and we then derive a CMR in and using the model. In this modelling calculation, we follow the recipe by Kodama et al. (1998), where they modeled the CMR ( and ) measured in the Coma cluster (Bower et al. 1992) based on the galactic wind scenario.
It needs to be mentioned that, while a CMR is normally defined using colours within a metric aperture, the one using total colours suits better for this study. Total colours in more luminous (larger) galaxies are presumed to be systematically bluer than those measured within an aperture due to more severe effects of the colour gradients (e.g., Peletier et al. 1990; Tamura & Ohta 2003); a given aperture can sample only the reddest part of a luminous (large) galaxy, but it can include the total light of a faint (small) galaxy. The slope of a CMR using total colours (T-CMR hereafter) is therefore expected to be flatter than that using colours within an aperture (A-CMR hereafter). This aperture effect on the CMR in the Coma cluster (Bower et al. 1992) has been investigated by Kodama et al. (1998) and the slope of the T-CMR at mag is estimated to be 30% flatter. Hence we consider a CMR with a slope flatter by 30% than the A-CMR by Bower et al. (1992) as a T-CMR.111In Kodama et al. (1998), km s-1 Mpc-1 is assumed and hence the slope of a T-CMR would be less flat in our cosmology ( km s-1 Mpc-1). But here we aim at seeing how BHMFs vary by considering the CMRs and precise determination of the slope is beyond our scope. We note that colours of ellipticals less luminous than mag are considered to be robust to the aperture correction and the actual T-CMR therefore has a break at mag (see Figure 3 in Kodama et al. 1998). We ignore this and determine the zeropoint of the T-CMR so as to reproduce the total colours of the ellipticals with mag. Although this indicates that the T-CMR gives too red colours to less luminous ellipticals, the impact of this on a BHMF is very small and does not affect the following discussions.
In Figure 5, the -band relations are shown in the upper panel. Black solid line is the -band relation by MH03 and the other lines indicate those obtained by correcting the -band relation for the average colour, A-CMR, and T-CMR. In the lower panel, BHMFs calculated from iLF using these -band relations are indicated with the same line styles as above. It is indicated that the -band relation is not fully transformed to the -band relation by MH03 even if a CMR is taken into account, and the BHMFs come towards the less massive end than the case where the -band relation by MH03 is applied to iLF. This may imply that, while the tightness of the -band relation is nearly the same as that of the -band relation, the relations are not equivalent to each other. One possible reason for this discrepancy may be that band luminosity is less good indicator of stellar mass due to effects of dust extinction and/or young stellar population for some of the galaxies used in the analysis of the relations. It should be noted that the BHMF comes towards the less massive end when the average colour is used than when a CMR is considered because the adopted average colour is bluer than colours of luminous early-type galaxies. Consequently, their -band luminosities are overestimated and therefore smaller values of are assigned to spheroids with a certain -band luminosity. For the same reason, the BHMF also depends on choice of A-CMR or T-CMR, but the difference turns out to be very small.
2.3.3 Choice of relations from different authors
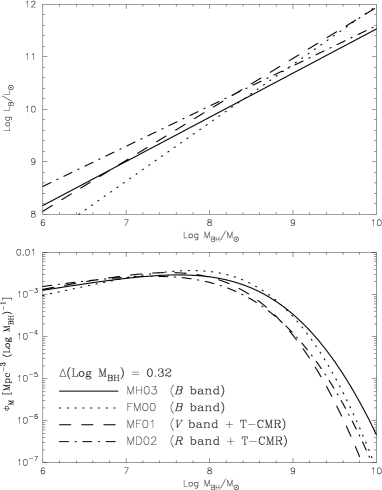
Next we will compare BHMFs derived using the relations by different authors: Ferrarese & Merritt (2000, FM00), Merritt & Ferrarese (2001, MF01), McLure & Dunlop (2002, MD02)222Strictly speaking, since about half of the sample consists of QSOs at in MD02, the relation is not allowed to be used here because some evolutionary effects may already be incorporated. In practice, however, the relation derived using only the local inactive galaxies in MD02 is the same as that from the whole sample., and MH03. For FM00, we adopt the relation for their Sample A. In MF01 and MD02, the relation is obtained in the band and band, respectively, and they are converted to -band relations using T-CMRs modeled in the same way as explained earlier. Also, the zeropoints of the relations by MF01 and MD02 are shifted by the amounts due to the differences in from the value we adopt. These -band relations are shown in the upper panel of Figure 6 with the -band relation by MH03. They are applied to iLF and the BHMFs obtained are shown in the lower panel. The intrinsic scatter of 0.32 around the relation is assumed in all the calculations. These BHMFs suggest that relation depends on sample data set and consequently there is a substantial variation among the BHMFs.
2.3.4 Bulge-to-total luminosity ratio
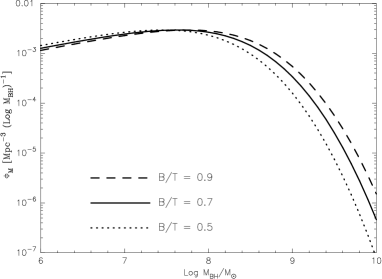
at intermediate redshift is only loosely constrained from observations at the moment and we have to await for future works to see the validity of the current assumption ( for all the red sequence galaxies). It is therefore worth demonstrating BHMFs for a range of to keep it in mind as uncertainty. In Figure 7, BHMFs for 0.5, 0.7, and 0.9 are compared. These BHMFs are obtained from iLF and the -band relation by MH03. This indicates that a BHMF is affected by choice of s at .
2.3.5 Model of passive luminosity evolution
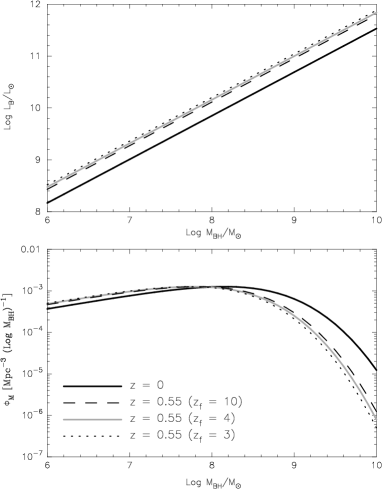
We consider a passive luminosity evolution of an old stellar population which formed at with a starburst of which e-folding time is 1 Gyr. In this case, the luminosity evolution in the band is described as and . The value can be estimated using other models of stellar populations and its dependency on choice of parameters may need to be treated as uncertainty of BHMF at high redshift. Since formation redshift () of a stellar population is probably the most important parameter upon which the value largely depends, we consider two other cases: and 3. The value is estimated to be 1.2 and 1.6, respectively. Using these values including 1.4 for , we derive passively evolved -band relations at and apply these relations to the COMBO-17 LF at this redshift (not iLF). The results are displayed in Figure 8. We also calculate BHMFs at using the LF and the passively evolved relation at this redshift and show the results in Figure 9.
2.3.6 Summary of the uncertainties
| (1) | (2) | (3) | (4) | (5) | (6) | (7) | |
|---|---|---|---|---|---|---|---|
| 7.5 | 0.08 | 0.02 | 0.02 | 0.11 | 0.02 | 0.02 | 0.16 |
| 8.0 | 0.04 | 0.02 | 0.07 | 0.26 | 0.09 | 0.04 | 0.20 |
| 8.5 | 0.10 | 0.01 | 0.27 | 0.37 | 0.27 | 0.15 | 0.28 |
| 9.0 | 0.37 | 0.14 | 0.57 | 0.50 | 0.53 | 0.32 | 0.41 |
| 9.5 | 0.80 | 0.45 | 0.99 | 0.96 | 0.88 | 0.54 | 0.58 |
Table 1 shows a summary of uncertainties in a BHMF investigated earlier. In each column, the possible range of logarithmic SMBH number density () caused by each source of uncertainty is indicated at the five BH masses: 7.5, 8.0, 8.5, 9.0 and 9.5. The error sources investigated are arranged in the columns (1) (6) as follows: (1) the fitting error of the -band relation (see the middle panel of Figure 4), (2) the uncertainty of intrinsic scatter () in the relation (the lower panel of Figure 4), (3) choice of filter bands ( or ) of relation (Figure 5), (4) choice of the relations by different authors (Figure 6) (5) (0.5 0.9; Figure 7), and (6) choice of passive evolution models (; is calculated for BHMFs at (Figure 9)). In calculating for (3), we compare a BHMF computed with the -band relation obtained by correcting the -band relation for the average colour (i.e., CMR is not considered) with a BHMF derived with the -band relation by MH03. In (4), the largest and smallest SMBH number densities are taken from the BHMFs in Figure 6. In addition to these, due to the errors of characteristic luminosity and normalization in a COMBO-17 LF is shown for comparison in the column (7). The errors in the LF at are adopted to calculate here, but the errors in a BHMF are similar if LFs at other redshifts are used (see the lower panel of Figure 1).
This table demonstrates that most of the uncertainties are negligible at , while they are significant in the range of . The uncertainty related to the photometric band selection and colour correction and that related to selection of the relations by different studies are the most serious and they amount to an order of magnitude at the massive end. Those due to the fitting error of the -band relation and the possible uncertainty in also appear to be substantial.
3 BHMF FROM AGN LF
In this section, we investigate the cosmological evolution of BHMFs derived from AGN LFs (AGN-BHMFs hereafter). The results will be compared with those from COMBO-17 LFs (spheroid-BHMFs hereafter) in § 4. By assuming that only mass accretion grows the central SMBH at a galactic centre and galaxy mergers are not important in its growth history, the time evolution of a BHMF can be described by the continuity equation:
| (2) |
where represents the mean mass accretion rate at a given SMBH mass and at a cosmic time . Furthermore, if we assume a constant radiative efficiency (, where and is the bolometric luminosity and the mass accretion rate, respectively) and a constant Eddington ratio (, where is the Eddington luminosity) for all the AGNs, the second term of the above equation can be simply related to a (bolometric) luminosity function of AGNs. This finally reduces the continuity equation to:
| (3) |
where is the Eddington time and is the AGN LF (for details, see Marconi et al. 2004). We note that is the number of AGNs per , while is the number of SMBHs per . Hence, once the form of an AGN LF is known as a function of redshift, one can integrate this equation to obtain BHMFs at any redshifts starting from the initial condition, either in time decreasing order (from a high redshift to ) or the inverse (from to higher redshifts).
Following the procedure adopted by Marconi et al. (2004), here we derive AGN-BHMFs at intermediate redshifts starting from a BHMF at as the initial condition (it is assumed that all the SMBHs at were shining as AGNs). In the calculation, we use the hard X-ray AGN LF (HXLF) by Ueda et al. (2003, U03 hereafter), which is described by a luminosity-dependent density evolution model (LDDE model; see their § 5.2 for details). To take into account the contribution of “Compton-thick” AGNs to the total mass accretion rate, we multiply a correction factor of 1.6 independently of the AGN luminosity. The luminosity-dependent bolometric correction described in Marconi et al. (2004) is adopted. The Eddington ratio and the radiative efficiency are assumed to be constant, and , respectively, also based on the study by Marconi et al. (2004). The results are shown in Figure 10, indicating that while the BHMFs in the range of hardly change out to , they exhibit a clear redshift evolution at . That is, almost all SMBHs with a mass larger than formed at , while lighter SMBHs grow later, suggesting a downsizing of SMBH evolution.
It needs to be pointed out that there are several uncertainties in the AGN-BHMFs thus far derived as follows:
-
1.
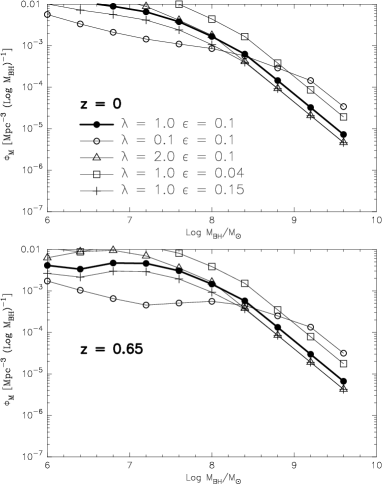
There are ranges of values in Eddington ratio and radiative efficiency which give a reasonable fit of an AGN-BHMF to the spheroid-BHMF at . The distribution studied by Marconi et al. (2004) suggests a possible range of and within 1 uncertainty. In Figure 11, we exemplify AGN-BHMFs at and 0.65 for five sets of and ; either of or is fixed to the adopted value ( or ) and the largest or smallest value within the uncertainty is chosen for the other parameter. This plot indicates that, as expected from equation (3), the normalization of an AGN-BHMF is altered and the AGN-BHMF is shifted along the axis by changing , while only the normalization is affected by changing . In the following analysis, AGN-BHMFs will be calculated for a number of pairs of and on the 1 contour provided by Marconi et al. (2004; see their Figure 7) and the envelope of these AGN-BHMFs that gives a possible range of SMBH density at a given will be adopted as uncertainty of AGN-BHMF.
-
2.
The assumption of constant Eddington ratio and radiative efficiency for all the AGNs is perhaps too simple. Although Marconi et al. (2004) claim that the local spheroid-BHMF can be well reproduced by the AGN-BHMF with a constant and , the solution only gives a sufficient condition to the limited constraints at . Furthermore, Heckman et al. (2004) claim that AGNs have various Eddington ratios and the ratios seem to depend on Kawaguchi et al. (2004) also propose that super-Eddington accretion is essential for a major growth of SMBH.
-
3.
There is ambiguity in the continuity equation itself; if a merging process should be added as a source term in the equation, a resultant BHMF would change.
-
4.
Although the HXLF by U03 accounts for all the Compton-thin AGNs including obscured AGNs, the uncertainties in the estimate of Compton-thick AGNs directly affect the resulting BHMFs.
Quantifying all of these uncertainties but (1) requires substantial theoretical works and/or new observational data and is beyond the scope of this paper, but one must keep them in mind.
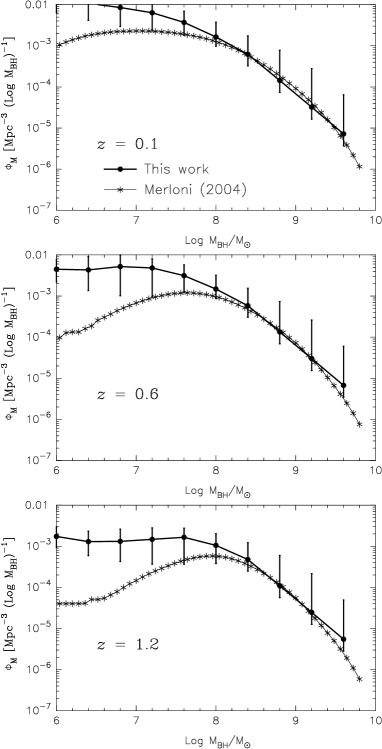
It may be intriguing to compare these AGN-BHMFs with those recently obtained by Merloni (2004), where a new method is employed to investigate the redshift evolution. They introduce a conditional luminosity function (CLF), which is the number of active black holes per unit comoving volume per unit logarithm of radio () and X-ray () luminosity and is defined so that by integrating a CLF over the range of or , the radio LF (RLF) or X-ray LF (XLF) of AGNs is obtained, respectively. In order to relate and of AGN to without any assumptions on accretion rate, they use an empirical relation among , , and (fundamental plane of black hole activity; Merloni, Heinz & Di Matteo 2003). A CLF also needs to satisfy a constraint that the number density of SMBHs with a certain mass is obtained by integrating a CLF over the ranges of and which are determined by the fundamental plane. Consequently, once a BHMF is obtained at a redshift of , a CLF can be computed using RLF, XLF, and BHMF as constraints.333In this calculation, the fundamental plane of black holes is assumed to be independent of redshift. Note that RLFs and XLFs from observations are available up to high redshifts; the RLFs obtained by Willott et al. (2001) and the HXLF by U03 are used in Merloni (2004). Given a functional form of accretion rate444In Merloni (2004), where is adopted ( is accretion efficiency)., a mean accretion rate can also be calculated as a function of . Using a BHMF and a mean accretion rate at , a BHMF at can be derived from the continuity equation. Likewise, BHMFs at higher redshifts can successively be calculated and hence RLF, XLF, and BHMF at are firstly needed. In Merloni (2004), the local BHMF is obtained using LFs of galaxies with different morphologies by Marzke et al. (1994) and the empirical relationships among spheroid luminosity, velocity dispersion, and .
Figure 12 shows the comparison of AGN-BHMFs at redshifts of 0.1, 0.6, and 1.2 calculated in the two different methods: (I) BHMFs derived by integrating the continuity equation from to lower redshifts using the U03 HXLF with and . The error bars represent the upper and lower bounds of SMBH density at a given that is calculated from AGN-BHMFs for a number of pairs of and on the 1 contour provided by Marconi et al. (2004). (II) Those obtained by Merloni (2004), which are integrated from to higher redshifts using the CLF with the fundamental-plane relation. This comparison indicates that while the agreement of the AGN-BHMFs is good in the massive end, the discrepancy at is substantial at all redshifts. There could be several reasons for this disagreement. One possibility may be related to the choice of an initial spheroid-BHMF; we note that the BHMF at in Merloni (2004) has a normalization 10 times smaller at than the local BHMF independently estimated by Marconi et al. (2004, see their Figure 2). Another reason could be the different estimate for the mean mass accretion rate. In fact, we find that the second term of the equation (2) averaged between and calculated in method I is significantly larger than that in method II in the range of . We just point out the facts in this paper and leave further discussions for future studies. In the next section, we adopt the AGN-BHMFs calculated by method I for comparison with the spheroid-BHMFs.
4 DISCUSSIONS
4.1 Comparison of Spheroid-BHMFs with AGN-BHMFs
In Figure 13, spheroid-BHMFs are compared with AGN-BHMFs up to . The spheroid-BHMFs transformed from the COMBO-17 LFs at redshifts of 0., 0.25, 0.45, 0.65, 0.85, and 1.05 are indicated with shaded regions (the BHMF at was derived from the LF of the red sequence galaxies in the SDSS EDR; see Appendix in Bell et al. 2004b). The widths of the shaded regions are determined by considering not only the errors of and but also the uncertainty associated with band transformation between and of the relation, which is the most significant uncertainty among those investigated (see § 2.3). The upper bound of the shaded region is the BHMF derived by applying the -band relation by MH03 to an LF with the largest values of characteristic luminosity and normalization within the errors. To determine the lower bound, a -band relation calculated by correcting the -band relation for the average colour of early-type galaxies is applied to an LF with the smallest values of characteristic luminosity and normalization within the errors. The transformation of the -band relation to band is performed only at and the -band relations at high redshifts are then obtained by correcting it for passive luminosity evolution in the band. The spheroid-BHMF is depicted with shaded region down to the mass corresponding to the lowest luminosity among the data points in the LF. At the masses lower than this cutoff, the upper- and lower-bound BHMFs are indicated by dashed lines. The characteristic corresponding to at each redshift is indicated by arrow. Two arrows are shown in each panel; the one at the more massive end shows the characteristic of the upper-bound BHMF, and the other is of the lower-bound BHMF. The solid curve, which goes through the middle of the upper- and lower-bound BHMFs at , indicates the BHMF at 555We adopt the BHMF not at but at just for consistency; the LFs at are calculated with the data from the COMBO-17 survey, while the LF at is from the SDSS data. calculated with a -band relation converted from the -band relation by correcting for T-CMR. This BHMF is plotted in all the panels as a fiducial of comparison. The AGN-BHMFs calculated with the continuity equation and the HXLFs by U03 at the same redshifts as the spheroid-BHMFs are overplotted with open circles. The error bars indicate the upper and lower bounds of SMBH density allowing for the 1 uncertainty of and .
From Figure 13, it is suggested that at , the spheroid-BHMFs666In Figure 13, the spheroid-BHMF at appears to exceed that at . This is because of the large increase of characteristic luminosity in the COMBO-17 LF from to 0.25. This increase is significantly larger than that predicted for passive evolution, while the rate of luminosity evolution at is fully consistent with passive evolution out to . The origin of the large luminosity increase at the low redshift is currently unknown. are broadly consistent with the AGN-BHMFs out to . This agreement between the spheroid-BHMFs and the AGN-BHMFs appears to support that most of the SMBHs are hosted by massive spheroids already at and they evolve without significant mass growth since then. The discrepancy at between the spheroid-BHMFs and the AGN-BHMFs is presumed to be due at least partly to the fact that small bulges in late-type galaxies tend to be excluded in selecting the red sequence galaxies and thus their contributions are not expected to be included in the COMBO-17 LFs or the spheroid-BHMFs. In fact, galaxy LFs are not well constrained down to such low luminosities and future observations therefore need to be awaited for any further discussions on the discrepancies in the light end of BHMF. It is interesting to point out that while the AGN-BHMFs at do not significantly evolve out to , the spheroid-BHMFs exhibit a slight redshift evolution (see also Figure 1 and Figure 10). We note that the uncertainties of the spheroid-BHMFs considered in Figure 13 are larger than those in Figure 1, where the evolution in spheroid-BHMF may look clearer. One possible reason for the difference in evolution between the spheroid-BHMFs and the AGN-BHMFs is a selection effect on the red sequence galaxy LFs; if there are more blue spheroids with on-going star formation and/or young stellar population towards then their contribution is more likely to be missed from the red sequence galaxy LF and the spheroid-BHMF at higher redshifts. In fact, as mentioned earlier, the BHMFs obtained from morphologically selected early-type galaxy LFs tend to exceed those from the COMBO-17 LFs at (Figures 2 and 3).
4.2 Does the correlation between and host spheroid mass evolve with redshift?
An alternative interpretation of the possible difference in evolution between the spheroid-BHMFs and the AGN-BHMFs may be a difference at high redshift between the actual relation and our assumption. In other words, there may be an evolution of the relation other than the passive luminosity evolution of spheroid. In order to see whether this can be the case, it is worth examining how a BHMF can be affected by changing the relation.
Here, we consider a simple case where, in the relation (), the coefficient of or varies. Figures 8 and 9 demonstrate the effect on BHMF of an evolution of ; a BHMF is shifted mostly in parallel to the axis. The effect of changing on a BHMF is similar, although it can be a modification in shape of BHMF rather than a lateral shift. Therefore, changing neither nor moves the BHMF along the axis of the number density of SMBH. On the other hand, the redshift evolution of the actual spheroid-BHMFs seems to be dominated by that along the number density axis, suggesting that it is difficult to explain the slight difference in evolution between the spheroid-BHMF and the AGN-BHMF by changing and with redshift.
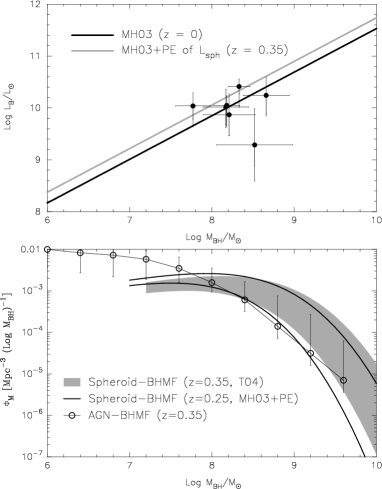
Recently, a possible offset from the local relationship between and central velocity dispersion () has been found at by investigating spectra of the central regions of galaxies hosting type 1 AGNs (Treu, Malkan & Blandford 2004, T04 hereafter). It is interesting to see a spheroid-BHMF at this redshift derived with the offset found by T04. In order to apply the relation at to a COMBO-17 LF at , the relation needs to be converted to a relation. One possible way is to estimate spheroid luminosities of the galaxies observed by T04 from their central velocity dispersions777According to T04, the velocity dispersions within an aperture used by T04 () are converted to the central velocity dispersions () as . with the Faber-Jackson relation at in the rest-frame band (Ziegler et al. 2005) and plot them against . The results are shown with solid circles in the upper panel of Figure 14. Although the sample size is small and there is a substantial scatter, the distribution of the data points suggests that the actual relation followed by these spheroids lies closer to the local relationship than that allowing for a passive evolution of between and 0.37. In the lower panel of Figure 14, a BHMF derived from the COMBO-17 LF at using the relation at , which seems to be followed by the T04 galaxies, is indicated with shaded region. This BHMF is compared with that at a lower redshift () derived with a relation considering a passive luminosity evolution between and 0.25. The latter BHMF is indicated with solid lines. The uncertainties of these spheroid-BHMFs are indicated with the width of the shaded region or the separation of the lines; the upper and lower bounds are defined in the same way as those in Figure 13. The AGN-BHMF at is overplotted with open circles. The error bars are calculated in the same way as those in Figure 12. Although the uncertainties of the BHMFs are large, this comparison suggests that the BHMF obtained with the relation followed by the T04 galaxies is slightly more biased to the massive end. This trend could be seen more clearly when the BHMF is compared with that at . This apparently suggests a growth of SMBH towards higher redshift, which is unlikely in practice (see also Robertson et al. 2005). More galaxies need to be investigated to examine the correlation between and or at high redshift.
4.3 Future perspective
If much fainter end of early-type galaxy LF was determined from observations, BHMF could be probed further down to the low mass end (). Since a redshift evolution of AGN-BHMF is suggested to be fast at intermediate redshifts in this mass range (Figure 10; see also Merloni 2004), it would be interesting to look at the counterpart in spheroid-BHMFs in order to put much stronger constraints on the co-evolution of AGN and spheroid, particularly down-sizing effects of their evolutions. Currently, galaxy LFs are not well constrained down to such low luminosities, especially at cosmological distances. Even at low redshifts, the faint end slope of an LF tends to be fixed to a certain value in fitting a Schechter function to the data and deriving and . Much deeper data (e.g., 2 mag deeper than the COMBO-17 limit) are essential to address the faint end of LF out to . Keeping a survey area similar to or even wider than COMBO-17 is the key to deriving reliable LFs and to estimate cosmic variance. Multi-band photometry would be required to obtain photometric redshifts in good accuracy down to the faint end. In addition, high spatial resolution images would enable one to directly measure spheroid luminosities of galaxies. Although it is highly expensive to take data sets satisfying all these requirements, one promising candidate for this challenge is the COSMOS survey: a 2 square degree field is surveyed with the HST/ACS in the band down to 27.8 mag () in the AB magnitude (cf. galaxies with mag are used to study LFs in COMBO-17) and also with Subaru/Suprime-Cam in the bands (Taniguchi et al. 2005).
ACKNOWLEDGMENTS
We are grateful to the anonymous referee for helpful comments to improve this paper. This research was partly supported by a Grant-in-Aid for Scientific Research from Japan Society for the Promotion of Science (17540216).
References
- Aller & Richstone (2002) Aller M. C., Richstone D., 2002, AJ, 124, 3035
- Bell et al. (2004a) Bell E. F., et al., 2004a, ApJ, 600, L1
- Bell et al. (2004b) Bell E. F., et al., 2004b, ApJ, 608, 752
- Bower, Lucey & Ellis (1992) Bower R. G., Lucey J. R., Ellis R. S., 1992, MNRAS, 254, 601
- Cavaliere, Morrison & Wood (1971) Cavaliere A., Morrison P., Wood K., 1971, ApJ, 170, 223
- Cross et al. (2004) Cross N. J. G., et al., 2004, AJ, 128, 1990
- Ferrarese & Merritt (2000) Ferrarese L., Merritt D., 2000, ApJ, 539, L9 (FM00)
- Fioc & Rocca-Volmerange (1997) Fioc M., Rocca-Volmerange B., 1997, A&A, 326, 950
- Gebhardt et al. (2000) Gebhardt, K., et al., 2000, ApJ, 539, L13
- Girardi et al. (2003) Girardi M., Mardirossian F., Marinoni C., Mezzetti M., Rigoni E., 2003, A&A, 410, 461
- Heckman et al. (2004) Heckman T. M., Kauffmann G., Brinchmann J., Charlot S., Tremonti C., White S. D. M., 2004, ApJ, 613, 109
- Im et al. (2002) Im M., et al., 2002, ApJ, 571, 136
- Kawaguchi et al. (2004) Kawaguchi T., Aoki K., Ohta K., Collin S., 2004, A&A, 420, L23
- Kochanek et al. (2001) Kochanek C. S., et al., 2001, ApJ, 560, 566
- Kodama & Arimoto (1997) Kodama T., Arimoto N., 1997, A&A, 320, 41
- Kodama et al. (1998) Kodama T., Arimoto N., Barger A. J., Aragón-Salamanca A., 1998, A&A, 334, 99
- Magorrian et al. (1998) Magorrian J., et al., 1998, AJ, 115, 2285
- Marconi & Hunt (2003) Marconi A., Hunt L. K., 2003, ApJ, 589, L21 (MH03)
- Marconi et al. (2004) Marconi A., Risaliti G., Gilli R., Hunt L. K., Maiolino R., Salvati M., 2004, MNRAS, 351, 169
- Marzke et al. (1994) Marzke R. O., Geller M. J., Huchra J. P., Corwin H. G., 1994, AJ, 108, 437
- McLure & Dunlop (2002) McLure R. J., Dunlop J. S., 2002, MNRAS, 331, 795 (MD02)
- McLure & Dunlop (2004) McLure R. J., Dunlop J. S., 2004, MNRAS, 352, 1390
- Merloni (2004) Merloni A., 2004, MNRAS, 353, 1035
- Merloni, Heinz & Di Matteo (2003) Merloni A., Heinz S., Di Matteo T., 2003, MNRAS, 345, 1057
- Merritt & Ferrarese (2001) Merritt D., Ferrarese L., 2001, MNRAS, 320, L30 (MF01)
- Peletier et al. (1990) Peletier R. F., Davies R. L., Illingworth G. D., Davis L. E., Cawson M., 1990, AJ, 100, 1091
- Robertson et al. (2005) Robertson B., Hernquist L., Cox T. J., Di Matteo T., Hopkins P. F., Martini P., Springel V., 2005, ApJ, submitted (astro-ph/0506038)
- Schweizer & Seitzer (1992) Schweizer F., Seitzer P., 1992, AJ, 104, 1039
- Shankar et al. (2004) Shankar F., Salucci P., Granato G. L., De Zotti G., Danese L., MNRAS, 354, 1020
- Sheilds et al. (2003) Shields G. A., Gebhardt K., Salviander S., Wills B. J., Xie B., Brotherton M. S., Yuan J., Dietrich M., 2003, ApJ, 583, 124
- Small & Blandford (1992) Small T. A., Blandford R. D., 1992, MNRAS, 259, 725
- Stoughton et al. (2002) Stoughton, C., et al., 2002, AJ, 123, 485
- Tamura & Ohta (2003) Tamura N., Ohta K., 2003, AJ, 126, 596
- Taniguchi et al. (2005) Taniguchi Y., et al., 2005, in the Proceedings of the 6th East Asian Meeting on Astronomy, JKAS, 39, in press (astro-ph/0503645)
- Terlevich et al. (2001) Terlevich A. I., Caldwell N., Bower, R. G., 2001, MNRAS, 326, 1547
- Treu, Malkan & Blandford (2004) Treu T., Malkan M. A., Blandford R. D., 2004, ApJ Letters, 615, L97 (T04)
- Ueda et al. (2003) Ueda Y., Akiyama M., Ohta K., Miyaji T., 2003, ApJ, 598, 886 (U03)
- Willott et al. (2001) Willott C. J., Rawlings S., Blundell K. M., Lacy M., Eales S. A., 2001, MNRAS, 322, 536
- Wolf et al. (2003) Wolf C., Meisenheimer K., Rix H.-W., Borch A., Dye S., Kleinheinrich M., 2003, A&A, 401, 73
- Ziegler et al. (2005) Ziegler B. L., Thomas D., Böhm A., Bender R., Fritz A., Maraston C., 2005, A&A, 433, 519