Planetary nebulae and stellar kinematics in the flattened elliptical galaxy NGC 1344111 Part of the data presented herein were obtained at the European Southern Observatory, Chile, Programs ESO 67.B-0231 and 68.B-0173A.
Abstract
We present photometric and kinematic information obtained by measuring 197 planetary nebulae (PNs) discovered in the flattened Fornax elliptical galaxy NGC 1344 (also known as NGC 1340) with an on-band, off-band, grism + on-band filter technique. We build the PN luminosity function (PNLF) and use it to derive a distance modulus , slightly smaller than, but in good agreement with, the surface brightness fluctuation distance. The PNLF also provides an estimate of the specific PN formation rate: PNs per year per solar luminosity. Combining the positional information from the on-band image with PN positions measured on the grism + on-band image, we can measure the radial velocities of 195 PNs, some of them distant more than 3 effective radii from the center of NGC 1344. We complement this data set with stellar kinematics derived from integrated spectra along the major and minor axes, and parallel to the major axis of NGC 1344. The line-of-sight velocity dispersion profile indicates the presence of a dark matter halo around this galaxy.
1 Introduction
The currently favored hierarchical theories of galaxy formation predict that galaxies should be surrounded by dark matter halos. In particular elliptical galaxies are expected to form through merging events, and their angular momenta are expected to reside mostly in the outer halos. From the observational point of view, the existence of dark matter around some very bright elliptical galaxies is inferred from studies of hot, X-ray emitting gas (e.g., Loewenstein & White 1999) and from dynamical analyses of integrated absorption-line spectra (e.g., Gerhard et al. 2001). At the faint end, the kinematics of individual stars in the nearby Draco dwarf spheroidal offer evidence of a dark matter halo (Kleyna et al. 2002). For intermediate, “ordinary” ellipticals, the evidence is much more difficult to obtain, because they lack the hot gas and they are too distant to extract information from individual stars.
Planetary nebulae (PNs) in such elliptical galaxies offer a good alternative for dark matter studies because they are preferentially detected in the outskirts of their galaxies. A study of PNs in NGC 5128 produced some evidence of a dark matter halo (Hui et al. 1995). Everything seemed to be clear. However, more recent studies of PNs in other elliptical galaxies have raised some doubts on the ubiquity of dark matter halos in ellipticals: Méndez et al. (2001) and Romanowsky et al. (2003) could not find evidence of dark matter around 4 normal ellipticals: NGC 4697, 3379, 4494 and 821.
It is possible to argue that at least in some of these cases we may be witnessing the effect of some kind of anisotropy in the velocity distribution, for example the preponderance of radial orbits. This idea has been tested by Romanowsky et al. (2003) using an “orbit library method”, which fails again to find evidence of any cloak or shroud of dark matter around the visible mass in the case of NGC 3379. On the other hand, Milgrom & Sanders (2003) claim that the new findings confirm the predictions of Milgrom’s Modified Newtonian Dynamics (MOND) in the sense that high surface density galaxies are predicted to develop a “mass discrepancy” only at larger scaled radii.
In view of this interesting situation, we need more empirical information. This paper reports on the discovery and photometric and radial velocity measurements of PNs in the flattened Fornax elliptical galaxy NGC 1344 (also known as NGC 1340). Of intermediate mass and luminosity, this galaxy, a member of the Fornax cluster, is characterized by the presence of internal and external concentric shells (surface brightness enhancements partially encircling the galaxy) first described by Malin & Carter (1980).
We have also secured some long-slit spectrograms across NGC 1344 to improve the kinematic information close to the galaxy’s center, where the surface brightness is higher and the PNs are more difficult to find. In § 2 we describe long-slit spectrograms taken with the Siding Spring 2.3 m telescope, and with the European Southern Observatory (ESO) Very Large Telescope (VLT), and the resulting information. Then in §§ 3 and 4 we briefly review the slitless radial velocity method, and we describe the VLT observations of PNs in NGC 1344 and the reduction procedures. Section 5 deals specifically with the PN detection and photometry. In § 6 we build the PN luminosity function and derive the PNLF distance to NGC 1344 and the specific PN formation rate. In § 7 we describe the radial velocity results, which we analyze in § 8. Section 9 gives a summary of the conclusions.
2 Long-slit spectrograms of NGC 1344
The major axis of NGC 1344 lies at a position angle of about 167 degrees (from north through east). Long-slit spectroscopy along the major axis of NGC 1344 was obtained in October 2001 at the Siding Spring 2.3 m telescope, using the red arm of the Double Beam Spectrograph (Rodgers et al. 1988) in longslit () mode with 1200 R Grating (35.2 Å mm-1), no beamsplitter, slit width of and the Site , 15-m pixels CCD. Astigmatism along the spatial direction reduced the effective spatial resolution to . The wavelength range Å was covered, including the Ca Triplet region used for the kinematics. The integration time was 93 minutes. Several stars were observed, trailed along the slit, in order to use them as kinematic templates. The data reduction followed Saglia et al. (2002); see below.
Long-slit spectroscopy along the minor axis and parallel to the major axis (shifted by 16.5 arcsec to the northeast) of NGC 1344 was performed in service mode using the Focal Reducer/Spectrograph FORS2 at the Cassegrain focus of Unit Telescope 2, Kueyen, of the Very Large Telescope, Cerro Paranal, Chile, as part of Program ESO 68.B-0173A. The spectra were acquired on the 7th and 8th of January 2002 with seeing and good conditions. The grism 1400V+18 was used with a -wide long slit. The 20802048, 24 m pixel Tektronix CCD has a pix-1 scale along the spatial direction and 0.5 Å pix-1 along the dispersion direction, covering the wavelength range Å with a spectral resolution of 2.5 Å or km s-1 (see FORS Manual, Version 2.0). The integration times were 1700 s along the major axis (P.A.=) and 1800 s along the minor axis (P.A.=) of NGC 1344. Template stars were also observed.
The data reduction was perfomed under MIDAS and followed the usual steps. After bias subtraction and flatfielding with dome flats, cosmic rays were eliminated using median filtering. The wavelength calibration was based on HeArHgCd lamps and gave 0.5 Å rms. After rebinning on a natural logarithmic wavelength scale, the sky measured at the ends of the slit was subtracted, and the galaxy spectra were rebinned along the spatial direction to obtain a signal-to-noise ratio nearly constant with radius. The kinematics were determined with the Fourier Correlation Quotient method, as in Bender et al. (1994) and Mehlert et al. (2000).
Statistical and systematic errors were estimated following Mehlert et al. (2000). Briefly, template stars were broadened to the observed values of , , and , and noise was added to match the power spectrum noise to the peak ratio at the appropriate place. The generated spectra were analysed in the same way as the observed data, producing mean and rms values of , , , and . The mean values reproduced the input (observed) values within the rms. These are the errors assigned to the data. For the VLT data, the statistical errors derived from Monte Carlo simulations are minute and much smaller than the rms scatter observed between the two sides of the galaxy. This can be used to set the residual systematic errors affecting the data, which amount to km s-1 on , km s-1 on , and in and . A residual mean systematic difference between the antisymmetrized differences of the values between the two sides of the galaxy of points to some residual template mismatching.
Figures 1, 2, and 3 show the derived profiles. Tables 1, 2, and 3 give the data in tabular form. The parameters and are the amplitudes of the third- and fourth-order Gauss-Hermite functions used to describe the line-of-sight velocity distribution.
Along the minor axis, we detect a decoupled core, with the mean velocity changing sign in the inner . Along the major axis (or parallel to it), the parameter anticorrelates with the mean velocity , following the known local relation between observed in early-type galaxies (see Bender et al. 1994). Along the minor axis, as expected in the absence of rotation. All profiles are mostly slighly negative, with the exception of the inner 7 arcsec along the minor axis, in correspondence to the decoupled core. Such negative profiles are not observed very often in early-type galaxies, and suggest an interesting orbital structure to be investigated with proper modeling in the future (see, for example, Thomas et al. 2005).
3 On PN detection and slitless radial velocities
For the detection of PNs belonging to NGC 1344, we used the classical on-band, off-band method. The method is based on blinking two images: an on-band image taken through a narrow-band filter passing the redshifted [O iii] 5007 nebular emission line, and an off-band image taken through a broader filter passing no strong nebular emissions. The PNs, which are point sources, are visible in the on-band image but must be absent in the off-band image, which should be exposed a bit deeper for unambiguous detections.
Taking a third image through the on-band filter and a grism helps with the identification of the PN candidates. As a consequence of inserting the grism into the light path, the images of all continuum sources are transformed into segments of width determined by the on-band filter transmission curve, while the PNs and any other emission-line point sources remain point sources. But in addition, and most important, the grism introduces a shift relative to the undispersed on-band image. The shift is a function of the wavelength of the nebular emission line and of position on the CCD. Once we measure and calibrate the shift, we can calculate the emission-line wavelength for all detected sources, and finally we obtain their radial velocities irrespective of the number of sources and their distribution in the field. This method has already been used to discover and measure the radial velocities of 535 PNs in the elliptical galaxy NGC 4697 (Méndez et al. 2001; hereafter Paper I). Please refer to Paper I for a detailed description of the calibration procedures.
4 PN search: VLT observations and reductions
Since the major axis of NGC 1344 is close to the north-south direction, we decided to expose two partly overlapping fields, north and south, both containing the center of the galaxy. For simplicity, we call the two fields N and S.
The observations were made with the first Focal Reducer/Spectrograph (FORS1) at the Cassegrain focus of Unit Telescope 3, Melipal, of the ESO Very Large Telescope, Cerro Paranal, Chile, on three second-half-nights, 2001 September 22/23/24. FORS1, with the standard collimator, gives a field of on a 2080 2048 CCD (pixel size 24 24 m). The image scale is pix-1. Direct imaging was done through interference filters. The on-band and off-band filters used for NGC 1344 have the following characteristics: effective central wavelength in observing conditions of 5030 and 5300 Å, peak transmissions of 0.83 and 0.85, equivalent widths of 48.5 and 215 Å, and FWHMs of 60 and 250 Å. The dispersed images were obtained with grism 600B. This grism gives a dispersion of 50 Å mm-1, or 1.2 Å pix-1, at 5000 Å.
Table 4 shows the CCD images used for data reduction analysis. They can be grouped as follows:
1. Off-band, on-band, and (grism + on-band) images of the NGC 1344 N field.
2. Off-band, on-band, and (grism + on-band) images of the NGC 1344 S field.
3. On-band and (grism + on-band) multislit images and comparison lamp spectra through 10 different vertical arrangements of the 19 FORS slitlets for the wavelength calibration.
4. On-band and (grism + on-band) multislit images and spectra of the Galactic PN NGC 7293 (PN G036.1-57.1) in six different positions across the CCD for complementary calibration purposes described in Paper I. These observations were done through another on-band filter with an effective central wavelength of 4992 Å and FWHM=60 Å.
5. On-band (5030 Å) images of the spectrophotometric standard LTT 9491 (Oke 1990) for the photometric calibration.
The three allocated half-nights were dark and of photometric quality, with seeing around , , and on the first, second, and last night, respectively.
The basic CCD reductions (bias subtraction, flat-field correction using twilight flats) were made using IRAF666IRAF is distributed by the National Optical Astronomical Observatories, which are operated by the Association of Universities for Research in Astronomy, Inc., under cooperative agreement with the National Science Foundation. standard tasks. Image combinations, required to eliminate cosmic ray events and enable detection of faint PNs, were made in the following way: First, for each field, N and S, one pair of (undispersed, dispersed) on-band individual images of the best possible quality, and taken consecutively at the telescope, was adopted as reference images. For the S field, the reference images were 22T06:41 (on-band) and 22T07:08 (grism+on-band) (see Table 4). For the N field, the reference images were 24T08:00 (on-band) and 24T08:27 (grism+on-band). All the other available images, including the off-band ones, were registered upon the corresponding reference image. In this way, any possible displacements produced by guiding problems or deformations in the spectrograph were reduced to a minimum. The registration was done with IRAF tasks “geomap” and “gregister”. The registration of the undispersed S field was very good; using 113 stars, the residuals were not larger than 0.1 pixel. For the registration of the undispersed N field, 114 stars were used, but the residuals were up to 0.2 pixel because some of the N images were more affected by poor seeing.
Registration of the dispersed images was more difficult. From previous experience in Paper I we know that it is better to register using the brightest PN images, avoiding any temperature-dependent shifts in the positions of the spectral segments produced by normal stars. For that reason, we registered the N field using the 28 brightest PNs (visible in the individual grism+on-band images). For the S field, the corresponding number was 25 PNs. The resulting residuals in both cases were smaller than 0.3 pixel. Since an error of 0.3 pixel in the distance between undispersed and dispersed images would produce an error of 20 km s-1 in radial velocity for the grism dispersion of 50 Å mm-1, we can estimate that a typical internal error in an individual measurement is not larger than 20 km s-1. Having obtained a satisfactory registration, we produced the combined on-band, off-band and dispersed images for the N and S fields using the IRAF task “imcombine”.
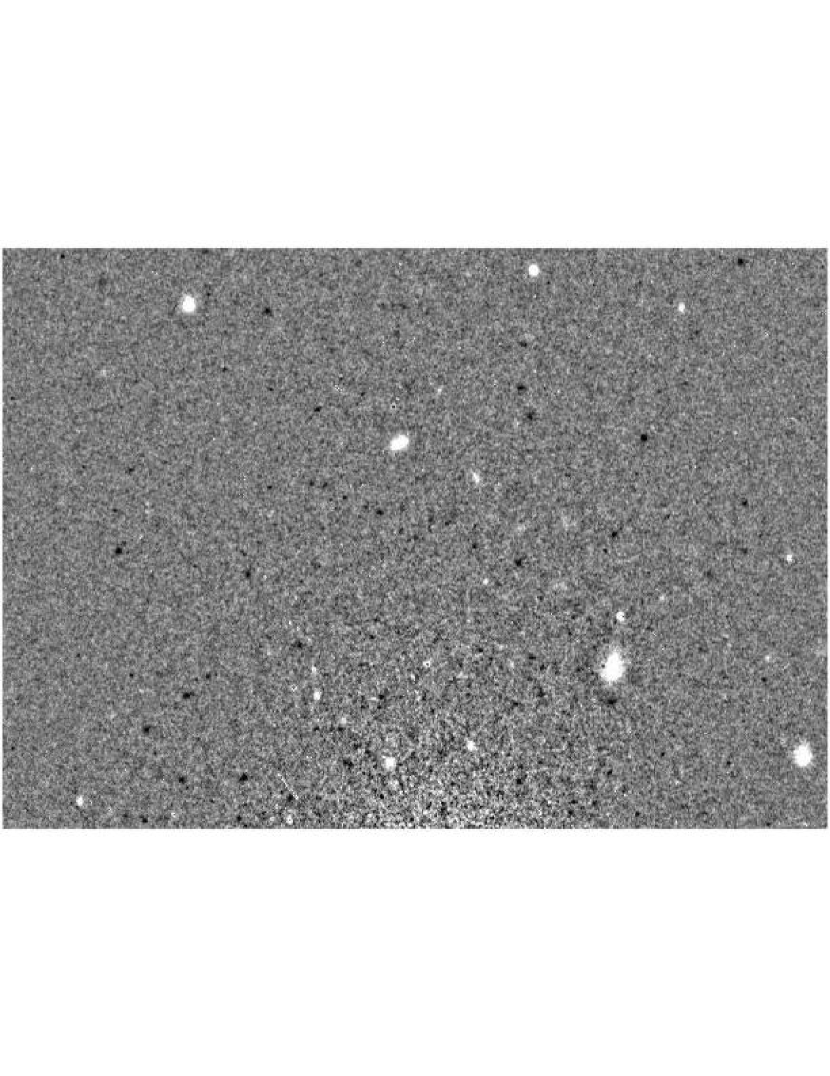
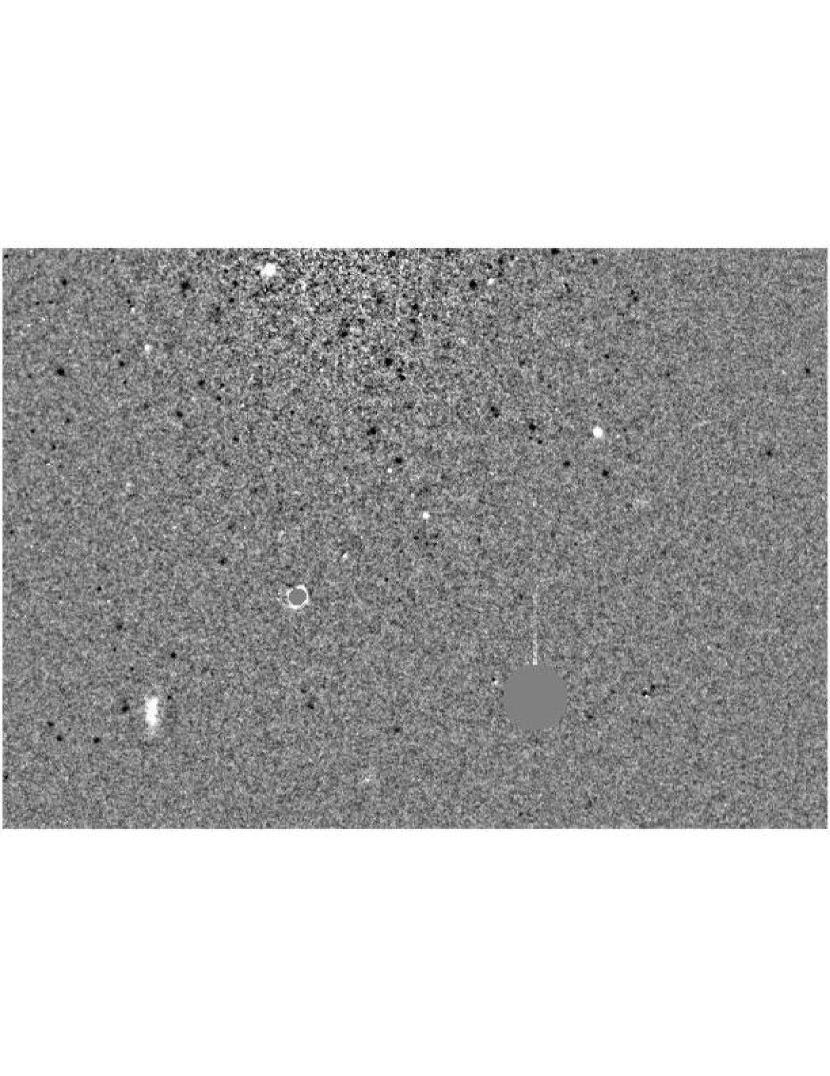
For easier PN detection and photometry in the central parts of NGC 1344, where the background varies strongly across the field, we produced images showing the differences between undispersed on-band and off-band combined frames. In ideal conditions, this image subtraction should produce a flat noise frame with the emission-line sources as the only visible features. A critical requirement to achieve the desired result is perfect matching of the PSFs of the two frames to be subtracted. For this purpose, we applied a method for “optimal image subtraction” developed by Alard & Lupton (1998) and implemented in Munich by Gössl & Riffeser (2002) as part of their image reduction pipeline. Figures 4 and 5 show sections of the resulting difference images in the N and S fields.
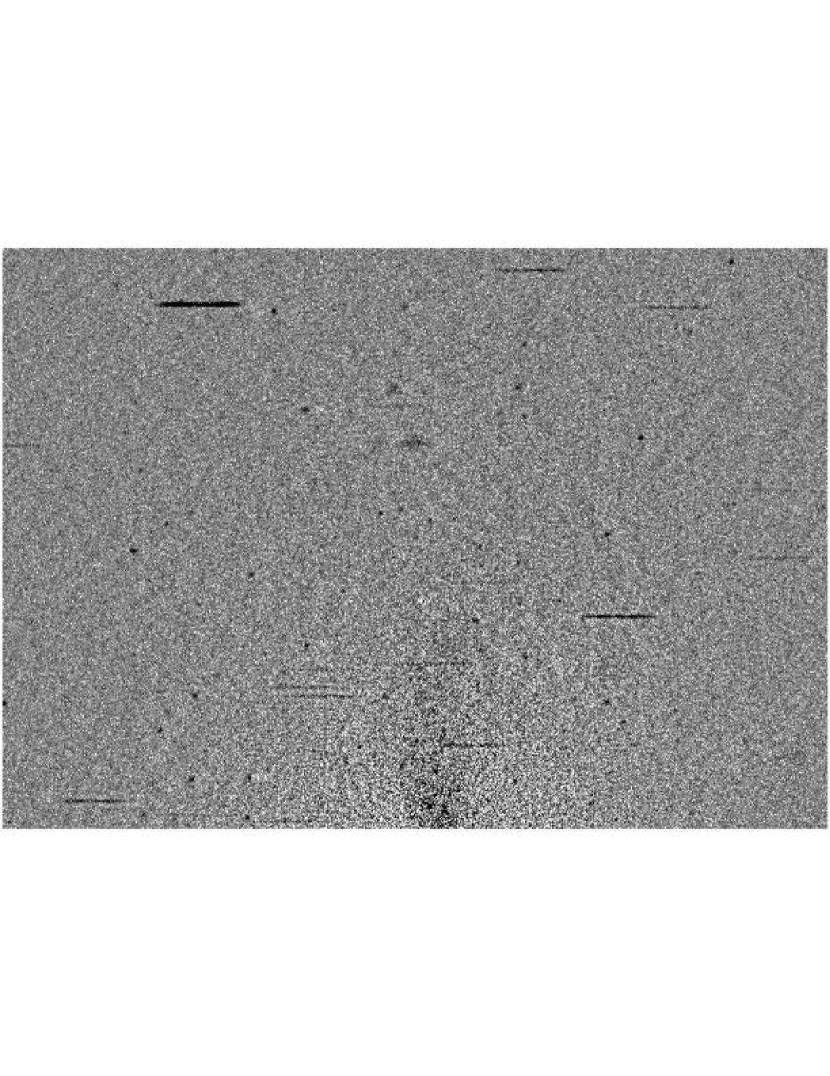
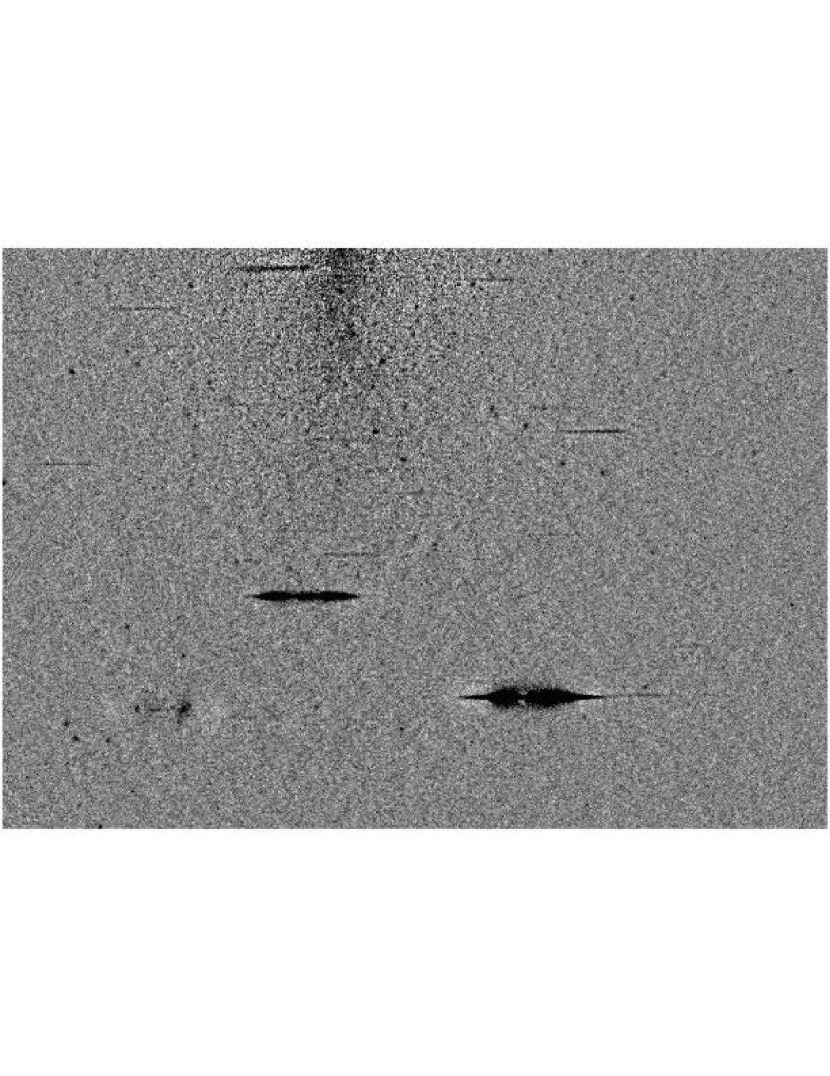
This procedure cannot be used for the combined dispersed images because there is no off-band counterpart. Therefore, to flatten the background and reduce the contamination of the fields by the stellar spectra, we applied the IRAF task “fmedian” to the combined N and S dispersed images, with a box of 1717 pixels. The resulting medianed images were subtracted from the unmedianed ones. Figures 6 and 7 show the result for the corresponding fields shown in Figures 4 and 5.
5 PN detection and photometry
The PN detection requires the identification of the candidates in both the undispersed and dispersed images. In addition, the object has to be a point source and must be undetectable in the off-band image. This is required to minimize the confusion with emission-line sources in background galaxies. The PN candidates were found by blinking the on-band versus the off-band difference images and confirmed by blinking on-band versus dispersed. The (, ) pixel coordinates of all the candidates in the undispersed and dispersed images were measured with the IRAF task “phot” with the centering algorithm “centroid”. We found a total of 197 PN candidates, which are listed in Table 5. In §7 we will describe the procedure for radial velocity determinations; here we present the on-band photometry.
We express the 5007 fluxes in magnitudes (5007) using the definition introduced by Jacoby (1989),
| (1) |
For the flux calibration, we adopted the standard star LTT 9491 (Oke 1990). This star has a monochromatic flux at 5030 Å of 1.033 10-14 ergs cm-2 s-1 Å-1. The flux measured through the on-band filter in units of ergs cm-2 s-1 can be calculated knowing the equivalent width of the on-band filter; using equation (1), we find (5007)=17.01 for LTT 9491.
Since most PNs were measurable only on the differences of combined images (onoff), to calculate the (5007) of the PNs we had to proceed through several steps. First, we made aperture photometry of LTT 9491 using the IRAF task “phot”. The FWHM of LTT 9491 was between 3 and 4.5 pixels. We adopted an aperture radius of 16 pixels; the sky annulus had an inner radius of 21 pixels and a width of 5 pixels. The same parameters were used to make aperture photometry of several moderately bright stars in the reference images corresponding to both fields (24T08:00 for the north field and 22T06:41 for the south field). Seven and six stars were selected in the N and S fields, respectively. Three of these stars were common to both fields. These three “internal standards” are between 2 and 3 mag fainter than LTT 9491, and they are distant from the center of NGC 1344, so that background problems are avoided.
Having tied the spectrophotometric standard to the internal frame standards, we switched to strictly differential photometry. We made aperture photometry of the “internal standards” on the N and S on-band combined images; the sky annulus had an inner radius of 11 pixels and a width of 9 pixels. On the same on-band combined images, we subsequently made PSF-fitting daophot photometry (Stetson 1987; IRAF tasks “phot”, “psf” and “allstar”) of the “internal standards” and four bright PNs. From the aperture photometry and PSF-fitting photometry of the “internal standards”, we determined the aperture correction. As a last step, we made PSF-fitting photometry of all PN candidates on the difference images (on-band minus off-band), where, of course, no stars remain. The four bright PNs were used to tie this photometry to that of the standards. We estimate internal errors in the photometry of the difference images below 3%.
To obtain physical fluxes, we needed the on-band filter peak transmission (see, e.g., Jacoby et al. 1987). For this purpose we used the method described in Paper I. No correction to the photometry as a function of redshift was necessary; given the observed velocities, to be reported later, none of our objects is shifted away from the flat peak of the on-band filter transmission curve. A good way of testing the reliability of the photometry is to plot the S on-band magnitudes (5007) as a function of the N on-band magnitudes for the 132 objects measured in both fields. From the dispersion in Figure 8, we estimate rms errors of 0.16 and 0.24 mag for (5007) brighter and fainter than 27.5, respectively. For each of these 132 PNs, we have adopted the average of the two (5007) measurements.
6 The PNLF, distance, and PN formation rate
Once the apparent magnitudes (5007) were measured, the PN luminosity function (PNLF) was built. We followed the same procedure described in Paper I. Only those PNs brighter than (5007) = 28 were used to build the PNLF. The zone of exclusion at the center of NGC 1344, which we introduce to eliminate regions of very high surface brightness, where PN detection is more difficult, is an ellipse with (minor, major) semiaxes of (250, 350) pixels (the image scale is pix-1). After eliminating the PNs within the exclusion ellipse and those that are too faint, we were left with 91 PNs. The statistically complete PNLF is plotted in Figure 9. The absolute magnitudes (5007) were derived using an extinction correction of 0.066 mag (from data listed in NED, the NASA/IPAC Extragalactic Database; see Schlegel et al. 1998) and adopting a distance modulus = 31.38, which produces the best fit. The observed PNLF was fitted with simulated PNLFs like the one used by Méndez & Soffner (1997) to fit the observed PNLF of M 31. The simulated PNLFs plotted in Figure 9 are binned, like the observed one, into 0.2 mag intervals and have a maximum final mass of 0.63 , = 1, and sample sizes between 1500 and 4000 PNs (see Méndez & Soffner 1997; the “sample size” is defined as the total number of PNs, detected or not, that exist in the surveyed area). The observed PNLF in Figure 9 presents an evident change of slope, thus making possible an unambiguous determination of distance and sample size. From the goodness of the fit at different distance moduli, we derived an internal error of 0.1 mag in distance modulus. For the total error estimate, we have to add possible systematic and random errors. The possible systematic error is the same as in Jacoby et al. (1990), i.e., 0.13 mag, including the possible error in the distance to M 31, in the modeling of the PNLF and in the foreground extinction. The random contributions in our case are 0.1 mag from the fit to the PNLF, as mentioned above, 0.05 mag from the photometric zero point, and 0.05 mag from the filter calibration. Combining all these errors quadratically, we estimate that the total error bar for the distance modulus must be 0.18 mag. Our distance modulus 31.38 is equivalent to 18.9 Mpc. Our PNLF distance modulus for NGC 1344 is a bit larger than, but in reasonable agreement with, the PNLF distance moduli of the Fornax galaxies NGC 1316, 1399 and 1404 (31.13, 31.17, and 31.15, respectively; see McMillan et al. 1993).
We find good agreement, within the uncertainties, with the SBF distance modulus 31.48 0.3 reported by Tonry et al. (2001) for NGC 1344. Note, however, that the PNLF distance is slightly shorter than the SBF distance. This small, still unexplained, discrepancy happens in many other cases; see Méndez (1999) and Ciardullo et al. (2002).
Knowing the sample size, we can estimate the specific PN formation rate in units of PNs yr-1 -1
| (2) |
where is the sample size, is the total bolometric luminosity of the sampled population expressed in , and is the lifetime of a PN, for which we have adopted 30,000 yr in the PNLF simulations. We have = 11.27, = 0.87 (de Vaucouleurs et al. 1991), = 0.08 (again from the NASA/IPAC Extragalactic Database), and a bolometric correction of 0.78 mag from which we obtain an extinction-corrected apparent bolometric magnitude 9.54. Using a distance modulus of 31.38 and a solar = 4.72, we calculate the total luminosity of NGC 1344, 4.2 1010 . The central ellipse, which we excluded, contributes 70% of the total luminosity, so the sampled luminosity is = 1.3 1010 . Adopting = 2300 from Figure 9, we obtain = (6 3) 10-12. This is the same PN formation rate obtained for NGC 4697 in Paper I.
7 Radial velocities: results and discussion
From now on, we will refer to heliocentric radial velocities determined with the slitless method simply as “velocities”. We consider first the information provided by the calibration exposures of NGC 7293. This local PN has such a large angular size that it allows us to obtain calibration measurements all across the CCD in a few exposures (see Paper I). Figure 10 shows the velocities in NGC 7293 measured at 114 positions across the CCD, using a similar distribution as used in Paper I. The behavior of these velocities is very similar to what is shown in Figure 16 of Paper I. We therefore adopted the same empirical correction described in Paper I, which was designed to give the expected NGC 7293 radial velocity (20 km s-1) irrespective of the position on the CCD. The result of applying the correction is shown in Figure 11. Our calibration gives velocities with errors below 20 km s-1.
For NGC 1344, if we add quadratically the calibration errors and the errors from image registration (§3), we get errors of about 30 km s-1. There is still another source of errors: spectrograph deformations and guiding problems during long exposures. The only way of testing the impact of these kind of errors is to compare velocities obtained from different pairs of (undispersed, dispersed) long exposures. For this purpose, the redundancy between the N and S fields becomes useful. In Figure 12 we compare the velocities of 128 PNs measured in both fields. The standard deviation is 34 km s-1. Therefore spectrograph deformations and guiding errors have at most a marginal contribution to the total uncertainty in the velocities, which we conservatively estimate to be 40 km s-1. For the velocities of the 128 PNs measured twice, we adopted the average of N and S measurements.
We could measure the velocities of 195 of the 197 PN candidates in NGC 1344. Their velocities are in the range from 900 to 1500 km s-1. In addition to the 197 PN candidates, we also found one object with a velocity of 770 km s-1, which is too small. We have rejected it as a PN; it is most probably a background emission-line galaxy with a redshifted emission line shining through the on-band filter. We cannot exclude the existence of a few other background emission-line sources with the “right” velocity contaminating our PN sample, but the surface density of these background sources is too small to have any effect on our conclusions regarding the PN kinematics.
Figure 14 shows the (x, y) coordinates of the 195 PNs with respect to the center of light of NGC 1344. The position of this center can be measured with errors below 1 pixel. We have defined the x-axis along the major axis of NGC 1344. Figure 13 shows the velocities of the 195 PNs as a function of the x coordinate in arcsec, and Figure 15 shows the same 195 velocities as a function of the y coordinate. The average velocity of the 195 PNs is 1188 km s-1, in good agreement with the NED radial velocity of 1169 km s-1. Our NGC 1344 velocity from the PNs has an uncertainty of 15 km s-1 if we take into account a velocity dispersion of the order of 150 km s-1 (see next section), the number of PNs measured, and the possible systematic error of 10 km s-1 in our velocities from the calibration procedure using NGC 7293.
8 Rotation and line-of-sight velocity dispersion
We investigated rotation by dividing the 195 PNs into six subsamples along the x-axis and calculating the average velocity for each subsample. Because the signature of rotation can be diluted if the subsamples extend too much in the y direction, we restricted our selection to a small range of y values, that is, to within from the major axis. Figure 16 compares the resulting run of average PN velocity along the major axis with the information derived earlier from the long-slit spectra (Figures 3 and 1). The integrated absorption-line spectra indicate some rotation along the major axis (south receding), and indeed the rotation on the major axis appears to be a bit faster than away from the major axis. But the restriction to PNs close to the major axis produces numbers too small in each subsample, and therefore, large error bars. The PNs appear to be indicating the same sense of rotation as the integrated spectra, but with marginally lower amplitude. However, the error bars are too large to say much about rotation along the major axis beyond two effective radii from the PN velocities. In Figure 2 we also see some rotation along the minor axis (east approaching). The PNs cannot confirm this weak rotational signal (see Figure 15); the line-of-sight velocity dispersion is too large near the center.
To study the run of the line-of-sight velocity dispersion as a function of angular distance from the center, we divided the 195 PNs into five subsamples: one at the center of the galaxy and the other four in two pairs, north and south, progressively more distant from the center, to minimize the effect of rotation on the dispersions. The numbers of PNs within each zone are listed in the caption to Figure 17, where we show the resulting line-of-sight velocity dispersions, which have been corrected to compensate for the effect of measurement errors of 40 km s-1. We also show the velocity dispersions derived earlier from the long-slit spectra (Figures 1-3, and Tables 1-3). We have plotted both the major and minor axis absorption-line dispersion data in Figure 17, because their average is closer to the averaging in circular shells done for the PNs. We find marginal agreement, within error bars, between PN and absorption-line data within of the galaxy’s center. Outside, the last few dispersions from absorption-line data are very high, but considering the spread in dispersions from absorption-line data at different positions, we again find marginal agreement with the PN data.
We first tried to fit the run of line-of-sight velocity dispersion with distance from the center of NGC 1344 using an analytical model proposed by Hernquist (1990). This model is spherical, nonrotating, and isotropic, and it assumes a constant mass-to-light ratio. It worked very well in the case of NGC 4697 (Paper I). Figure 17 shows that this model fails for NGC 1344. The fit at the center was obtained by adopting a total mass of 1.5 x 10¹¹ and an effective radius = , which is equivalent to 4.2 kpc for the distance modulus = 31.38. The observed dispersion lies consistently above the Hernquist model beyond 3 , giving evidence of a dark matter halo around NGC 1344. To model this dark matter halo, we adopted a two-component Hernquist mass distribution (Hui et al. 1995, Eq. 8):
| (3) |
where and are the visible and dark matter total masses, and and are the corresponding scale lengths. Given the corresponding density and potential, we computed the projected velocity dispersion as a function of distance from the center using a code that numerically integrates the Jeans equation and expands the resulting three-dimensional and projected dispersions in Chebyshev polynomials. The two-component Hernquist model successfully fits the observed line-of-sight velocity dispersion, as shown in Figure 17, if we adopt the following parameters: , , and (note that in the Hernquist model, ). We do not attribute a lot of significance to the numerical values of these parameters; we are content with the implication that there seems to be a dark matter halo in the outskirts of NGC 1344, in interesting contrast to the evidence in other galaxies like NGC 4697.
There is a caveat in that we are using a spherically symmetric model to study a galaxy that is obviously flattened. So let us briefly discuss what is the effect of using a spherical Hernquist model for this flattened galaxy. NGC 1344 is E5, probably quite edge-on, probably triaxial from the minor axis rotation in Figure 2. The major and minor axes of the triaxial distribution are likely to be nearly in the plane of the sky. In this case, edge-on oblate models fitting the projected major axis line-of-sight motions will slightly underestimate the kinetic energy in the equatorial plane, thus giving a useful lower limit to the enclosed mass. Figure 8 of Dehnen & Gerhard (1994) shows that spherical and flattened isotropic oblate models of the same cuspy mass distribution have very similar shapes in their velocity dispersion profiles on the major and minor axes. For these isotropic rotators, most of the extra gravity in the flattened distribution of the same mass goes into rotation. In addition, the gravitational potential of a flattened Hernquist profile at is only mildly non-spherical. This suggests that fitting a spherical model to the velocity dispersion profile shape is a reasonable approximation, and that the discrepancy of the PN velocities at from this profile is significant.
We also need to discuss the possibility of some degree of tangential anisotropy in the stellar orbital distribution; an excess of tangential motions could work in the same sense as a dark matter halo to produce an excess of line-of-sight velocity dispersion in the galaxy outskirts. However, in Figure 18, a graph of the number of PNs as a function of velocity does not show the flat-topped distribution we could expect from a substantial excess of tangential orbits at large angular distances from the center (see, e.g., Figure 10 in Dehnen & Gerhard 1993). This suggests that anisotropy effects, if present, do not affect our qualitative conclusion about dark matter around this galaxy.
Using our estimate of the visible mass, we can estimate the ratio in blue light. Knowing the extinction-corrected =11.14, the distance modulus 31.4, and the solar absolute magnitude 5.48, we obtain for NGC 1344 a blue luminosity of 2 solar luminosities, which gives =7.
As we collect more information, some degree of variety in the amount and/or distribution of dark matter appears to be emerging. Gerhard et al. (2001) have reported a spread in the luminous-to-dark matter ratio in giant ellipticals, showing that some galaxies have no indication of dark matter within 2 , while others do have. We seem to be finding a similar situation in less luminous ellipticals like NGC 4697 and NGC 1344. Better modeling of the data set that takes into account the flattening of the galaxy and the stellar orbital distribution will be needed to more properly assess this conclusion. In a future paper, we expect to apply triaxial models, currently in preparation, to this problem.
We will need data for many other elliptical galaxies before a clearer picture can be formed. Fortunately, the PN families in the outskirts of elliptical galaxies look very promising as a source of important and unique kinematic information.
9 Summary of conclusions
We have detected 197 PNs in NGC 1344, and have measured their brightnesses and radial velocities. We also measured stellar kinematics from long-slit integrated spectra along the major and minor axes, and parallel to the major axis of NGC 1344.
The [O iii] 5007 PNLF permits us to estimate a distance modulus , in good agreement with, but slightly smaller than the surface brightness fluctuation distance of Tonry et al. (2001). We also obtain a rather typical PN formation rate of PNs yr. The slitless PN radial velocities do not permit us to set any strong constraint on the rotation of NGC 1344, but the behavior of the line-of-sight velocity dispersion as a function of distance from the center of the galaxy gives evidence of the existence of a dark matter halo around this galaxy.
This work was supported by the National Science Foundation (USA) under Grant No. 0307489. We thank M. Colless, who performed the Siding Spring long-slit observations presented in § 2. RPS and AR acknowledge support by the DFG grant SBF 375, and OEG by grant 200020-101766 from the Swiss National Science Foundation. We thank the anonymous referee for some useful suggestions.
References
- (1) Alard, C., & Lupton, R.H. 1998, ApJ, 503, 325
- (2) Bender, R., Saglia, R.P., & Gerhard, O.E. 1994, MNRAS, 269, 785
- (3) Ciardullo, R., Feldmeier, J.J., Jacoby, G.H. et al. 2002, ApJ, 577, 31
- (4) Dehnen, W., & Gerhard, O.E. 1993, MNRAS, 261, 311
- (5) Dehnen, W., & Gerhard, O.E. 1994, MNRAS, 268, 1019
- (6) de Vaucouleurs, G. et al. 1991, Third Reference Catalogue of Bright Galaxies (New York: Springer)
- (7) Gerhard, O., Kronawitter, A., Saglia, R., & Bender, R. 2001, AJ, 121, 1936
- (8) Gössl, C.A., & Riffeser, A. 2002, A&A, 381, 1095
- (9) Hernquist, L. 1990, ApJ, 356, 359
- (10) Hui, X., Ford, H.C., Freeman, K.C., & Dopita, M.A. 1995, ApJ., 449, 592
- (11) Jacoby, G.H. 1989, ApJ, 339, 39
- (12) Jacoby, G.H., Ciardullo, R., & Ford, H.C. 1990, ApJ, 356, 332
- (13) Jacoby, G.H., Quigley, R.J., & Africano, J.L. 1987, PASP, 99, 672
- (14) Kleyna, J., Wilkinson, M.I., Evans, N.W., Gilmore, G., & Frayn, C. 2002, MNRAS, 330, 792
- (15) Loewenstein, M., & White, R. E. 1999, ApJ, 518, 50
- (16) Malin, D.F., & Carter, D. 1980, Nature, 285, 643
- (17) McMillan, R., Ciardullo, R., & Jacoby, G.H. 1993, ApJ, 416, 62
- (18) Mehlert, D., Saglia, R.P., Bender, R., & Wegner, G. 2000, A&AS, 141, 449
- (19) Méndez, R.H. 1999, in Post-Hipparcos Cosmic Candles, ed. A. Heck & F. Caputo (Dordrecht: Kluwer), 161
- (20) Méndez, R.H., Riffeser, A., Kudritzki, R.P., et al. 2001, ApJ, 563, 135
- (21) Méndez, R.H., & Soffner, T. 1997, A&A, 321, 898
- (22) Milgrom, M., & Sanders, R.H. 2003, ApJ, 599, L25
- (23) Oke, J.B. 1990, AJ, 99, 1621
- (24) Rodgers, A.W., Conroy, P., & Bloxham, G. 1988, PASP, 100, 626
- (25) Romanowsky, A.J., Douglas, N.G., Arnaboldi, M., et al. 2003, Science, 301, 1696
- (26) Saglia, R.P., Maraston, C., Thomas, D., Bender, R., & Colless, M. 2002, ApJ, 579, L13
- (27) Schlegel, D.J., Finkbeiner, D.P., & Davis, M. 1998, ApJ, 500, 525
- (28) Stetson, P.B. 1987, PASP, 99, 191
- (29) Thomas, J., Saglia, R.P., Bender, R. et al. 2005, MNRAS, 360, 1355
- (30) Tonry, J.L., Dressler, A., Blakeslee, J.P. et al. 2001, ApJ, 546, 681


| R | V | dV | ||||||
|---|---|---|---|---|---|---|---|---|
| -0.400 | 0.978 | 2.99 | 165.2 | 3.49 | 0.006 | 0.014 | -0.045 | 0.013 |
| -1.309 | -0.702 | 3.39 | 173.0 | 3.97 | 0.027 | 0.016 | -0.02 | 0.014 |
| -2.220 | -7.532 | 2.50 | 153.1 | 2.94 | 0.002 | 0.013 | -0.044 | 0.015 |
| -3.129 | -11.640 | 2.91 | 159.9 | 3.20 | 0.000 | 0.014 | -0.061 | 0.016 |
| -4.040 | -7.282 | 3.16 | 165.3 | 3.61 | 0.028 | 0.016 | -0.039 | 0.016 |
| -5.368 | -20.750 | 2.23 | 156.7 | 2.88 | 0.067 | 0.013 | -0.032 | 0.014 |
| -7.191 | -27.110 | 2.98 | 159.4 | 3.64 | 0.041 | 0.019 | -0.027 | 0.013 |
| -9.429 | -36.190 | 3.52 | 158.3 | 4.01 | 0.068 | 0.024 | -0.048 | 0.016 |
| -12.580 | -56.310 | 4.11 | 151.3 | 3.70 | 0.061 | 0.02 | -0.049 | 0.022 |
| -16.660 | -69.750 | 5.28 | 161.9 | 6.18 | 0.071 | 0.022 | 0.002 | 0.019 |
| -22.060 | -61.030 | 6.11 | 161.8 | 5.36 | 0.036 | 0.026 | -0.056 | 0.026 |
| -29.620 | -89.040 | 6.07 | 161.3 | 5.53 | 0.001 | 0.032 | -0.086 | 0.021 |
| -41.740 | -83.400 | 7.35 | 150.0 | 4.96 | 0.110 | 0.044 | -0.192 | 0.037 |
| 0.511 | 7.658 | 3.21 | 162.4 | 4.00 | -0.001 | 0.015 | -0.036 | 0.014 |
| 1.420 | 4.658 | 3.19 | 172.6 | 3.53 | 0.021 | 0.016 | -0.036 | 0.014 |
| 2.330 | 16.530 | 3.78 | 168.2 | 3.47 | -0.011 | 0.012 | -0.053 | 0.014 |
| 3.240 | 17.490 | 4.27 | 173.9 | 3.87 | -0.002 | 0.013 | -0.03 | 0.014 |
| 4.150 | 21.920 | 3.94 | 165.9 | 4.32 | -0.01 | 0.012 | -0.009 | 0.013 |
| 5.061 | 14.060 | 4.70 | 165.7 | 4.93 | -0.025 | 0.014 | -0.023 | 0.016 |
| 6.398 | 32.820 | 3.91 | 159.9 | 2.81 | -0.031 | 0.013 | -0.044 | 0.019 |
| 8.213 | 32.320 | 3.62 | 157.1 | 2.40 | -0.044 | 0.014 | -0.074 | 0.018 |
| 10.030 | 46.720 | 4.70 | 159.5 | 3.33 | -0.038 | 0.015 | -0.057 | 0.021 |
| 12.270 | 39.470 | 4.64 | 156.1 | 3.50 | -0.071 | 0.019 | -0.041 | 0.023 |
| 15.430 | 57.620 | 4.42 | 157.4 | 4.71 | -0.037 | 0.019 | -0.037 | 0.022 |
| 19.920 | 61.450 | 4.57 | 145.1 | 4.84 | -0.068 | 0.023 | -0.017 | 0.024 |
| 26.230 | 67.880 | 5.25 | 156.2 | 5.10 | -0.01 | 0.022 | -0.082 | 0.028 |
| 35.120 | 103.600 | 6.52 | 147.2 | 5.50 | -0.035 | 0.027 | -0.011 | 0.024 |
| 49.630 | 100.800 | 8.72 | 130.6 | 7.56 | -0.071 | 0.037 | -0.021 | 0.031 |
| 65.910 | 76.820 | 20.19 | 171.2 | 13.00 | 0.031 | 0.081 | -0.244 | 0.061 |
| R | V | dV | ||||||
|---|---|---|---|---|---|---|---|---|
| -0.012 | 1.436 | 0.99 | 183.9 | 1.05 | 0.003 | 0.004 | -0.001 | 0.004 |
| -0.212 | 0.506 | 1.02 | 182.7 | 1.06 | 0.012 | 0.004 | -0.012 | 0.004 |
| -0.412 | 0.436 | 1.01 | 180.4 | 1.06 | 0.028 | 0.004 | -0.012 | 0.004 |
| -0.612 | -1.784 | 0.95 | 172.6 | 1.02 | 0.015 | 0.004 | -0.003 | 0.003 |
| -0.812 | 0.686 | 1.00 | 175.3 | 1.07 | -0.002 | 0.004 | -0.004 | 0.004 |
| -1.012 | -0.674 | 1.10 | 173.4 | 1.21 | 0.001 | 0.005 | 0.005 | 0.004 |
| -1.212 | -3.924 | 1.06 | 168.9 | 1.14 | -0.001 | 0.005 | -0.012 | 0.004 |
| -1.507 | -0.314 | 0.79 | 166.9 | 0.89 | 0.010 | 0.003 | 0.010 | 0.003 |
| -1.907 | 2.036 | 0.89 | 161.2 | 1.04 | 0.020 | 0.004 | 0.025 | 0.004 |
| -2.307 | 2.256 | 0.99 | 159.9 | 1.13 | -0.003 | 0.005 | 0.013 | 0.004 |
| -2.708 | 4.006 | 1.07 | 160.9 | 1.23 | 0.004 | 0.005 | 0.020 | 0.005 |
| -3.202 | 1.936 | 0.99 | 157.6 | 1.15 | -0.027 | 0.005 | 0.020 | 0.004 |
| -3.803 | 2.326 | 1.10 | 152.8 | 1.29 | -0.025 | 0.006 | 0.023 | 0.005 |
| -4.499 | 1.536 | 1.13 | 161.9 | 1.39 | 0.006 | 0.005 | 0.039 | 0.006 |
| -5.394 | 2.466 | 1.07 | 163.9 | 1.22 | 0.017 | 0.005 | 0.009 | 0.004 |
| -6.489 | 1.216 | 1.15 | 168.3 | 1.25 | 0.014 | 0.005 | -0.006 | 0.004 |
| -7.784 | 5.576 | 1.30 | 163.6 | 1.43 | 0.011 | 0.006 | -0.008 | 0.005 |
| -9.376 | -0.894 | 1.27 | 167.6 | 1.31 | -0.015 | 0.006 | -0.032 | 0.005 |
| -11.450 | 7.366 | 1.13 | 155.6 | 1.26 | 0.017 | 0.006 | -0.010 | 0.004 |
| -14.230 | 1.326 | 1.24 | 149.2 | 1.40 | -0.004 | 0.006 | -0.011 | 0.005 |
| -17.950 | 2.576 | 1.40 | 156.8 | 1.58 | -0.009 | 0.006 | 0.005 | 0.005 |
| -23.510 | 10.480 | 1.46 | 143.7 | 1.63 | -0.001 | 0.008 | -0.017 | 0.006 |
| -33.500 | 11.440 | 1.62 | 131.3 | 1.81 | 0.022 | 0.009 | -0.026 | 0.008 |
| -47.750 | 8.476 | 3.54 | 128.5 | 3.75 | 0.055 | 0.02 | -0.047 | 0.015 |
| 0.188 | -1.494 | 0.97 | 181.6 | 1.00 | 0.008 | 0.004 | -0.011 | 0.004 |
| 0.388 | 0.756 | 0.97 | 183.4 | 1.00 | 0.007 | 0.004 | -0.012 | 0.004 |
| 0.588 | -0.394 | 0.91 | 176.3 | 0.99 | 0.008 | 0.004 | 0.000 | 0.003 |
| 0.788 | -1.714 | 0.98 | 173.4 | 1.09 | 0.006 | 0.004 | 0.007 | 0.004 |
| 0.988 | 0.326 | 1.05 | 172.5 | 1.15 | 0.008 | 0.004 | 0.001 | 0.004 |
| 1.188 | -1.424 | 1.10 | 171.6 | 1.24 | -0.004 | 0.005 | 0.020 | 0.004 |
| 1.483 | 2.506 | 0.78 | 165.8 | 0.88 | -0.001 | 0.004 | 0.006 | 0.003 |
| 1.884 | 0.786 | 0.94 | 163.5 | 1.05 | -0.009 | 0.004 | -0.001 | 0.004 |
| 2.284 | -0.464 | 1.01 | 162.9 | 1.14 | -0.013 | 0.005 | 0.002 | 0.004 |
| 2.684 | -4.284 | 1.14 | 163.6 | 1.29 | 0.002 | 0.005 | 0.006 | 0.004 |
| 3.178 | -5.144 | 1.00 | 164.8 | 1.13 | 0.008 | 0.004 | 0.005 | 0.004 |
| 3.780 | -1.464 | 1.10 | 157.8 | 1.26 | 0.011 | 0.005 | 0.017 | 0.005 |
| 4.474 | -1.314 | 1.07 | 159.4 | 1.23 | -0.004 | 0.005 | 0.019 | 0.005 |
| 5.371 | 0.936 | 1.10 | 162.9 | 1.27 | -0.020 | 0.005 | 0.020 | 0.005 |
| 6.466 | -5.574 | 1.21 | 165.6 | 1.37 | 0.007 | 0.005 | 0.006 | 0.004 |
| 7.762 | 14.200 | 1.26 | 168.6 | 1.36 | 0.005 | 0.005 | -0.011 | 0.004 |
| 9.351 | 3.216 | 1.25 | 163.2 | 1.36 | 0.044 | 0.006 | -0.016 | 0.005 |
| 11.430 | -4.324 | 1.24 | 157.1 | 1.37 | 0.015 | 0.006 | -0.010 | 0.005 |
| 14.200 | -5.254 | 1.34 | 147.3 | 1.54 | -0.011 | 0.007 | 0.000 | 0.006 |
| 18.020 | -17.180 | 0.89 | 150.3 | 1.18 | 0.017 | 0.008 | -0.029 | 0.005 |
| 23.910 | -17.290 | 1.05 | 139.2 | 1.34 | -0.030 | 0.009 | -0.020 | 0.005 |
| 35.450 | -12.790 | 1.92 | 135.3 | 2.22 | 0.021 | 0.01 | -0.002 | 0.009 |
| 57.330 | -3.104 | 4.70 | 127.7 | 3.65 | -0.017 | 0.029 | -0.205 | 0.029 |
| R | D | V | dV | ||||||
|---|---|---|---|---|---|---|---|---|---|
| -2.156 | 16.64 | -9.461 | 0.96 | 151.8 | 1.32 | 0.032 | 0.008 | -0.022 | 0.005 |
| -6.843 | 17.86 | -16.610 | 1.01 | 160.3 | 1.37 | 0.020 | 0.008 | -0.001 | 0.005 |
| -11.810 | 20.29 | -25.800 | 1.18 | 152.9 | 1.59 | 0.049 | 0.008 | -0.015 | 0.006 |
| -17.370 | 23.96 | -41.060 | 1.15 | 147.6 | 1.52 | 0.015 | 0.008 | -0.030 | 0.006 |
| -24.000 | 29.13 | -55.140 | 1.14 | 143.4 | 1.16 | 0.056 | 0.008 | -0.030 | 0.007 |
| -32.640 | 36.57 | -65.040 | 1.17 | 131.3 | 1.29 | 0.030 | 0.008 | -0.011 | 0.007 |
| -45.500 | 48.40 | -81.830 | 1.46 | 129.7 | 1.6 | 0.097 | 0.011 | 0.025 | 0.009 |
| -76.360 | 78.13 | -73.470 | 3.18 | 148.6 | 3.53 | 0.053 | 0.018 | -0.026 | 0.015 |
| 2.425 | 16.68 | 9.869 | 1.45 | 154.3 | 1.6 | -0.015 | 0.007 | -0.015 | 0.005 |
| 7.192 | 18.00 | 19.450 | 1.40 | 146.0 | 1.57 | 0.004 | 0.007 | -0.007 | 0.006 |
| 12.470 | 20.68 | 37.890 | 1.35 | 146.8 | 1.51 | -0.017 | 0.007 | -0.011 | 0.006 |
| 18.540 | 24.82 | 47.860 | 1.58 | 156.6 | 1.66 | -0.017 | 0.008 | -0.013 | 0.006 |
| 25.980 | 30.77 | 48.400 | 1.62 | 146.5 | 1.78 | -0.016 | 0.008 | 0.001 | 0.006 |
| 36.630 | 40.18 | 71.950 | 1.21 | 145.4 | 2.1 | -0.013 | 0.008 | -0.023 | 0.008 |
| 57.020 | 59.36 | 69.590 | 2.87 | 150.9 | 2.86 | 0.028 | 0.014 | -0.037 | 0.01 |
| 89.850 | 91.35 | 63.410 | 5.77 | 153.8 | 4.98 | 0.066 | 0.028 | -0.117 | 0.019 |
| Field | Config | FORS1 CCD frame identification | exp (s) | Air massaaThe air masses correspond to the middle of each exposure. |
|---|---|---|---|---|
| LTT 9491 | on-band | FORS1.2001-09-22T04:05:22:194.fits | 30 | 1.01 |
| NGC 7293 p1 | on-band | FORS1.2001-09-22T04:27:47:215.fits | 100 | 1.05 |
| NGC 7293 p1 | grism+on | FORS1.2001-09-22T04:32:04:729.fits | 250 | 1.05 |
| NGC 7293 p2 | on-band | FORS1.2001-09-22T04:48:42:887.fits | 100 | 1.09 |
| NGC 7293 p2 | grism+on | FORS1.2001-09-22T04:53:28:250.fits | 250 | 1.10 |
| NGC 7293 p3 | on-band | FORS1.2001-09-22T05:04:43:352.fits | 100 | 1.12 |
| NGC 7293 p3 | grism+on | FORS1.2001-09-22T05:08:52:999.fits | 250 | 1.13 |
| NGC 7293 p4 | on-band | FORS1.2001-09-22T05:20:03:180.fits | 100 | 1.16 |
| NGC 7293 p4 | grism+on | FORS1.2001-09-22T05:24:04:002.fits | 250 | 1.18 |
| NGC 7293 p5 | on-band | FORS1.2001-09-22T05:35:00:380.fits | 100 | 1.20 |
| NGC 7293 p5 | grism+on | FORS1.2001-09-22T05:40:37:185.fits | 250 | 1.23 |
| NGC 7293 p6 | on-band | FORS1.2001-09-22T05:52:04:241.fits | 100 | 1.27 |
| NGC 7293 p6 | grism+on | FORS1.2001-09-22T05:56:25:585.fits | 250 | 1.29 |
| NGC 1344 S | off-band | FORS1.2001-09-22T06:17:30:081.fits | 900 | 1.1 |
| NGC 1344 S | on-band | FORS1.2001-09-22T06:41:51:834.fits | 1500 | 1.06 |
| NGC 1344 S | grism+on | FORS1.2001-09-22T07:08:58:932.fits | 2400 | 1.03 |
| NGC 1344 S | off-band | FORS1.2001-09-22T07:55:35:179.fits | 900 | 1.01 |
| NGC 1344 S | on-band | FORS1.2001-09-22T08:17:36:345.fits | 1500 | 1.01 |
| NGC 1344 S | grism+on | FORS1.2001-09-22T08:44:51:873.fits | 1827 | 1.02 |
| MOS cal. p1 | disp. | FORS1.2001-09-22T14:08:49:563.fits | 300 | |
| MOS cal. p1 | undisp. | FORS1.2001-09-22T14:17:03:080.fits | 10 | |
| MOS cal. p2 | disp. | FORS1.2001-09-22T14:52:19:858.fits | 300 | |
| MOS cal. p2 | undisp. | FORS1.2001-09-22T15:00:33:521.fits | 10 | |
| MOS cal. p3 | disp. | FORS1.2001-09-22T15:38:12:124.fits | 300 | |
| MOS cal. p3 | undisp. | FORS1.2001-09-22T15:46:25:584.fits | 10 | |
| MOS cal. p4 | disp. | FORS1.2001-09-22T16:23:22:833.fits | 300 | |
| MOS cal. p4 | undisp. | FORS1.2001-09-22T16:31:36:609.fits | 10 | |
| MOS cal. p5 | disp. | FORS1.2001-09-22T17:06:49:582.fits | 300 | |
| MOS cal. p5 | undisp. | FORS1.2001-09-22T17:15:03:150.fits | 10 | |
| MOS cal. p6 | disp. | FORS1.2001-09-22T18:13:33:890.fits | 300 | |
| MOS cal. p6 | undisp. | FORS1.2001-09-22T18:21:47:136.fits | 10 | |
| MOS cal. p7 | disp. | FORS1.2001-09-22T18:59:11:971.fits | 300 | |
| MOS cal. p7 | undisp. | FORS1.2001-09-22T19:07:24:599.fits | 10 | |
| MOS cal. p8 | disp. | FORS1.2001-09-22T19:43:11:971.fits | 300 | |
| MOS cal. p8 | undisp. | FORS1.2001-09-22T19:51:25:471.fits | 10 | |
| MOS cal. p9 | disp. | FORS1.2001-09-22T20:26:26:536.fits | 300 | |
| MOS cal. p9 | undisp. | FORS1.2001-09-22T20:34:40:031.fits | 10 | |
| NGC 1344 S | off-band | FORS1.2001-09-23T04:26:37:276.fits | 900 | 1.48 |
| NGC 1344 S | on-band | FORS1.2001-09-23T04:47:53:785.fits | 1500 | 1.36 |
| NGC 1344 S | grism+on | FORS1.2001-09-23T05:15:01:342.fits | 2400 | 1.25 |
| NGC 1344 N | off-band | FORS1.2001-09-23T06:02:09:802.fits | 900 | 1.12 |
| NGC 1344 N | on-band | FORS1.2001-09-23T06:24:03:346.fits | 1500 | 1.08 |
| NGC 1344 N | grism+on | FORS1.2001-09-23T06:51:11:402.fits | 2400 | 1.04 |
| NGC 1344 N | off-band | FORS1.2001-09-23T07:38:42:634.fits | 900 | 1.01 |
| NGC 1344 N | on-band | FORS1.2001-09-23T08:02:08:717.fits | 1500 | 1.01 |
| NGC 1344 N | grism+on | FORS1.2001-09-23T08:29:25:128.fits | 2400 | 1.01 |
| MOS cal. p10 | disp. | FORS1.2001-09-23T14:03:18:215.fits | 300 | |
| MOS cal. p10 | undisp. | FORS1.2001-09-23T14:11:31:684.fits | 10 | |
| LTT 9491 | on-band | FORS1.2001-09-24T04:06:24:483.fits | 30 | 1.01 |
| NGC 1344 S | off-band | FORS1.2001-09-24T04:27:23:025.fits | 900 | 1.45 |
| NGC 1344 S | on-band | FORS1.2001-09-24T04:49:35:559.fits | 1500 | 1.34 |
| NGC 1344 S | grism+on | FORS1.2001-09-23T05:16:52:419.fits | 2400 | 1.23 |
| NGC 1344 N | off-band | FORS1.2001-09-24T06:03:08:777.fits | 900 | 1.11 |
| NGC 1344 N | on-band | FORS1.2001-09-24T06:25:31:046.fits | 1500 | 1.07 |
| NGC 1344 N | grism+on | FORS1.2001-09-24T06:52:47:665.fits | 2400 | 1.04 |
| NGC 1344 N | off-band | FORS1.2001-09-24T07:39:13:468.fits | 900 | 1.01 |
| NGC 1344 N | on-band | FORS1.2001-09-24T08:00:32:362.fits | 1500 | 1.01 |
| NGC 1344 N | grism+on | FORS1.2001-09-24T08:27:49:243.fits | 2400 | 1.01 |
| x,N | y,N | x,S | y,S | x,G | y,G | (2000) | (2000) | m(5007) | Helioc. RV | ||||
|---|---|---|---|---|---|---|---|---|---|---|---|---|---|
| 1772.260 | 1067.358 | 1729.156 | 2022.205 | -535.833 | -810.471 | 3 | 28 | 5.2512 | -31 | 3 | 3.5266 | 27.937 | 1020.311 |
| 1632.203 | 1466.408 | -919.991 | -635.988 | 3 | 28 | 6.3293 | -31 | 1 | 40.0443 | 28.370 | 1159.411 | ||
| 1732.279 | 839.470 | 1689.801 | 1793.004 | -304.701 | -790.873 | 3 | 28 | 6.4752 | -31 | 3 | 47.1973 | 27.564 | 1151.846 |
| 1675.807 | 996.393 | 1634.140 | 1948.803 | -455.580 | -721.392 | 3 | 28 | 6.9138 | -31 | 3 | 14.4031 | 28.350 | 1173.469 |
| 1581.728 | 1495.769 | -944.840 | -583.151 | 3 | 28 | 7.0245 | -31 | 1 | 32.5186 | 27.791 | 1292.323 | ||
| 1568.797 | 1466.721 | -914.774 | -572.802 | 3 | 28 | 7.3000 | -31 | 1 | 37.7783 | 27.896 | 1001.945 | ||
| 1577.605 | 2010.898 | -512.529 | -660.659 | 3 | 28 | 7.6005 | -31 | 3 | 0.3268 | 28.621 | |||
| 1494.271 | 1669.559 | -1110.346 | -480.877 | 3 | 28 | 7.8965 | -31 | 0 | 55.1857 | 27.412 | 1231.241 | ||
| 1474.310 | 1525.730 | -965.324 | -473.528 | 3 | 28 | 8.5927 | -31 | 1 | 22.8712 | 27.224 | 1233.207 | ||
| 1451.916 | 1499.147 | -936.894 | -453.540 | 3 | 28 | 9.0072 | -31 | 1 | 27.3344 | 28.064 | 1075.390 | ||
| 1655.629 | 156.423 | 1610.347 | 1109.954 | 382.551 | -772.650 | 3 | 28 | 9.5162 | -31 | 5 | 59.2049 | 27.700 | 1093.308 |
| 1445.544 | 1203.287 | -641.604 | -472.970 | 3 | 28 | 9.9023 | -31 | 2 | 25.4384 | 27.901 | 1157.112 | ||
| 1482.401 | 626.818 | 1439.235 | 1580.290 | -71.019 | -560.140 | 3 | 28 | 10.8886 | -31 | 4 | 20.4240 | 27.865 | 1199.380 |
| 1450.042 | 700.912 | 1407.126 | 1654.197 | -141.928 | -521.579 | 3 | 28 | 11.1839 | -31 | 4 | 4.6930 | 27.754 | 1368.677 |
| 1537.370 | 206.778 | 1492.272 | 1160.932 | 342.377 | -650.516 | 3 | 28 | 11.1916 | -31 | 5 | 45.0943 | 27.866 | 1073.010 |
| 1406.876 | 808.542 | 1363.645 | 1762.050 | -245.484 | -469.030 | 3 | 28 | 11.5590 | -31 | 3 | 41.9376 | 27.439 | 1435.532 |
| 1327.086 | 1194.226 | -622.254 | -355.761 | 3 | 28 | 11.7452 | -31 | 2 | 23.0969 | 27.405 | 1398.835 | ||
| 1492.896 | 179.792 | 1449.194 | 1132.072 | 374.009 | -609.341 | 3 | 28 | 11.9401 | -31 | 5 | 49.0562 | 27.987 | 1234.882 |
| 1279.115 | 1383.261 | -806.383 | -291.488 | 3 | 28 | 11.9718 | -31 | 1 | 44.1504 | 27.447 | 1416.750 | ||
| 1336.050 | 923.200 | 1292.807 | 1875.584 | -352.972 | -388.523 | 3 | 28 | 12.3383 | -31 | 3 | 16.9917 | 27.438 | 1137.857 |
| 1182.850 | 1723.840 | -1137.278 | -165.911 | 3 | 28 | 12.5280 | -31 | 0 | 33.6594 | 27.734 | 1153.978 | ||
| 1216.906 | 1524.225 | -941.386 | -217.239 | 3 | 28 | 12.5443 | -31 | 1 | 14.1989 | 27.882 | 1318.683 | ||
| 1327.977 | 886.447 | 1283.499 | 1839.981 | -316.174 | -383.019 | 3 | 28 | 12.5684 | -31 | 3 | 23.8307 | 28.141 | 1378.188 |
| 1251.514 | 1174.306 | -595.823 | -282.204 | 3 | 28 | 12.9571 | -31 | 2 | 24.3947 | 27.695 | 1107.595 | ||
| 1222.528 | 1309.240 | -727.714 | -241.575 | 3 | 28 | 13.0387 | -31 | 1 | 56.7847 | 27.941 | 1420.634 | ||
| 1346.470 | 516.127 | 1302.970 | 1468.940 | 51.441 | -434.236 | 3 | 28 | 13.2772 | -31 | 4 | 37.5627 | 27.789 | 1251.879 |
| 1225.027 | 1193.297 | -612.433 | -254.170 | 3 | 28 | 13.3125 | -31 | 2 | 19.7530 | 28.306 | 1143.868 | ||
| 1334.318 | 535.238 | 1291.310 | 1487.350 | 33.790 | -420.740 | 3 | 28 | 13.4086 | -31 | 4 | 33.4566 | 27.458 | 1060.261 |
| 1195.220 | 1243.830 | -660.172 | -220.070 | 3 | 28 | 13.6343 | -31 | 2 | 8.7392 | 27.739 | 1171.125 | ||
| 1307.240 | 551.810 | 1263.258 | 1504.515 | 19.388 | -391.810 | 3 | 28 | 13.7880 | -31 | 4 | 29.1719 | 27.171 | 1169.060 |
| 1300.053 | 538.611 | 1256.637 | 1490.771 | 33.410 | -386.106 | 3 | 28 | 13.9295 | -31 | 4 | 31.5820 | 27.986 | 1193.068 |
| 1239.020 | 839.470 | -261.169 | -298.945 | 3 | 28 | 14.0540 | -31 | 3 | 29.9899 | 28.199 | 1329.094 | ||
| 1314.171 | 333.836 | 1270.505 | 1287.251 | 235.561 | -417.838 | 3 | 28 | 14.2660 | -31 | 5 | 12.3344 | 27.855 | 1033.992 |
| 1221.654 | 732.392 | 1178.050 | 1685.052 | -153.042 | -291.001 | 3 | 28 | 14.6093 | -31 | 3 | 50.5824 | 27.648 | 1430.127 |
| 1146.539 | 1128.379 | -540.919 | -181.637 | 3 | 28 | 14.6926 | -31 | 2 | 29.7986 | 27.186 | 1217.258 | ||
| 1260.400 | 423.824 | 1216.438 | 1377.827 | 150.322 | -356.256 | 3 | 28 | 14.8462 | -31 | 4 | 52.6414 | 27.693 | 1189.185 |
| 1103.586 | 1271.259 | -679.512 | -126.398 | 3 | 28 | 14.9664 | -31 | 2 | 0.1286 | 27.971 | 1355.132 | ||
| 1382.000 | 373.000 | 1136.185 | -608.551 | 3 | 28 | 15.0094 | -31 | 8 | 16.5477 | 28.548 | 1273.989 | ||
| 1149.584 | 948.411 | 1106.460 | 1901.321 | -362.103 | -200.606 | 3 | 28 | 15.1321 | -31 | 3 | 5.4698 | 27.628 | 1153.914 |
| 1057.609 | 1449.172 | -852.738 | -65.087 | 3 | 28 | 15.1921 | -31 | 1 | 23.4480 | 27.872 | 1218.677 | ||
| 1149.064 | 913.433 | 1106.338 | 1865.588 | -326.854 | -203.368 | 3 | 28 | 15.2307 | -31 | 3 | 12.4187 | 27.802 | 1272.135 |
| 1114.081 | 1074.355 | -484.266 | -154.010 | 3 | 28 | 15.3363 | -31 | 2 | 39.3361 | 28.136 | 1321.446 | ||
| 1204.960 | 528.929 | 1162.060 | 1482.319 | 50.708 | -292.422 | 3 | 28 | 15.4102 | -31 | 4 | 30.0714 | 27.401 | 1494.460 |
| 1231.899 | 363.259 | 1188.650 | 1316.010 | 213.733 | -333.552 | 3 | 28 | 15.4436 | -31 | 5 | 3.7308 | 27.733 | 1197.022 |
| 1122.577 | 896.442 | 1079.598 | 1850.976 | -308.793 | -178.233 | 3 | 28 | 15.6814 | -31 | 3 | 14.6159 | 28.088 | 1141.782 |
| 1160.184 | 681.417 | 1116.790 | 1633.952 | -96.850 | -234.318 | 3 | 28 | 15.6882 | -31 | 3 | 58.4995 | 27.468 | 1127.564 |
| 1046.614 | 1254.267 | -657.621 | -71.115 | 3 | 28 | 15.8857 | -31 | 2 | 1.5019 | 28.189 | 1040.462 | ||
| 1075.186 | 997.640 | 1031.834 | 1951.217 | -404.983 | -122.058 | 3 | 28 | 16.1397 | -31 | 2 | 53.0896 | 26.959 | 1361.660 |
| 1146.066 | 582.595 | 1103.000 | 1535.130 | 2.812 | -229.030 | 3 | 28 | 16.1689 | -31 | 4 | 17.5470 | 27.669 | 1248.618 |
| 1089.688 | 1431.980 | 106.711 | -225.057 | 3 | 28 | 16.6486 | -31 | 4 | 37.4872 | 27.766 | 1475.259 | ||
| 1053.000 | 925.500 | 1010.000 | 1878.600 | -330.961 | -106.440 | 3 | 28 | 16.6727 | -31 | 3 | 6.5890 | 27.229 | 1102.650 |
| 1102.462 | 540.615 | 1058.921 | 1494.332 | 47.865 | -188.962 | 3 | 28 | 16.9534 | -31 | 4 | 24.1319 | 28.072 | 1162.075 |
| 1070.703 | 718.529 | 1027.624 | 1672.063 | -126.533 | -142.056 | 3 | 28 | 16.9611 | -31 | 3 | 47.9869 | 27.891 | 1107.360 |
| 1051.112 | 802.488 | 1007.918 | 1754.601 | -207.753 | -115.227 | 3 | 28 | 17.0350 | -31 | 3 | 30.8894 | 27.078 | 1229.233 |
| 1102.587 | 505.632 | 1059.608 | 1459.167 | 82.770 | -192.424 | 3 | 28 | 17.0427 | -31 | 4 | 31.0808 | 27.526 | 1064.190 |
| 1146.441 | 941.540 | 590.339 | -324.336 | 3 | 28 | 17.0976 | -31 | 6 | 16.1993 | 27.815 | 1263.080 | ||
| 1083.346 | 561.975 | 1040.492 | 1514.760 | 28.686 | -168.440 | 3 | 28 | 17.1861 | -31 | 4 | 19.3803 | 27.407 | 1408.857 |
| 1050.050 | 748.951 | 1006.509 | 1701.299 | -154.429 | -118.652 | 3 | 28 | 17.1980 | -31 | 3 | 41.4020 | 27.849 | 1463.896 |
| 1147.065 | 189.787 | 1102.962 | 1141.947 | 394.270 | -263.760 | 3 | 28 | 17.2204 | -31 | 5 | 35.0143 | 27.681 | 1162.838 |
| 1284.873 | 77.850 | 1438.677 | -537.514 | 3 | 28 | 17.2941 | -31 | 9 | 11.3763 | 27.832 | 1169.158 | ||
| 985.144 | 1067.358 | 942.665 | 2019.893 | -466.107 | -26.762 | 3 | 28 | 17.3284 | -31 | 2 | 36.3148 | 27.734 | 1328.693 |
| 1112.119 | 347.472 | 1068.134 | 1300.150 | 239.968 | -215.240 | 3 | 28 | 17.3302 | -31 | 5 | 2.6527 | 27.201 | 1377.647 |
| 1025.624 | 825.476 | 982.816 | 1778.275 | -228.790 | -87.994 | 3 | 28 | 17.3593 | -31 | 3 | 25.3825 | 27.805 | 1274.882 |
| 990.142 | 1013.385 | 946.486 | 1967.297 | -413.409 | -35.799 | 3 | 28 | 17.4049 | -31 | 2 | 47.0059 | 27.381 | 987.100 |
| 984.145 | 1034.374 | 940.945 | 1988.016 | -433.681 | -28.235 | 3 | 28 | 17.4367 | -31 | 2 | 42.6869 | 27.481 | 1070.061 |
| 1073.516 | 513.931 | 1029.483 | 1466.333 | 77.646 | -162.264 | 3 | 28 | 17.4760 | -31 | 4 | 28.5608 | 27.040 | 1219.177 |
| 937.667 | 1262.263 | -656.085 | 38.110 | 3 | 28 | 17.5344 | -31 | 1 | 56.1392 | 27.504 | 1102.513 | ||
| 1012.630 | 1541.130 | 4.693 | -138.777 | 3 | 28 | 17.5388 | -31 | 4 | 13.2623 | 27.848 | 1060.297 | ||
| 1027.624 | 690.542 | 984.645 | 1643.077 | -94.405 | -101.673 | 3 | 28 | 17.6950 | -31 | 3 | 52.1274 | 27.668 | 1120.551 |
| 1020.127 | 719.428 | 976.648 | 1672.063 | -122.556 | -91.434 | 3 | 28 | 17.7354 | -31 | 3 | 46.1192 | 27.522 | 1141.971 |
| 1082.472 | 355.263 | 1038.743 | 1308.392 | 234.554 | -185.135 | 3 | 28 | 17.7619 | -31 | 5 | 0.0572 | 27.306 | 1198.642 |
| 998.638 | 827.475 | 956.033 | 1780.510 | -228.556 | -61.028 | 3 | 28 | 17.7697 | -31 | 3 | 24.0504 | 27.932 | 1130.850 |
| 981.695 | 904.442 | 938.283 | 1857.818 | -303.888 | -37.024 | 3 | 28 | 17.8271 | -31 | 3 | 8.2095 | 27.392 | 1259.208 |
| 998.138 | 807.485 | 954.659 | 1761.020 | -208.810 | -61.815 | 3 | 28 | 17.8349 | -31 | 3 | 27.9369 | 27.458 | 1095.085 |
| 990.642 | 835.471 | 947.850 | 1788.069 | -235.599 | -52.291 | 3 | 28 | 17.8727 | -31 | 3 | 22.2102 | 27.500 | 1052.846 |
| 1100.213 | 166.668 | 1057.609 | 1119.578 | 420.946 | -219.815 | 3 | 28 | 17.9902 | -31 | 5 | 37.9326 | 27.956 | 1134.524 |
| 1001.136 | 701.537 | 956.658 | 1655.071 | -103.482 | -73.538 | 3 | 28 | 18.0821 | -31 | 3 | 48.8864 | 27.467 | 1161.269 |
| 1056.359 | 383.187 | 1012.693 | 1336.000 | 209.167 | -156.733 | 3 | 28 | 18.0890 | -31 | 4 | 53.6852 | 27.138 | 1069.719 |
| 982.622 | 1503.491 | 44.805 | -112.164 | 3 | 28 | 18.1009 | -31 | 4 | 19.6687 | 26.610 | 1432.312 | ||
| 1032.621 | 504.633 | 989.642 | 1459.167 | 89.365 | -122.767 | 3 | 28 | 18.1173 | -31 | 4 | 28.7393 | 27.397 | 1266.754 |
| 980.053 | 800.926 | 935.950 | 1754.273 | -200.579 | -44.068 | 3 | 28 | 18.1344 | -31 | 3 | 28.5823 | 27.734 | 1080.764 |
| 1009.507 | 614.080 | 967.153 | 1567.114 | -16.931 | -90.579 | 3 | 28 | 18.1748 | -31 | 4 | 6.4920 | 27.257 | 1257.332 |
| 1000.637 | 657.558 | 957.658 | 1611.093 | -59.693 | -77.620 | 3 | 28 | 18.1970 | -31 | 3 | 57.5656 | 27.224 | 1162.000 |
| 981.928 | 742.383 | 938.983 | 1695.871 | -142.542 | -51.609 | 3 | 28 | 18.2546 | -31 | 3 | 40.2141 | 27.260 | 1099.567 |
| 949.662 | 917.431 | 906.433 | 1869.966 | -313.625 | -4.109 | 3 | 28 | 18.2829 | -31 | 3 | 4.6458 | 27.801 | 1411.818 |
| 1076.974 | 886.004 | 651.718 | -259.970 | 3 | 28 | 18.3121 | -31 | 6 | 24.7343 | 27.907 | 1328.860 | ||
| 982.707 | 702.034 | 939.666 | 1656.071 | -102.684 | -55.829 | 3 | 28 | 18.3549 | -31 | 3 | 48.1654 | 26.895 | 1285.089 |
| 952.910 | 860.959 | 908.994 | 1815.560 | -258.650 | -11.834 | 3 | 28 | 18.3885 | -31 | 3 | 15.6940 | 27.486 | 1065.086 |
| 1005.634 | 549.611 | 961.656 | 1502.146 | 47.950 | -91.552 | 3 | 28 | 18.4220 | -31 | 4 | 19.1263 | 27.502 | 1332.716 |
| 953.160 | 840.469 | 911.055 | 1793.379 | -237.497 | -14.845 | 3 | 28 | 18.4297 | -31 | 3 | 19.9100 | 27.948 | 1152.034 |
| 1012.100 | 489.090 | 968.870 | 1441.900 | 107.507 | -103.629 | 3 | 28 | 18.4769 | -31 | 4 | 31.2593 | 26.671 | 1289.706 |
| 1027.124 | 395.686 | 983.645 | 1349.221 | 198.896 | -126.581 | 3 | 28 | 18.4991 | -31 | 4 | 50.1627 | 27.530 | 1256.861 |
| 891.190 | 1152.317 | -542.513 | 74.828 | 3 | 28 | 18.5447 | -31 | 2 | 16.1893 | 28.200 | 1021.353 | ||
| 882.195 | 1196.295 | -585.541 | 87.622 | 3 | 28 | 18.5644 | -31 | 2 | 7.2217 | 28.188 | 1188.734 | ||
| 896.188 | 1095.345 | -486.185 | 64.883 | 3 | 28 | 18.6219 | -31 | 2 | 27.6013 | 27.959 | 1101.874 | ||
| 917.177 | 936.422 | 873.699 | 1889.957 | -330.200 | 30.075 | 3 | 28 | 18.7318 | -31 | 2 | 59.6745 | 27.814 | 1056.746 |
| 1017.004 | 298.109 | 973.650 | 1251.768 | 296.917 | -125.061 | 3 | 28 | 18.9164 | -31 | 5 | 9.0248 | 27.972 | 1034.785 |
| 761.066 | 1752.893 | -1129.456 | 256.800 | 3 | 28 | 18.9214 | -31 | 0 | 13.2454 | 27.457 | 1187.350 | ||
| 904.684 | 923.429 | 861.705 | 1876.963 | -316.189 | 41.140 | 3 | 28 | 18.9532 | -31 | 3 | 1.7619 | 27.968 | 1089.950 |
| 837.716 | 1294.247 | -679.242 | 140.468 | 3 | 28 | 18.9816 | -31 | 1 | 46.3408 | 28.084 | 1270.676 | ||
| 918.427 | 795.491 | 874.698 | 1748.026 | -189.405 | 16.628 | 3 | 28 | 19.0940 | -31 | 3 | 27.5729 | 28.119 | 1203.448 |
| 819.725 | 1341.225 | -724.465 | 162.485 | 3 | 28 | 19.1327 | -31 | 1 | 36.4462 | 27.984 | 1161.518 | ||
| 968.883 | 472.319 | 925.762 | 1424.985 | 128.048 | -62.099 | 3 | 28 | 19.1858 | -31 | 4 | 33.0927 | 26.685 | 1236.072 |
| 967.653 | 460.654 | 924.492 | 1414.246 | 139.316 | -61.830 | 3 | 28 | 19.2365 | -31 | 4 | 35.2556 | 27.216 | 1400.976 |
| 969.652 | 451.659 | 926.048 | 1404.314 | 148.589 | -64.426 | 3 | 28 | 19.2365 | -31 | 4 | 37.1645 | 27.484 | 1031.252 |
| 878.415 | 941.769 | 834.888 | 1894.368 | -331.680 | 69.139 | 3 | 28 | 19.3128 | -31 | 2 | 57.3331 | 27.431 | 1017.520 |
| 963.655 | 398.685 | 920.676 | 1350.220 | 202.415 | -63.428 | 3 | 28 | 19.4657 | -31 | 4 | 47.5328 | 27.684 | 929.716 |
| 971.151 | 299.733 | 927.110 | 1253.267 | 299.387 | -78.904 | 3 | 28 | 19.6227 | -31 | 5 | 7.0816 | 27.637 | 1015.795 |
| 879.508 | 805.798 | 834.843 | 1758.458 | -196.302 | 56.769 | 3 | 28 | 19.6699 | -31 | 3 | 24.1946 | 27.501 | 1185.988 |
| 957.158 | 358.704 | 913.331 | 1311.099 | 242.418 | -59.981 | 3 | 28 | 19.6777 | -31 | 4 | 55.0928 | 27.031 | 1367.070 |
| 1031.996 | 598.707 | 941.841 | -240.211 | 3 | 28 | 19.7763 | -31 | 7 | 19.8102 | 27.370 | 1096.552 | ||
| 869.701 | 765.006 | 827.846 | 1714.292 | -153.253 | 61.437 | 3 | 28 | 19.9128 | -31 | 3 | 32.2559 | 27.724 | 1287.923 |
| 937.667 | 379.002 | 893.731 | 1332.318 | 223.442 | -38.701 | 3 | 28 | 19.9231 | -31 | 4 | 50.3069 | 26.969 | 1229.942 |
| 780.744 | 1250.514 | -630.703 | 193.411 | 3 | 28 | 19.9746 | -31 | 1 | 53.0013 | 27.784 | 1112.564 | ||
| 827.721 | 963.409 | 784.742 | 1917.193 | -349.433 | 121.305 | 3 | 28 | 20.0253 | -31 | 2 | 51.2151 | 28.073 | 1093.367 |
| 817.601 | 1722.720 | -159.208 | 71.336 | 3 | 28 | 20.0425 | -31 | 3 | 30.6697 | 27.148 | 1146.783 | ||
| 795.612 | 1091.966 | -474.062 | 164.782 | 3 | 28 | 20.1746 | -31 | 2 | 24.7929 | 27.323 | 1154.685 | ||
| 848.711 | 781.498 | 805.732 | 1736.032 | -170.417 | 84.573 | 3 | 28 | 20.1936 | -31 | 3 | 27.7171 | 27.845 | 1072.999 |
| 853.209 | 756.210 | 810.667 | 1708.728 | -144.633 | 77.583 | 3 | 28 | 20.1936 | -31 | 3 | 33.0867 | 27.591 | 977.496 |
| 955.721 | 156.178 | 912.090 | 1110.020 | 443.570 | -76.235 | 3 | 28 | 20.2416 | -31 | 5 | 34.8701 | 27.880 | 1313.959 |
| 716.900 | 1432.980 | -806.914 | 272.916 | 3 | 28 | 20.4622 | -31 | 1 | 14.7688 | 27.876 | 983.573 | ||
| 819.546 | 844.139 | 776.094 | 1796.564 | -229.207 | 119.230 | 3 | 28 | 20.4793 | -31 | 3 | 14.5816 | 27.407 | 1265.305 |
| 945.164 | 74.843 | 901.860 | 1027.700 | 525.992 | -73.013 | 3 | 28 | 20.6235 | -31 | 5 | 50.6012 | 27.547 | 1104.052 |
| 904.309 | 981.020 | 572.112 | -79.685 | 3 | 28 | 20.7076 | -31 | 5 | 59.9670 | 27.740 | 1432.033 | ||
| 677.870 | 1544.290 | -914.399 | 321.499 | 3 | 28 | 20.7600 | -31 | 0 | 51.4778 | 27.539 | 1005.213 | ||
| 812.703 | 730.273 | 768.295 | 1682.974 | -115.274 | 116.612 | 3 | 28 | 20.8974 | -31 | 3 | 36.7191 | 27.502 | 928.356 |
| 781.244 | 896.442 | 738.140 | 1849.159 | -278.133 | 161.785 | 3 | 28 | 20.9230 | -31 | 3 | 2.9155 | 27.491 | 924.570 |
| 851.709 | 481.644 | 808.855 | 1434.054 | 129.087 | 55.298 | 3 | 28 | 20.9565 | -31 | 4 | 27.1944 | 27.554 | 1080.868 |
| 810.230 | 691.542 | 766.751 | 1645.076 | -76.930 | 115.273 | 3 | 28 | 21.0313 | -31 | 3 | 44.2447 | 27.396 | 1166.348 |
| 886.068 | 959.094 | 595.544 | -63.424 | 3 | 28 | 21.0450 | -31 | 6 | 3.6749 | 28.160 | 1108.738 | ||
| 890.191 | 173.795 | 847.711 | 1128.328 | 431.337 | -9.962 | 3 | 28 | 21.1917 | -31 | 5 | 29.0405 | 27.833 | 1288.414 |
| 887.192 | 186.788 | 842.714 | 1139.323 | 419.737 | -4.934 | 3 | 28 | 21.2209 | -31 | 5 | 26.5205 | 28.200 | 1308.787 |
| 920.051 | 671.671 | 878.912 | -122.329 | 3 | 28 | 21.2981 | -31 | 7 | 1.5248 | 27.922 | 1047.020 | ||
| 791.864 | 665.929 | 747.885 | 1620.213 | -50.166 | 131.619 | 3 | 28 | 21.3865 | -31 | 3 | 48.5637 | 27.960 | 1076.886 |
| 777.290 | 744.960 | 734.250 | 1698.000 | -127.047 | 152.503 | 3 | 28 | 21.3883 | -31 | 3 | 32.6129 | 26.894 | 1106.965 |
| 875.307 | 848.722 | 706.434 | -62.324 | 3 | 28 | 21.5085 | -31 | 6 | 25.0571 | 27.352 | 1156.601 | ||
| 773.248 | 715.530 | 729.934 | 1668.561 | -97.360 | 154.101 | 3 | 28 | 21.5350 | -31 | 3 | 38.2709 | 27.635 | 1290.335 |
| 786.741 | 623.575 | 742.763 | 1577.109 | -7.153 | 132.997 | 3 | 28 | 21.5806 | -31 | 3 | 56.8103 | 27.004 | 1455.359 |
| 750.759 | 820.479 | 706.780 | 1775.013 | -200.669 | 186.048 | 3 | 28 | 21.6003 | -31 | 3 | 16.5935 | 27.721 | 1210.318 |
| 828.721 | 353.707 | 785.742 | 1307.742 | 257.736 | 67.181 | 3 | 28 | 21.6552 | -31 | 4 | 51.4536 | 27.739 | 1158.525 |
| 830.845 | 306.855 | 787.866 | 1260.764 | 304.288 | 60.976 | 3 | 28 | 21.7462 | -31 | 5 | 0.7782 | 28.120 | 1231.508 |
| 798.742 | 487.992 | 755.166 | 1440.623 | 127.301 | 108.986 | 3 | 28 | 21.7582 | -31 | 4 | 24.0633 | 27.040 | 999.652 |
| 810.604 | 415.172 | 766.751 | 1368.211 | 198.619 | 90.978 | 3 | 28 | 21.7728 | -31 | 4 | 38.7849 | 27.370 | 1078.912 |
| 713.277 | 932.424 | 670.798 | 1886.958 | -308.987 | 232.397 | 3 | 28 | 21.8621 | -31 | 2 | 53.2681 | 28.120 | 1040.566 |
| 735.128 | 806.846 | 691.444 | 1759.702 | -184.903 | 200.211 | 3 | 28 | 21.8758 | -31 | 3 | 18.9349 | 27.193 | 1091.364 |
| 826.722 | 280.742 | 782.743 | 1235.276 | 330.393 | 63.333 | 3 | 28 | 21.8904 | -31 | 5 | 5.6740 | 27.770 | 1443.496 |
| 673.297 | 1113.336 | -484.690 | 288.494 | 3 | 28 | 21.9934 | -31 | 2 | 16.2991 | 27.861 | 1218.460 | ||
| 693.287 | 972.405 | 650.807 | 1926.939 | -347.074 | 255.796 | 3 | 28 | 22.0603 | -31 | 2 | 44.6988 | 27.927 | 1093.884 |
| 794.062 | 392.035 | 750.949 | 1344.766 | 223.230 | 105.058 | 3 | 28 | 22.0844 | -31 | 4 | 42.8156 | 27.438 | 1105.837 |
| 731.304 | 743.657 | 688.134 | 1696.462 | -121.618 | 198.255 | 3 | 28 | 22.1015 | -31 | 3 | 31.2808 | 27.336 | 1197.023 |
| 685.087 | 913.304 | 641.538 | 1866.889 | -286.964 | 259.305 | 3 | 28 | 22.3565 | -31 | 2 | 56.1108 | 27.110 | 1276.030 |
| 705.531 | 781.868 | 661.427 | 1734.652 | -157.386 | 227.725 | 3 | 28 | 22.4019 | -31 | 3 | 22.8214 | 27.272 | 1332.696 |
| 751.883 | 428.670 | 708.284 | 1382.387 | 189.941 | 150.555 | 3 | 28 | 22.6362 | -31 | 4 | 34.0334 | 27.816 | 1382.757 |
| 789.865 | 211.646 | 746.280 | 1165.200 | 402.909 | 93.789 | 3 | 28 | 22.6362 | -31 | 5 | 18.1297 | 27.278 | 1120.990 |
| 689.788 | 717.529 | 646.809 | 1670.064 | -91.845 | 237.229 | 3 | 28 | 22.8078 | -31 | 3 | 35.0299 | 28.140 | 1530.368 |
| 637.002 | 960.098 | 592.961 | 1914.320 | -329.684 | 311.558 | 3 | 28 | 22.9710 | -31 | 2 | 45.1314 | 28.419 | 952.023 |
| 709.279 | 490.275 | 664.926 | 1433.050 | 137.767 | 198.265 | 3 | 28 | 23.1452 | -31 | 4 | 21.4677 | 27.605 | 1188.453 |
| 749.738 | 232.885 | 706.471 | 1186.695 | 385.107 | 135.467 | 3 | 28 | 23.1942 | -31 | 5 | 12.5542 | 27.588 | 906.704 |
| 754.132 | 172.852 | 711.028 | 1126.075 | 444.814 | 125.750 | 3 | 28 | 23.2894 | -31 | 5 | 24.5773 | 27.279 | 1112.274 |
| 705.899 | 423.095 | 662.432 | 1376.001 | 199.901 | 195.777 | 3 | 28 | 23.3572 | -31 | 4 | 33.6008 | 26.805 | 1018.503 |
| 711.872 | 386.392 | 667.723 | 1340.068 | 235.590 | 187.001 | 3 | 28 | 23.3693 | -31 | 4 | 40.9410 | 27.757 | 1190.921 |
| 768.251 | 61.849 | 724.000 | 1016.000 | 553.752 | 102.622 | 3 | 28 | 23.3778 | -31 | 5 | 46.8590 | 28.083 | 1240.303 |
| 733.010 | 149.082 | 689.809 | 1102.727 | 470.128 | 144.787 | 3 | 28 | 23.6783 | -31 | 5 | 28.4981 | 27.544 | 1051.541 |
| 704.904 | 150.281 | 661.052 | 1104.050 | 471.350 | 173.220 | 3 | 28 | 24.1074 | -31 | 5 | 27.2415 | 27.467 | 1220.241 |
| 587.994 | 800.827 | 544.734 | 1754.205 | -166.362 | 346.072 | 3 | 28 | 24.1460 | -31 | 3 | 14.9730 | 27.022 | 1062.077 |
| 434.413 | 1658.190 | -1006.647 | 573.956 | 3 | 28 | 24.1872 | -31 | 0 | 20.5582 | 27.566 | 1132.798 | ||
| 697.347 | 160.676 | 654.181 | 1114.580 | 461.556 | 181.319 | 3 | 28 | 24.1914 | -31 | 5 | 24.9687 | 27.641 | 1230.900 |
| 631.700 | 482.450 | 587.963 | 1436.048 | 146.906 | 275.031 | 3 | 28 | 24.3356 | -31 | 4 | 19.2361 | 27.811 | 1249.315 |
| 591.087 | 712.282 | 547.233 | 1665.686 | -78.410 | 335.571 | 3 | 28 | 24.3425 | -31 | 3 | 32.5099 | 28.028 | 1209.823 |
| 650.121 | 340.367 | 606.422 | 1293.471 | 287.087 | 244.257 | 3 | 28 | 24.4370 | -31 | 4 | 47.9654 | 26.723 | 1181.972 |
| 586.339 | 623.574 | 542.860 | 1577.109 | 10.292 | 332.388 | 3 | 28 | 24.6524 | -31 | 3 | 49.8271 | 27.822 | 1289.374 |
| 418.421 | 1553.121 | -900.583 | 580.730 | 3 | 28 | 24.7176 | -31 | 0 | 40.7181 | 28.550 | 1184.626 | ||
| 623.071 | 204.654 | 580.314 | 1158.505 | 424.228 | 258.939 | 3 | 28 | 25.2103 | -31 | 5 | 13.7009 | 27.499 | 1235.488 |
| 567.400 | 500.575 | 523.988 | 1453.824 | 134.613 | 340.489 | 3 | 28 | 25.2738 | -31 | 4 | 13.4409 | 26.909 | 1206.170 |
| 630.942 | 109.196 | 587.162 | 1063.230 | 518.590 | 243.296 | 3 | 28 | 25.3537 | -31 | 5 | 32.7827 | 27.861 | 1226.207 |
| 456.402 | 988.397 | 411.799 | 1942.306 | -341.955 | 494.203 | 3 | 28 | 25.6704 | -31 | 2 | 33.3211 | 28.358 | 1143.137 |
| 372.818 | 1089.035 | -434.290 | 585.712 | 3 | 28 | 26.6686 | -31 | 2 | 10.6412 | 27.929 | |||
| 455.153 | 460.400 | 411.549 | 1414.746 | 183.880 | 448.951 | 3 | 28 | 27.1062 | -31 | 4 | 17.3616 | 27.404 | 1421.923 |
| 566.000 | 504.000 | 1076.802 | 215.762 | 3 | 28 | 27.1818 | -31 | 7 | 22.2615 | 28.644 | 1237.231 | ||
| 473.020 | 272.616 | 429.900 | 1226.100 | 369.801 | 414.507 | 3 | 28 | 27.3338 | -31 | 4 | 55.0928 | 28.010 | 1016.542 |
| 450.000 | 896.000 | 696.404 | 365.485 | 3 | 28 | 27.9096 | -31 | 6 | 0.9009 | 28.419 | 1154.630 | ||
| 307.475 | 837.470 | -177.987 | 628.881 | 3 | 28 | 28.3509 | -31 | 2 | 57.9854 | 28.096 | 1224.732 | ||
| 371.319 | 300.670 | 328.540 | 1254.430 | 350.565 | 518.108 | 3 | 28 | 28.8144 | -31 | 4 | 45.9810 | 27.796 | 1316.018 |
| 83.584 | 1878.457 | -1195.502 | 942.648 | 3 | 28 | 28.9758 | -30 | 59 | 24.8987 | 27.619 | 1228.745 | ||
| 412.000 | 659.000 | 935.814 | 382.685 | 3 | 28 | 29.1311 | -31 | 6 | 46.2950 | 28.530 | 1322.551 | ||
| 374.000 | 791.000 | 807.628 | 432.045 | 3 | 28 | 29.3594 | -31 | 6 | 18.9391 | 28.786 | 1256.398 | ||
| 285.500 | 288.800 | 242.300 | 1243.516 | 369.412 | 602.818 | 3 | 28 | 30.1653 | -31 | 4 | 45.2669 | 27.441 | 1175.209 |
| 239.010 | 249.688 | 196.177 | 1204.631 | 412.298 | 645.549 | 3 | 28 | 30.9816 | -31 | 4 | 51.3506 | 28.233 | 1300.676 |
| 178.538 | 583.594 | 135.326 | 1537.811 | 85.311 | 735.050 | 3 | 28 | 31.0125 | -31 | 3 | 43.4550 | 27.660 | 1205.614 |
| 186.534 | 532.619 | 144.680 | 1489.280 | 134.119 | 722.071 | 3 | 28 | 31.0151 | -31 | 3 | 53.5693 | 28.410 | 1287.140 |
| 235.011 | 156.803 | 193.406 | 1111.212 | 505.390 | 640.802 | 3 | 28 | 31.2863 | -31 | 5 | 9.6016 | 27.989 | 1222.026 |
| 268.000 | 333.000 | 1273.124 | 497.724 | 3 | 28 | 32.2175 | -31 | 7 | 45.5869 | 28.777 | 1185.099 | ||
| 114.569 | 494.638 | 71.183 | 1448.102 | 179.886 | 791.076 | 3 | 28 | 32.2364 | -31 | 3 | 58.8222 | 27.617 | 991.783 |
| 192.000 | 702.000 | 912.152 | 605.595 | 3 | 28 | 32.3934 | -31 | 6 | 30.1657 | 28.768 | 1244.512 | ||
| 162.000 | 700.000 | 916.759 | 635.307 | 3 | 28 | 32.8587 | -31 | 6 | 29.5203 | 28.972 | 1382.567 | ||
| 90.081 | 725.525 | 897.599 | 709.177 | 3 | 28 | 33.8929 | -31 | 6 | 21.9603 | 28.977 | 909.292 | ||
| 51.000 | 526.000 | 1099.771 | 730.719 | 3 | 28 | 35.0311 | -31 | 6 | 59.9387 | 28.649 | 1169.014 |