PKS 1622-253: A Weakly Accreting, Powerful Gamma Ray Source
Abstract
In this Letter, we discuss new deep radio observations of PKS 1622-253 and their implications for the energetics of the central engine that powers this strong high energy gamma-ray source. Combining archival infrared and optical measurements with new millimeter observations, we show that even though the accretion flow in PKS 1622-253 is under-luminous by quasar standards, a powerful super-luminal jet is launched with a higher kinetic luminosity than most EGRET blazars. Only a few percent of the total jet kinetic luminosity is required to power even the most powerful gamma ray flares that are observed. The implication is that a high accretion system is not required to power the strongest high energy gamma ray sources.
1 Introduction
The connection between accretion flow parameters and the gamma-ray luminosity from an associated radio jet is not well understood. Quasars are distinguished by the strong thermal UV luminosity associated with their accretion flows and some in the blazar subcategory have been found to have strong apparent gamma-ray luminosities. Thus, it is of interest to understand why some of the stronger extragalactic EGRET-identified sources have accretion flow luminosities below those associated with quasars (such as the FRII BL-Lac, 0235+164, which has very weak optical emission in quiescent states, see Takalo et al (1998)). The discovery of a sizeable class of strong gamma-ray sources with accretion flow luminosities less than typical for quasars would suggest that accretion flow luminosity is, at best, a secondary (indirect) physical factor in the regulation of gamma-ray emission from jets.
Motivated by this possibility, a study of the not so well known EGRET source, PKS 1622253, was initiated. Before the EGRET observations this source was very rarely observed. However, it is one of the original EGRET detections and has been a firm identification in each of the three EGRET catalogs (Fichtel et al, 1994; Hartman et al, 1999). Part of the difficulty in observing this source is that it lies behind the dense cloud just south of Oph (Hunter et al, 1994). Hence, it is extremely faint in the optical (visual magnitude, in NED at z=0.786). Or primary findings are that only a small percentage of the jet kinetic luminosity is required to power the observed gamma ray luminosity and the accretion flow is under-luminous by quasar standards.

2 The Radio Observations
New observations of PKS 1622253 at 6 and 3.6 cm were made during June 03, 2002 with the VLA of the NRAO111The National Radio Astronomy Observatory is operated by Associated Universities Inc. under cooperative agreement with the National Science Foundation. in the BnA configuration. The data were reduced using the standard VLA procedures and were self-calibrated in phase and amplitude, as part of the imaging process. To obtain images at 6 and 3.6 cm of comparable angular resolution, the 6 cm image was made with the ROBUST parameter of IMAGR set to 5, while the 3.6 cm image was made with the ROBUST parameter of IMAGR set to 5 and tapered in the (u,v) plane to produce an angular resolution comparable to that of the 6 cm image. Finally, both images were restored with the same Gaussian beam. The morphology of the images were similar and we display the 6 cm radio map in Figure 1. To obtain the flux densities of the western and eastern lobes (indicated in Figure 1), we subtracted a point source with the flux density and position of the core (also indicated in Figure 1) from the (u,v) data. Parameters of the core and lobes measured from the data are listed in Table 1. The two point spectral index (calculated from 4.86 GHz to 8.4 GHz) of the core clearly identifies it as distinct from the characteristically steep spectrum lobes.
| Component | 19 cm | 6 cm | 3.6 cm | Spectral |
|---|---|---|---|---|
| (mJy) | (mJy) | (mJy) | Index | |
| Core | ||||
| West | ||||
| East |
To estimate the flux densities of the lobes at a lower frequency, we used VLA archive data taken at 1.56 GHz on 1991 October 13 in the A configuration. These results, shown also in Table 1, are not as reliable as those obtained at 6 and 3.6 cm since the lobes are only barely resolved from the core.
Some limited low frequency radio data are available. PKS 1622253 appears in the Molonglo Reference Catalog (Large et al, 1981) with a flux density of 2.36 Jy at 408 MHz and in the Texas Survey of Douglas et al (1996) with a flux density of 2.3520.047 Jy at 365 MHz. While the optically thin lobe emission cannot be distinguished from the core at 400 MHz, an extrapolation of the VLA data shows that 0.4 Jy of lobe emission is present at this frequency (assuming that the core had approximately the same strength when the Molonglo and Texas observations were made).
3 Estimating the Jet Kinetic Luminosity
These maps can be used to determine the kinetic luminosity of the jet from a measurement of an isotropic (not affected by relativistic beaming) parameter, the strength of lobe emission. We take this to be the measured data in Table 1. In a superluminal source, such as PKS 1622-253, one must be extra cautious about fluxes being greatly exaggerated by Doppler beaming, hence the need for an isotropic estimator such as optically thin lobe flux (Punsly, 2005). In order to avoid the ambiguities associated with Doppler enhancement, we estimate the jet kinetic luminosity from the isotropic extended emission, applying a method that allows one to convert 151 MHz flux densities, , measured in Jy, into estimates of kinetic luminosity, , from Willott et al (1999); Blundell and Rawlings (2000). This estimator was expressed explicitly in terms of flux density in (1.1) of Punsly (2005):
| (3-1a) | |||
| (3-1b) | |||
where is the total optically thin flux density from the lobes (i.e., no contribution from Doppler boosted jets or radio cores). We assume a cosmology with =70 km/s/Mpc, and . In order to implement this technique, one needs to determine which components are optically thin and which are Doppler enhanced.
One might suspect that the strong knot in the western component of Figure 1 is Doppler enhanced since the parsec scale jet is directed towards this feature with an apparent velocity of 14c (Jorstad et al, 2001; Tingay et al, 1998). However, the integrated flux of the western component is far weaker than the eastern component and it is optically thin (see Table 1). Thus, we conclude that the western component is not likely to be significantly Doppler enhanced. We can fit the lobe flux densities in table 1 by a two component model, a strong knot with a spectral index, , and a diffuse component with from 1.56 GHz to 8.46 GHz. The western (eastern) component is fit with 10 mJy (20 mJy) of diffuse emission and 25.6 mJy (32.3 mJy) of knot emission at 4.86 GHz. This reproduces all of the average flux densities in table 1 except for the 1.56 GHz flux density, 125 mJy, of the eastern lobe which falls short by 20 mJy. Extrapolating these power laws to 151 MHz, predicts 1.4 Jy of lobe emission and from (3.1), . If one only considers the diffuse emission as significant at 151 MHz, one can get a conservative lower bound of 966 mJy, or .
For the sake of comparison, one can also use the isotropic estimator derived in (3.8) of Punsly (2005) which can be trivially adapted to 4.86 GHz,
| (3-2) |
where the spectral index , , is the optically thin flux density at 4.86 GHz in Jy and the total radio luminosity is . Table 1 indicates that the spectral index from 4.86 GHz to 1.56 GHz is . One can get and from Ginzburg (1979). Inserting these values into (3.8) with the aid of (3.1b) and table 1, we find . The close agreement between the two isotropic estimators is reassuring.
4 Estimating the Accretion Flow Thermal Luminosity
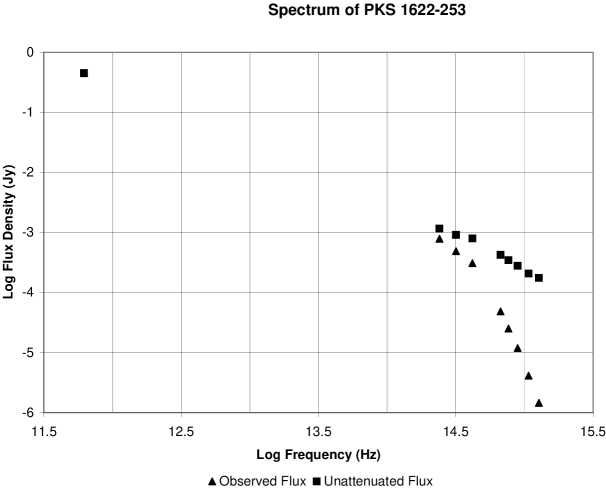
The broad band continuum spectrum in Figure 2 (after correcting for the Galactic extinction from the Ophiuchus cloud using the results of Schlegel et al (1998)) indicates a broad synchrotron peak with a high frequency tail with a spectral index of 1.4 that extends down to in the quasar rest frame (Alighieri et al, 1994). Consistent with this interpretation is the significant polarization in the rest frame near UV, (Impey and Tapia, 1990).
Thus, one cannot detect the thermal signatures of the accretion flow. The best one can do is to get an estimate on the upper bound of the accretion disk luminosity, . We tried to improve on this estimate by making our own optical observations of PKS 1622-253, hoping to catch the source in a low state of blazar activity and thereby improving the upper bound on the masked thermal emission. The source was observed on three consecutive nights with the 2.1-m “Jorge Sahade” Telescope, Complejo Astronómico El Leoncito (CASLEO), Argentina, beginning in the evening of 4/26/03 and ending in the morning of 4/29/03 and was slightly brighter than that observed by Alighieri et al (1994), and therefore was too bright for these observations to improve our knowledge of the accretion disk luminosity.
One can estimate by noting that the bolometric luminosity of the thermal emission from the accretion flow includes optical, ultraviolet and any radiation in broad emission lines from photo-ionized gas or as IR reprocessed by molecular gas. In order to place an upper bound on , we construct a composite spectral energy distribution (SED) of a quasar accretion flow. In order to separate the accretion flow thermal luminosity from IR and optical contamination from the jet, an SED for radio quiet quasars was chosen since this represents pure accretion luminosity. In radio quiet quasars, weak versions of radio loud jets apparently exist (Baravainis et al, 2004). The bolometric luminosity of radio quiet quasars is dominated by IR to UV emission, i.e., the radio emission from the jet does not contribute significantly to bolometric luminosity (Laor, 1998). Furthermore, the IR synchrotron emission from the jet is swamped by thermal dust emission in radio quiet quasars (Haas et al, 1998, 2000). Thus, the IR to X-ray composite of a radio quiet quasar seems to represent the thermal emission from a viscous accretion flow. A piecewise collection of power laws is used to approximate the individual bands of a radio quiet quasar accretion flow luminosity in a composite spectral energy distribution (SED). The IR and optical data are from the composite spectrum of Elvis et al (1994), the NUV (near ultraviolet) and EUV data are from the HST composites of Zheng et al (1997); Telfer et al (2002) and the X-ray portion of the composite is from Laor et al (1997). One can compute the bolometric luminosity of the accretion flow from the composite spectral energy distribution. In addition to the continuum, the composite spectrum of Zheng et al (1997) indicates that of the total optical/UV quasar luminosity is reprocessed in the broad line region. Combining this with the continuum luminosity yields, . The absolute visual magnitude of the composite is . Comparing the spectral luminosity of PKS 1622-253 from figure 2, , with the composite SED, , one finds an upper bound of for PKS 1622-253. However, since there is no deviation from the steep power law in the spectrum of Alighieri et al (1994) at high frequency, we claim that the actual value of from an underlying accretion disk is far less than this. One way to get a crude estimate of when the blazar jet masks the thermal UV flux is to use a broad line luminosity. For example, Wang et al (2004) use the composite spectrum of Francis et al (1991) to motivate the relation, , where is the luminosity of the broad emission line. Using the line strength from Alighieri et al (1994) and correcting for Galactic extinction using the results of Schlegel et al (1998), we find .
If one also assumes that the shape of the composite spectrum is independent of quasar luminosity, a simple approximate formula is obtained that relates the k-corrected absolute visual magnitude with bolometric luminosity,
| (4-1) |
Thus, subtracting out the optical emission from the jet, the estimate on above suggests that the accretion flow alone would produce , right at the typical dividing line between Seyfert 1s and quasars (Veron-Cetty and Veron, 2001).
5 Discussion
We performed deep radio observations of PKS 1622-253 with the VLA and also extricated the intrinsic IR/optical spectrum from the attenuation due to the Ophiuchus cloud. Our conclusion is that this source is a classical triple radio galaxy with a powerful superluminal radio core and powerful FRII radio lobes. The optical/near UV emission is dominated by the high frequency tail of a very broad synchrotron spectrum associated with the powerful radio core. The intrinsic accretion flow luminosity is at the quasar/ Seyfert 1 dividing line, (Veron-Cetty and Veron, 2001). It was shown that PKS 1622-253 has roughly equal jet kinetic luminosity and accretion flow bolometric luminosity, .
The gamma-ray apparent luminosity has a time average value of and flares at (Hartman et al, 1999). The gamma ray luminosity is enhanced by the Doppler factor to the fourth power, . In order to determine the intrinsic gamma ray luminosity of the jets one must know the Doppler factor of the high energy plasma. The best estimates we have is from measurements of the apparent super-luminal jet speeds on VLBI scales. This scale is much larger than the gamma ray emitting region and it is not clear if one is observing pattern or bulk flow speeds. Higher resolution typically yields higher apparent speeds (Kellermann et al, 2004). Thus, the maximal apparent super-luminal velocity from VLBI for each blazar is probably the best estimator of the Doppler factor of the gamma ray plasma. The super-luminal motion and the variability results of Kellermann et al (2004) and the beaming analysis of Padovani and Urry (1992) indicate that strong blazar jets in quasars are typically enhanced by . The extremely super-luminal jet speed of 14c, Jorstad et al (2001), and the extreme radio flux and radio polarization variability, Tingay et al (2003), implies that PKS 1622-253 is an extreme blazar and is likely in flare states. Thus, even during a gamma ray flare of the intrinsic jet kinetic luminosity is needed to power the gamma ray emission and on average of the intrinsic jet energy is converted into gamma rays.
Finally, we note that such powerful jets from weakly accreting systems are not rare for EGRET sources. The most extreme case is PKS 0202149 at z=0.405 with and a very steep optical spectral index (Perlman et al, 1998). Applying, the methods of section 4, one concludes . It does not have FRII radio lobes (or any extended radio emission for that matter, see Murphy et al (1993)), so one can not make an isotropic estimate of the jet kinetic luminosity. However, it has been observed more than once with an apparent gamma-ray luminosity (Hartman et al, 1999). Apparently, strong jets can be driven without a strong accretion flow and if there are also large Doppler factors associated with a nearly line of sight jet, gamma-ray fluxes detectable by EGRET can be achieved. A plausible theoretical explanation is provided in Punsly (2001) in which it is claimed that it is the accumulation of vertical magnetic flux near the black hole that is the primary determinant of jet power in FRII radio sources, not the accretion flow proper. The release of black hole spin energy by the large scale torque applied by the magnetic flux in the form of a relativistic jet is clearly shown in accord with the theory in the simulations of Semenov et al (2004).
References
- Alighieri et al (1994) Alighieri, S. diSergeo, et al 1994, MNRAS 269 998
- Baravainis et al (2004) Barvainis, R. 2004, ApJ 619 108
- Blundell and Rawlings (2000) Blundell, K., Rawlings, S. 2000, AJ 119 1111 458
- Douglas et al (1996) Douglas, J.N., Bash, F.N., Bozyan, F.A., Torrence, G.W. & Wolfe, C. 1996, AJ, 111, 1945
- Elvis et al (1994) Elvis, M. et al 1994, ApJS 95 1
- Fichtel et al (1994) Fichtel, C. et al 1994, ApJS 94 551
- Francis et al (1991) Francis, P. et al 1991, ApJ 373 465
- Ginzburg (1979) Ginzburg, V. 1979, Theoretical Physics and Astrophysics Translated by D. Ter Haar (pergamon, New York)
- Haas et al (1998) Haas, M. et al 1998, ApJL 503 113
- Haas et al (2000) Haas, M. et al 2000, A&A 354 453
- Hartman et al (1999) Hartman, R.. et al 1999, ApJS 123 79
- Hunter et al (1994) Hunter, S., Digel, S., de Geus, E., Kanbach, G. 1994 ApJ 436 216
- Impey and Tapia (1990) Impey, C., Tapia, S. 1990, ApJ 354 124
- Jorstad et al (2001) Jorstad, S.G et al 2001, ApJS 134 181
- Kellermann et al (2004) Kellermann, K.I. et al 2004 ApJ 609 539
- Laor et al (1997) Laor, A. et al 1997, ApJ 477 93
- Laor (1998) Laor, A. 1998, ApJL 505 L83
- Large et al (1981) Large, M.I., Mills, B.Y., Little, A.G., Crawford, D.F. & Sutton, J.M. 1981, MNRAS 194, 693
- Murphy et al (1993) Murphy, D., Browne, I., Perley, R.1993, MNRAS 264 298
- Padovani and Urry (1992) Padovani and Urry 1992 ApJ 387 449
- Perlman et al (1998) Perlman, E. et al 1998, AJ 1151253
- Punsly (1995) Punsly, B. 1995, AJ 109 1555
- Punsly (2001) Punsly, B. 2001, Black Hole Gravitohydromagnetics (Springer-Verlag, New York)
- Punsly (2005) Punsly, B. 2005, ApJL 623 L12
- Schlegel et al (1998) Schlegel, D., Finkbeiner, D., Davis, M. 1998, ApJ 500 525
- Semenov et al (2004) Semenov, V. Dyadechkin, S., Punsly, B. 2004, Science 305 978
- Stickel et al (1994) Stickel, M., Meisenheimer, K., Kuehr, H. 1994, A&AS105 211
- Takalo et al (1998) Takalo, 1998, A&AS 129 577
- Telfer et al (2002) Telfer, R., Zheng, W., Kriss, G., Davidsen, A. 2002, ApJ 565 773
- Tingay et al (1998) Tingay, S., Murphy, D., Edwards, P., 1998, ApJ 500 673
- Tingay et al (2003) Tingay, S., et al 2003, PASJ 55 351
- Veron-Cetty and Veron (2001) Veron-Cetty, M.P., Veron, M. 2001, Astron. and Astrophys. 374 92 374 141
- Wang et al (2004) Wang, J.-M., Luo, B, Ho, L. 2004, ApJL 615 9
- Willott et al (1999) Willott, C., Rawlings, S., Blundell, K., Lacy, M. 1999, MNRAS309 1017
- Zheng et al (1997) Zheng, W. et al 1997, ApJ 475 469