Eclipse Prediction and Orbit Improvement for Asteroids:
Theory and Application to Near Earth Asteroids
Abstract
Asteroids can be eclipsed by other bodies in the Solar System, but no direct observation of an asteroid eclipse has been reported to date. We describe a statistical method to predict an eclipse for an asteroid based on the analysis of the orbital elements covariance matrix. By propagating a set of Virtual Asteroids to an epoch correspondent to a close approach with a Solar System planet or natural satellite, it is possible to estimate the probability of a partial or total eclipse.
The direct observation of an eclipse can provide data useful to improve the asteroid orbit, especially for dim asteroids typically observed only for a few days. We propose two different methods: the first, based on the inclusion of the apparent magnitude residuals into the orbit’s least squares minimization process, capable of improving the asteroid’s nominal orbit and the related covariance matrix; the second, based on weighting different Virtual Asteroids in relation to their apparent magnitude during the eclipse, useful for recovery purposes.
As an application, we have numerically investigated the possibility of a Near Earth Asteroid eclipsed by the Moon or the Earth in the 1990-2050 period. A total of 74 distinct eclipses have been found, involving 59 asteroids. In particular, the asteroid (99942) Apophis has a probability of about 74% to enter the Moon’s penumbra cone and a probability of about 6% to enter the umbra cone on April 14, 2029, less than six hours after a very close approach to Earth.
1 Introduction
Near Earth Asteroids, or NEAs, have received increased attention by the scientific community and the public at large in recent years. Over the past decade, the rate of discovery for NEAs has increased by an order of magnitude to the current rate of roughly 500 NEAs per year (Chamberlin, 2005).
In this paper, we provide a catalog of past and future asteroid eclipses, and propose to use eclipses of asteroids to further constrain their orbits. Here, an eclipse refers to a period when an NEA passes through the shadow of the Earth or the Moon. Simply determining whether an eclipse occurs allows one to accept or reject many possible orbits for an asteroid. Observing the decrease in luminosity due to its travel through the umbra or penumbra cones would add to the precision of its position in the sky. A total eclipse (passage through the umbra cone) would place significant limits on the distance to the asteroid.
Observing the eclipse of an asteroid is not a trivial matter, even if one has good knowledge of the asteroid’s position. Eclipses of an asteroid by the Moon’s shadow can occur at any lunar phase. Depending on the solar elongation of the asteroid during the eclipse, the change in luminosity may be visible from an entire hemisphere on Earth, or may not be observable anywhere on Earth.
The prediction of such events requires a statistical treatment of the accuracy of the orbital elements. The approach used here involves sampling the most likely set of orbital elements, based on existing observations, and then simulating the dynamics of objects on these orbits with passing time. We also need a good understanding of the factors contributing to the changes in apparent magnitude during the eclipse.
The plan of the paper is as follows. In Section 2, we introduce the tools needed to describe the eclipse of an asteroid. In Section 3, we apply these tools to the case of NEAs eclipsed by the Earth and the Moon. In Section 4, we estimate the eclipse probability for NEAs. Conclusions follow in Sections 5.
2 Statistical Eclipse Prediction
Our statistical method involves the use of Virtual Asteroids (VAs, see Milani et al. (2002)) in conjunction with the concept of an Eclipse Plane (EP) to determine the probability of an eclipse. The theory is very similar to NEAs impact prediction, with eclipse cones playing the role of the target body, and the EP replacing the Target Plane (TP, see Milani et al. (2002)).
2.1 Eclipse Geometry
Given a spherical body with a radius , at a distance from the Sun, the semi-opening angle for the penumbra and the umbra cones are, respectively , with equal to the Sun’s radius, the “” sign for and the “” sign for . The radius of each section of the cone at a distance from the center of the spherical body and along the Sun-body line is . When , as is always the case in the Solar System, and , and the umbra cone has a finite length . The Earth’s umbra cone length ranges from 3.55 LD to 3.67 LD (LD = Lunar Distance = 384400 km), while for the Moon it is in the range between 0.96 LD and 1.00 LD, depending on the distance between these objects and the Sun. In our computations we assume km. The cones are aligned on the Sun-body line, keeping into account the light-time delay.
2.2 Virtual Asteroids
In order to predict an eclipse for an asteroid, we need a statistical description of the asteroid’s dynamics. This statistical description is necessary because the asteroid’s orbital elements are determined only up to some uncertainty. The information on the uncertainty on each orbital element and on the correlation between orbital elements is provided by the covariance matrix, as a result of a least-squares minimization iterative process. The covariance matrix allows the generation of an arbitrary number of Virtual Asteroids, all within the orbital elements uncertainty. The major advantage of sampling the asteroid orbital uncertainty with VAs is that each VA has the same probability to represent the asteroid, and this greatly simplifies a statistical interpretation of the asteroid dynamics related to the eclipse. The VAs provide the statistical description we need. An introduction to VAs and their use can be found in Milani et al. (2002).
For the analysis described in Section 3 we generate VAs using Principal Components Analysis technique (Jolliffe, 1986), also referred to as the Monte Carlo method in the literature. In particular, we will work with the full covariance matrix computed at an epoch in the middle of the observational arc of the asteroid.
2.3 The Eclipse Plane
Given the positions of the Sun, the eclipsing body and an asteroid, the EP is defined as the plane containing the asteroid, orthogonal to the Sun-body line (see Fig. 1).
As the asteroid’s position changes with time, the position of the EP is updated and a new data point is added to the plane. When the asteroid is represented by a cloud of VAs (see Section 2.2), each VA contributes data points to a different EP. Every data point in the plane represents the VA at a different time, and the three possible VA states are represented: outside penumbra, inside penumbra, and inside umbra. When all the different EPs are generated, they’re stacked, to obtain the final asteroid’s EP.
The eclipse probability can be estimated simply as the fraction of VAs eclipsed, with two different probabilities for penumbra and umbra eclipse. The sensitivity of this probability estimate is clearly limited by the number of VAs used. For the purpose of this work, we are interested in probabilities of the order of 0.01 or greater, achieved by using 512 VAs for each asteroid, in order to limit fluctuations.
2.4 Apparent Magnitude Computations
During the eclipse, the apparent magnitude of an asteroid is
| (1) |
with the absolute magnitude of the asteroid, and the distances of the asteroid from the observer and the Sun in AU, respectively, is a phase relation function, is the phase angle (Sun-asteroid-observer angle), is the slope parameter, eclipse correction, and is the ratio between the eclipsed Sun light flux and the nominal solar light flux. The parameterization used for the phase relation function is
| (2) | |||||
(Bowell et al., 1989; Cox , 2000). The value of adopted for all the asteroids is the default value 0.15. The eclipse correction is a simple function of :
| (3) |
and can be derived considering that, if the light flux from a partially eclipsed solar disk is and the light flux from whole solar disk is , the apparent magnitude of the Sun, observed from the asteroid is , with the reference light flux for . The parameter is in the range between 1 and 0, with the limit values relative to the unobstructed Sun and to a total eclipse, respectively. For the numerical computation of we take into account the eclipse geometry and the solar limb darkening. The limb darkening effect (Cox , 2000) can be described by
| (4) |
with denoting the angle, measured from the Sun’s center, between the observer and the point on the Sun’s surface. Here, is the light intensity observed at wavelength . The values of the constants and relative to nm, used in the following computations, are = 0.93 and = -0.23 (Cox , 2000). The angle between the solar disk center and a point on the Sun’s surface, as measured from the asteroid, is related to through the transformation
| (5) |
valid in the limit of , where is the solar disk semi-aperture, and .
Using Eq. (4) and Eq. (5), it is possible to estimate numerically the fraction of light flux reaching the asteroid. In particular, using the normalization the integral of Eq. (4) over the fraction of the solar disk visible from an asteroid is always between 0 and 1. The variable can be easily computed: with and being the semi-aperture angles for the solar disk and the eclipsing body disk, respectively, and the angle between the two disks centers, all measured from the asteroid, we define and from
| (6) | |||||
| (7) |
We then let
| (8) | |||||
| (9) |
and the visible fraction of the solar disk, sorted by decreasing value of , is
| (10) |
with . These four cases are relative to the body disk outside, crossing and inside the solar disk, with the last case separated into two sub-cases, based on the relation between and . In general, the difference between and depends on the position of the body with respect to the solar disk.
By using this formalism we can compute the maximum apparent magnitude effect due to an eclipse for a generic asteroid, as a function of the close approach distance from Earth or Moon, keeping into account the Earth to Sun and Moon to Sun distance range. The result is reported in Fig. 2, where the maximum effect is obtained by forcing the perfect Sun-body-asteroid alignment, so that the body is obscuring the brighter part of the solar disk.
Two important classes of error have to be considered when trying to predict an asteroid magnitude: the light curve of the asteroid, and the atmosphere, oblateness and surface features of the eclipsing body. An accurate light curve is required in order to correctly interpret the observations. The light curve amplitude of the asteroid can be bigger than the eclipse effect, and should be measured immediately before and after the eclipse, in order to account for possible changes in the rotation due to the close approach to the eclipsing body, and also to account for complex light-curves related to tumbling asteroids (Pravec et al., 2005).
When the eclipsing body has an atmosphere, as is the case for NEAs eclipsed by the Earth, the apparent magnitude V can differ from that estimated here because of refraction and scattering of sunlight through the atmosphere. These effects become more and more important as a smaller fraction of the solar disk is illuminating the asteroid. In particular, the asteroid’s apparent magnitude will have a finite value even during the total eclipse phase. An estimate of this effect can be obtained from the Moon’s apparent magnitude during a total Moon eclipse: according to Mallama (1993), the apparent magnitude of the Moon fades from -12.7 outside the eclipse to +1.4 when the Moon reaches the maximum eclipse point. This gives an estimate of the maximum effect of the eclipse, 14.1, for an object at the distance of 1 LD from the Earth. This limit can be bigger by up to 5 magnitudes after volcanic eruptions (Mallama, 1993). The maximum eclipse effect at distances different from 1 LD can be obtained using inverse-square-law scaling. Body oblateness and a non-smooth body surface can also represent sources of error to the magnitude estimate, the former mainly during the penumbra eclipse, the latter mainly at the umbra-penumbra interface.
2.5 Eclipse Observation and Orbit Improvement
An appreciable fraction of relatively small NEAs are discovered during their close approach to the Earth-Moon system, and can be followed only for a limited number of days. This means that their observed arc is extremely short at the moment of the close approach, and their orbit can be determined with very limited accuracy. In case of an eclipse during the passage of the asteroid, it is possible in principle to measure the main features of the eclipse: the epoch relative to the beginning and the end of the total eclipse, and the magnitude variations during the partial eclipse phase. These data can help to improve the orbit accuracy: intuitively, if a set of VAs is used to statistically describe the orbital evolution of the asteroid, in general every VA will enter and leave the umbra region at different times and with a different geometry; the comparison between observations and predictions for different VAs could restrict the space of parameters to a subset having a behavior compatible with the observations. For total eclipses, accurate measurements of the umbra entering and leaving times are indirect observer-asteroid distance measurements: the intersection between a 2D surface (the umbra cone) and the line of sight from the observer to the asteroid provides the asteroid position within the measurement and model errors.
We propose two different methods to improve the asteroid orbit: one based on least squares minimization of a modified minimized function, and another based on VAs weighting.
The standard function minimized using least squares techniques is the sum over all the astrometric observations of the residuals on right ascension and declination
with an estimated accuracy of the order of 1.0 arcseconds for observations by modern telescopes using CCD cameras. This function can be extended, to include the eclipse magnitude observations
with the magnitude residual and the estimate of the total error on the magnitude measurement. A major problem related to this method is the correct estimate of , taking into account the asteroid light curve and effect of the eclipsing body’s atmosphere, oblateness and surface features. We are still investigating the applicability of this method; a direct asteroid eclipse observation would provide a great opportunity to test and validate this method.
An alternative approach is the following: we select a subset of all the VAs by assigning to each VA a weight defined as
and selecting all the VAs below a threshold . In this case represents the magnitude residual for the VA considered. This method doesn’t improve the nominal solution, but can be useful to determine the possible sky projection of the selected VAs after an observed eclipse, for recovery purposes. As an example, see Section 3.2 and Fig. 6 for the case of 2004 ST26.
3 NEAs Eclipsed by Earth and Moon
As an application of this eclipse prediction method, we investigate the possibility for each known NEA to be eclipsed by the Earth or the Moon. We have propagated numerically the orbit of all the known NEAs, 3444 asteroids, in the period 1990-2050, using the orbits and covariance matrices computed by the NEODyS group (Chesley & Milani, 2000) that were available on August 17, 2005. The dynamical system includes the Sun, all planets, and the Moon, plus the massless VAs. The numerical integration is performed using the ORSA111http://orsa.sourceforge.net framework. In particular, a modified version of the 15th order RADAU integrator (Everhart, 1985) has been used, with a nominal accuracy of . The difference between the original algorithm and the modified version is that this modified version doesn’t integrate the Solar System objects, as their positions and velocities are read at each internal timestep from the JPL ephemeris DE405 to ensure the maximum possible accuracy, while the VAs are numerically propagated. The accuracy of this modified RADAU integrator, as implemented in the ORSA framework, has been extensively tested during the development of ORSA. In particular, the minimum Earth/asteroid distance is always in very good agreement (i.e. well within the orbital elements uncertainties) with the data provided by the NEODyS website (Chesley & Milani, 2000).
The results of this analysis have been collected in Table 1. In particular, we have recorded all the eclipses with a penumbra eclipse probability 0.01 and a fraction of solar disk visible 0.99, that is, all the eclipses within 10 LD if by the Moon, and within 40 LD if by the Earth. A total of 74 distinct eclipses have been found, involving 59 asteroids. Of the 74 eclipses found, 58 are by Earth and 16 by the Moon. A detailed analysis of the probability of an asteroid eclipse and an estimate of the expected number of eclipses per year are provided in Section 4.
We have found three classes of special asteroid eclipses: double eclipses, multiple eclipses, and immediate eclipses. These classes are not mutually exclusive, and we have examples of eclipses belonging to more than one class. An asteroid experiences a double eclipse if it is eclipsed by both Earth and Moon during the same close approach; more details are provided in Section 3.5. A different pattern is observed in 3 other cases, when the same asteroid experiences several eclipses during different close approaches. We will refer to these events as multiple eclipses (see Section 3.6). Another class is represented by asteroids with an eclipse happening during the same close approach as the discovery; we will refer to these events as immediate eclipses, and the asteroids with eclipses belonging to this class are listed in Table 2 and studied in more detail in Section 3.7.
In the following sections we describe some particular cases found, beginning with the extremely unusual case of (99942) Apophis.
3.1 (99942) Apophis
The asteroid (99942) Apophis was discovered on 2004 June 19 by Roy Tucker, David Tholen, and Fabrizio Bernardi while observing from the Kitt Peak National Observatory, Arizona. Announced by Gilmore et al. (2004), this asteroid has set the highest level of attention since the introduction of the Torino Scale (TS, Morrison et al., 2004), reaching the TS-4 level. Pre-discovery observations of (99942) Apophis excluded the possibility of an impact with the Earth on 2029 April 13, but still leaving the possibility of an impact at successive epochs. Radar observations in January 2005 (Benner et al., 2005) and September 2005 (Giorgini et al., 2005) further improved the orbit of the asteroid. In particular, for our computations we are using the orbit solution computed including all the radar observations mentioned above.
Less than one day after the close approach to Earth on 2029 April 13, this asteroid has a chance of being eclipsed by the Moon. The passage of the VAs close to or inside the Moon’s shadow is visible in Fig. 3. The VAs cross the Moon’s shadow cones at a distance between 0.70 and 0.75 LD from the Moon, where the penumbra disc radius ranges between 2981 and 3081 km (increasing with distance), and the umbra disc between 395 and 495 km (decreasing with distance). About 74% of all the VAs enter the penumbra, starting as early as 2029 Apr 14 at 2:41 TDT (TDT is the Terrestrial Dynamical Time timescale) and leaving it no later than 3:41 TDT of the same day, lasting up to 42 minutes, 32 minutes on average. A smaller fraction, about 6% of all the VAs, enter the umbra starting as early as 3:06 TDT and leave it no later than 3:14 TDT, lasting up to about 6 minutes, with an average of 4 minutes. The VA relative to the nominal orbit enters the penumbra at 3:12 TDT and leaves it at 3:40 TDT without entering the umbra (see Fig. 3). This eclipse will not be visible from Earth because the solar elongation of this asteroid will range between about 15.9∘ and 17.7∘ during the eclipse. A diagram showing the expected magnitude curve for (99942) Apophis is shown in Fig. 4. Simulated magnitudes are shown for observations both from Earth (or from a low orbit satellite) and from the Moon (in case a telescope will be in place on the side of the Moon facing the Earth by 2029).
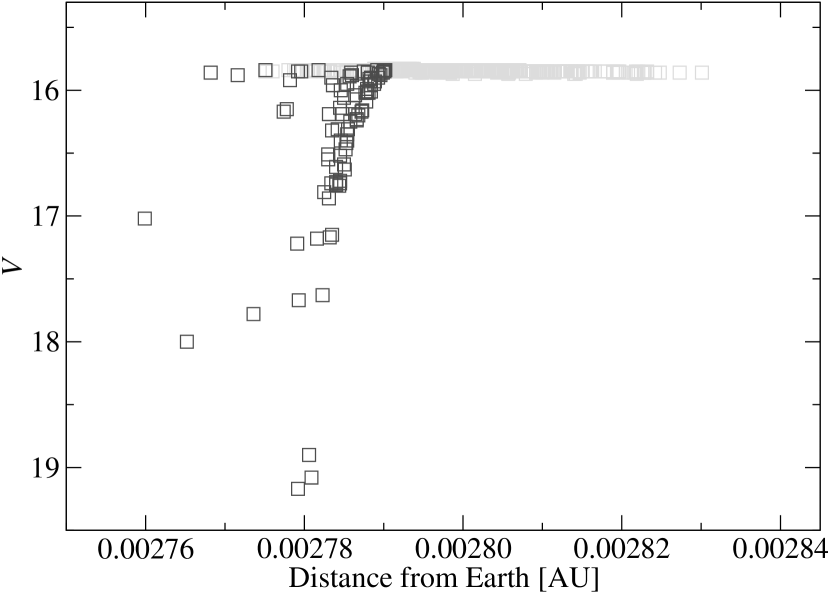
3.2 2004 ST26
This asteroid has a 18% probability that it crossed the lunar penumbra on 2004 September 22 at 2:08 TDT, and about 4% probability of having crossed the umbra cone. The eclipse plane is provided by Fig. 5.
This case can be used to show the ideas behind the orbit improvement connected with the direct observation of an asteroid eclipse, as described in Section 2.5. In Fig. 6 we have the distribution of apparent magnitude, as a function of the distance from Earth, for all the generated VAs at a fixed time. Each data point represents a different VA. An eclipse observation at this time could select, within the magnitude measurement errors, the fraction of VAs compatible with observations: As an example, an apparent magnitude measurement of would indicate a distance from Earth of about 0.00278 AU, promoting VAs (and relative orbits) at that distance. Additional information on the apparent magnitude curve, obtained with successive measurements, could further improve the relative weight of different asteroids to help in the selection of the most probable region in the space of the orbital elements.
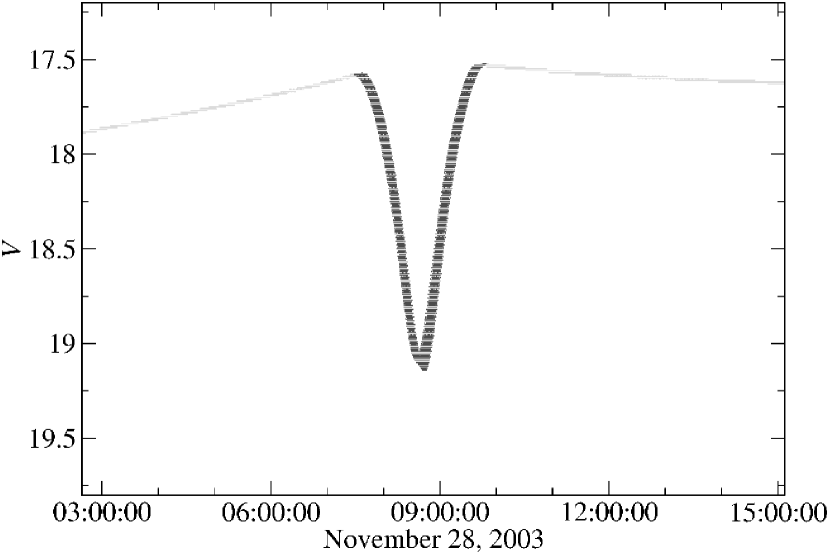
3.3 2003 WT153
The asteroid 2003 WT153 experiences one of the 15 eclipses found with penumbra eclipse probability (see Table 1), that is, all the VAs relative to this asteroid crossed the Earth’s penumbra cone on 2003 Nov 28 at 8:44 TDT. This eclipse, not directly observed, lasted about 130 minutes, with an important effect on the apparent magnitude (see Fig. 7).
3.4 2003 SY4
This asteroid is the only one found, a posteriori, with astrometry measurements during an eclipse. In particular, part of the discovery observations were made during the eclipse listed on Table 1. Discovered by M. Block at the LPL/Spacewatch II observatory (Tichy et al., 2003) on 2003 September 17 with a series of six observations, it turns out that the first two observations, at 6:58 TDT and 7:19 TDT, were inside the eclipse window. The asteroid 2003 SY4 has been eclipsed by the Earth on 2003 September 17 between 6:48 TDT and 7:24 TDT, and it crossed, with a probability of 100%, the penumbra cone. Since the minimum solar disk fraction visible during the eclipse is 0.98, the effect of the eclipse is much smaller than the magnitude measurements error: the measured apparent magnitude during the eclipse is while the computed one is (neglecting all the error sources described in Section 2.4).
3.5 Double Eclipses
We have found 9 different double eclipses, i.e., eclipses when the same asteroid is eclipsed by both Earth and the Moon during the same close approach, usually within the span of a few hours. The 9 events found in our numerical simulations are: 2004 TB10 in 1990, 2003 SW130 in 1990, 1998 BT13 in 1998, 2001 FE90 in 2009, 2004 BL86 in 2015, 2001 GP2 in 2020, 2004 UT1 in 2022, 1999 VX25 in 2040, 2005 KA in 2042.
The case of 1998 BT13 is the only one with probability 1.00 for both penumbra eclipses. The case of 2004 UT1 is also interesting because the two eclipses can be connected, i.e. the asteroid can be eclipsed by Earth and Moon at the same time, because the second eclipse by the Earth can start before the first eclipse, by the Moon, is finished.
3.6 Multiple Eclipses
We have multiple eclipses when the same asteroid experiences several eclipses during different close approaches. We have found 3 such cases: 2001 LB (2012, 2023), 2003 WT153 (2003, 2030), 2003 YT70 (1999, 2001, 2005, 2007, 2009). In particular, all the multiple eclipses found involve the Earth. The multiple eclipses pattern for the asteroid 2003 YT70 is related to its orbital period being very close to 2 years.
3.7 Immediate Eclipses
We have immediate eclipses every time an asteroid experiences an eclipse during the same close approach as its discovery. We have collected all 18 eclipses belonging to this class in Table 2. In particular, 11 immediate eclipses are by the Earth and 7 by the Moon. We have investigated the relation between the absolute magnitude of the asteroid involved and the delay between eclipse time and asteroid discovery time .
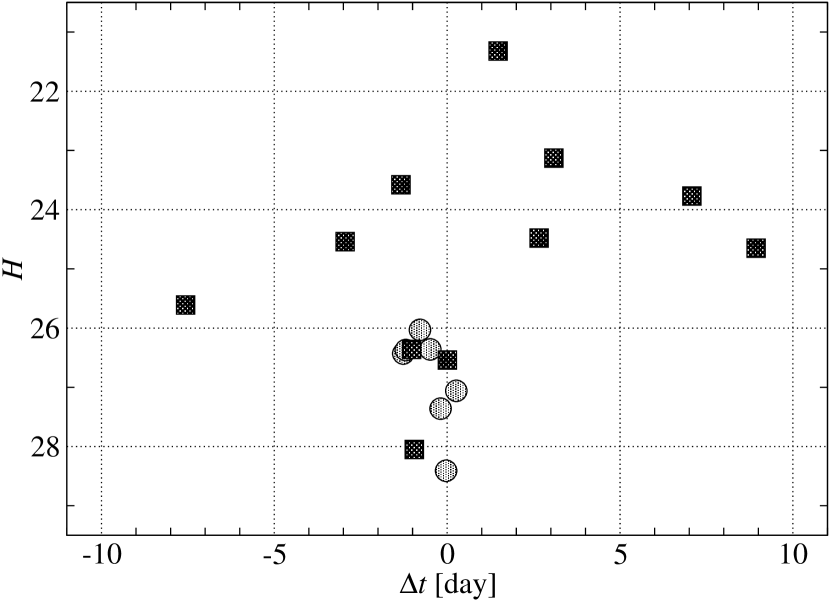
As Fig. 8 suggests, we can distinguish between immediate eclipses by bright asteroids () or by dim asteroids (). The 8 eclipses of bright asteroids (upper half of Fig. 8, all by Earth) exhibit delays of several days, with a tendency toward eclipse after discovery, while the 10 eclipses of dim asteroids (lower half of Fig. 8, 3 by Earth, 7 by Moon) have much shorter delays, with a strong tendency toward eclipse before discovery.
To try to explain this behavior we must consider that dim asteroids, with an estimated diameter typically between 10 and 30 meters, can be observed by many active telescopes only for a limited amount of time (often only 2 or 3 nights), and for this reason dim asteroids can be discovered only when the observer/asteroid distance is close to the minimum. Also, even if potentially visible, a dim asteroid can remain undetected for several nights because of many factors related to the observatory hardware, asteroid dynamics, and other selection effects (see Jedicke et al. (2002) for a review). Now, if we consider that an eclipse by Earth or the Moon can take place only at a time close to the middle of the discovery time window, and that this discovery window is small for dim asteroids and relatively large for bright ones, it is easy to realize that we have only 1 or 2 nights to discover a dim asteroid before the eclipse, while we have several nights to discover a bright asteroid before the eclipse. Since 2 nights can often be insufficient to discover a dim asteroid, the eclipse is likely to happen before the dim asteroid is discovered. This effect poses substantial limits to the numerical prediction and the direct observation of immediate eclipses involving dim asteroids.
4 Eclipse Probability for NEAs
We attempt now to estimate the probability of two different events: the average eclipse probability per NEA, and the probability for an eclipse to occur at an epoch very close to the discovery epoch of the asteroid.
The average eclipse probability per NEA can be obtained by properly scaling the impact probability between a NEA and the Earth, that Stuart & Binzel (2004) estimate as per year per NEA. The scaling factor is the ratio between the eclipse cone longitudinal section and the gravitational capture radius disk of the Earth. This section is well approximated by a trapezoid for the penumbra cone, and by a triangle for the umbra cone. By using the relations developed in Section 2.1, and using the Earth’s gravitational capture radius equal to 7540 km (Stuart & Binzel, 2004) when dealing with impact probabilities and the Earth’s equatorial radius of 6378 km for geometric computations, and limiting the penumbra cone length to 10 LD for the Moon and to 40 LD for the Earth (that is, about ten times the respective umbra cone length), with a simple algebra we find that the penumbra and umbra scaling factors for the Earth are, respectively, 7300 and 50, while for the Moon we get 460 and 4. The average eclipse probabilities are , , , , all per year per NEA.
We can scale these probabilities to the number of NEA (3444 asteroids) examined in our analysis, and to the 60 years period monitored, obtaining the expected number of events , , and . These probabilities can be compared directly to the probabilities of the eclipses found (see Table 1), considering the eclipse probability as a fractional event. The sum of all the probabilities relative to asteroids with eclipses at epochs far from the discovery epoch, i.e. considering only the asteroids that are in Table 1 but not in Table 2, gives , , and . The agreement between estimated and numerically detected number of events for eclipses by the Earth can be considered satisfactory, considering the relatively small number of eclipses found. On the other hand, the sums and for eclipses by the Moon are significantly different from the estimates and , with (99942) Apophis as the major contributor. We notice that, neglecting the contribution from (99942) Apophis, we would have and , in satisfactory agreement with the predicted probability. To partially justify this solution to the discrepancy we notice that (99942) Apophis’s orbit has been determined with an accuracy that is orders of magnitude better than the average accuracy of all the other asteroids experiencing an eclipse, putting this asteroid somewhat out of statistics. An alternative explanation, still under investigation, is of dynamical nature: the Moon’s penumbra and umbra cones can intersect a number of NEAs orbits larger than expected because the Moon, while orbiting around the Earth, is allowed in general to get a bit closer to an asteroid, especially when compared to an hypothetic Moon fixed on the Earth’s orbit.
What is the probability for a newly discovered NEA to experience an eclipse during the same close approach of the discovery? We can estimate it using the NEA discovery statistics (Chamberlin, 2005). Our analysis extends from 1990 to 2050, but for this section we are limited to the period between 1990 and today. The NEAs discovered between Jan 1, 1990 and August 1, 2005 are , and in this period only 17 asteroids have experienced eclipses at a time very close to the discovery time (for a total of 18 eclipses, because 1998 BT13 experiences a double eclipse). This leads to a probability of about one in 194 for a newly discovered NEA to experience an eclipse at a time very close to the discovery time. If we limit ourselves to the period between Jan 1, 1998 and August 1, 2005 only NEAs have been discovered in this period, and only 16 of the original 17 asteroids fall into this period. The probability estimate for this restricted period is of about one in 187. With 439 NEAs discovered in 2003 and 532 discovered in 2004 (Chamberlin, 2005), a number of events between two and three per year can be expected, and possibly more, as the six events in 2003.
5 Conclusions
Near Earth Asteroids can be eclipsed by Earth and the Moon as has happened in the past 15 years, and will occur again in the future to known asteroids and to asteroids not yet discovered. We have compiled a catalog, based on numerical simulations, of all the asteroid eclipses between a NEA and Earth or the Moon, in the period 1990-2050, including a total of 74 distinct eclipses involving 59 asteroids. A closer inspection at these eclipses allowed us to determine three different recurring patterns: double eclipses, multiple eclipses, and immediate eclipses. In particular, the analysis of immediate eclipses allowed us to explain their apparent tendency to happen within one or two days before the asteroid discovery.
An analysis of the NEAs eclipse probability offers two main results: asteroid impact probabilities for Earth and the Moon can be scaled in order to predict asteroid eclipse probability, with satisfactory agreement between predicted and numerically detected number of events; every newly discovered NEA has a probability of about one in 190 to experience an eclipse during the same close approach of the discovery. Given the present rate of discovery, several new eclipses are expected every year involving newly discovered asteroids. With the beginning of a new class of NEOs surveys, such as LSST (Stubbs et al., 2004) and Pan-STARRS (Kaiser & Pan-STARRS Team, 2005), it will be possible to cover the entire visible sky to the 24th magnitude in less than a week, enabling discovery rates almost two orders of magnitude greater than all existing surveys combined, hence allowing the direct observation of up to a few hundred NEA eclipses per year. We plan to routinely monitor numerically all NEAs for potential eclipses, using the Distributed Computing System for Near Earth Objects Hazard Monitoring (Tricarico, 2004) now under construction.
The direct observation of an asteroid eclipse can provide data useful to improve the orbit of the asteroid. We suggest two different methods to improve the asteroid orbit, the first as an extension of the standard least squares method, and the second as a weighting rule for different VAs relative to the asteroid. We plan to test and extend these methods as soon as data relative to direct observations of NEA eclipses will be available.
The theoretical tools developed in this work in order to statistically predict an asteroid eclipse apply to any case of an asteroid eclipsed by a larger spherical body.
References
- Benner et al. (2005) Benner, L. A. M., Nolan, M. C., Giorgini, J. D., Chesley, S. R., Ostro, S. J., International Astronomical Union Circular, 8477 (2005).
- Bowell et al. (1989) Bowell, E., Hapke, B., Domingue, D., Lumme, K., Peltoniemi, J., Harris, A. W., Application of photometric models to asteroids, in Asteroids II, Proceedings of the Conference, Tucson, AZ, p. 524-556 (1989).
- Chamberlin (2005) Chamberlin, A. B., http://neo.jpl.nasa.gov/stats/, (2005).
- Chesley & Milani (2000) Chesley, S. R. and Milani, A., An Automatic Earth-Asteroid Collision Monitoring System, BAAS, Vol. 32, p. 862 (2000).
- Cox (2000) Cox, A. N., Allen’s Astrophysical Quantities, Springer-Verlag, NY (2000).
- Everhart (1985) Everhart, E., An efficient integrator that uses Gauss-Radau spacings, in Dynamics of Comets: Their Origin and Evolution, Proceedings of IAU Colloq. 83, edited by A. Carusi, G. B. Valsecchi. Dordrecht: Reidel, Astrophysics and Space Science Library, Volume 115, 185-202 (1985).
- Gilmore et al. (2004) Gilmore, A. C., Kilmartin, P. M., Young, J., McGaha, J. E., Garradd, G. J., Beshore, E. C., Casey, C. M., Christensen, E. J., Hill, R. E., Larson, S. M., McNaught, R. H., Smalley, K. E., Minor Planet Electronic Circulars, Y-25 (2004).
- Giorgini et al. (2005) Giorgini, J. D., Benner, L. A. M., Ostro, S. J., Nolan, M. C., Busch, M. W., International Astronomical Union Circular, 8593, 1 (2005).
- Jedicke et al. (2002) Jedicke, R., Larsen, J., Spahr, T., Observational Selection Effects in Asteroid Surveys and Estimates of Asteroid Population Sizes, in Asteroids III, University of Arizona Press, Tucson, AZ, p. 71-87 (2002).
- Jolliffe (1986) Jolliffe, I. T., Principal Component Analysis, New York: Springer-Verlag (1986).
- Kaiser & Pan-STARRS Team (2005) Kaiser, N., Pan-STARRS Team, The Pan-STARRS Large Survey Telescope Project, AAS Meeting Abstracts, 206, (2005).
- Mallama (1993) Mallama, A., Two Celestial Visibility Projects: 1) The Brightness of an Eclipsed Moon and 2) The Phase Anomaly of Venus, BAAS, Vol. 25, p. 1334 (1993).
- Milani et al. (2002) Milani, A., Chesley, S. R., Chodas, P. W., Valsecchi, G. B., Asteroid Close Approaches: Analysis and Potential Impact Detection, in Asteroids III, University of Arizona Press, Tucson, AZ, p. 55-69 (2002).
- Morrison et al. (2004) Morrison, D., Chapman, C. R., Steel, D., Binzel R. P., Impacts and the Public: Communicating the Nature of the Impact Hazard, in Mitigation of Hazardous Comets and Asteroids, edited by Belton, M. J. S., Morgan, T. H., Samarasinha, N. H, and Yeomans, D. K., Cambridge University Press (2004).
- Pravec et al. (2005) Pravec, P., Harris, A. W., Scheirich, P., Kušnirák, P., Šarounová, L., Hergenrother, C. W., Mottola, S., Hicks, M. D., Masi, G., Krugly, Y. N., Shevchenko, V. G., Nolan, M. C., Howell, E. S., Kaasalainen, M., Galád, A., Brown, P., Degraff, D. R., Lambert, J. V., Cooney, W. R., Foglia, S. Tumbling asteroids, Icarus, 173, p. 108-131 (2005).
- Stuart & Binzel (2004) Stuart, J. S. and Binzel, R. P., Bias-corrected population, size distribution, and impact hazard for the near-Earth objects, Icarus, Vol. 170, p. 295-311 (2004).
- Stubbs et al. (2004) Stubbs, C. W., Sweeney, D., Tyson, J. A., & LSST, An Overview of the Large Synoptic Survey Telescope (LSST) System, AAS Meeting Abstracts, 205 (2004).
- Tichy et al. (2003) Tichy, M., Block, M., Garradd, G. J., McNaught, R. H., Sanchez, S., Stoss, R. Nomen, J., Birtwhistle, P., Smalley, E., Minor Planet Electronic Circulars, S-12 (2003).
- Tricarico (2004) Tricarico, P., A Distributed Computing System for Near Earth Objects Hazard Monitoring, BAAS, Vol. 36, p. 1141 (2004).
| penumbra | umbra | |||||||||||||
|---|---|---|---|---|---|---|---|---|---|---|---|---|---|---|
| asteroid | body | epoch | max() | min() | max() | H | diameter | |||||||
| [TDT] | [s] | [s] | [s] | [s] | [LD] | [∘] | [m] | |||||||
| 2004 TB10 | Earth | 1990 Apr 2.851 | 0.01 | 1900 | 2500 | 0.40 | 0.00 | 4.7 | 179.7 | 21.25 | 160 370 | |||
| 2004 TB10 | Moon | 1990 Apr 2.985 | 0.01 | 1200 | 1400 | 0.95 | 0.00 | 4.7 | 168.0 | 21.25 | 160 370 | |||
| 2003 SW130 | Earth | 1990 Sep 20.531 | 0.06 | 4600 | 5900 | 0.00 | 0.01 | 300 | 400 | 3.1 | 179.6 | 29.12 | 1 10 | |
| 2003 SW130 | Moon | 1990 Sep 20.870 | 0.05 | 4800 | 6100 | 0.95 | 0.00 | 3.7 | 174.0 | 29.12 | 1 10 | |||
| 2000 CK59 | Earth | 1991 Feb 8.776 | 0.01 | 18200 | 20000 | 0.95 | 0.00 | 17.0 | 179.8 | 23.97 | 40 100 | |||
| 1991 TU | Moon | 1991 Oct 7.279 | 0.31 | 2400 | 2700 | 0.92 | 0.00 | 2.5 | 176.2 | 28.41 | 1 10 | |||
| 2003 BM4 | Earth | 1995 Jul 29.158 | 0.01 | 15400 | 20400 | 0.99 | 0.00 | 33.0 | 179.8 | 24.68 | 20 60 | |||
| 1998 BT13 | Earth | 1998 Jan 23.374 | 1.00 | 3500 | 3600 | 0.93 | 0.00 | 6.9 | 179.6 | 26.36 | 20 | |||
| 1998 BT13 | Moon | 1998 Jan 23.915 | 1.00 | 3900 | 4000 | 0.98 | 0.00 | 7.2 | 173.2 | 26.36 | 20 | |||
| 1998 DX11 | Moon | 1998 Feb 23.615 | 1.00 | 2800 | 3000 | 0.98 | 0.00 | 5.5 | 173.0 | 27.06 | 10 20 | |||
| 1999 HC1 | Earth | 1999 Apr 18.970 | 1.00 | 6900 | 7400 | 0.79 | 0.00 | 8.7 | 179.7 | 24.48 | 30 80 | |||
| 1999 TM13 | Earth | 1999 Oct 3.950 | 1.00 | 31000 | 31100 | 0.98 | 0.00 | 31.0 | 179.8 | 23.58 | 30 70 | |||
| 2003 YT70 | Earth | 1999 Dec 6.974 | 0.01 | 42000 | 50700 | 0.97 | 0.00 | 21.8 | 179.8 | 25.55 | 20 40 | |||
| 2001 UC5 | Earth | 2001 Oct 21.724 | 1.00 | 4400 | 4600 | 0.98 | 0.00 | 24.2 | 179.8 | 21.32 | 160 370 | |||
| 2003 YT70 | Earth | 2001 Dec 6.699 | 0.03 | 39600 | 50100 | 0.97 | 0.00 | 22.2 | 179.8 | 25.55 | 20 40 | |||
| 2002 DQ3 | Earth | 2002 Mar 1.482 | 1.00 | 29400 | 29500 | 0.97 | 0.00 | 21.6 | 179.8 | 23.77 | 50 110 | |||
| 2002 VY91 | Moon | 2002 Nov 11.440 | 1.00 | 4300 | 4400 | 0.98 | 0.00 | 7.4 | 171.8 | 26.03 | 10 30 | |||
| 2005 ES70 | Earth | 2003 Mar 14.076 | 0.02 | 5600 | 6600 | 0.97 | 0.00 | 21.3 | 179.8 | 23.56 | 50 120 | |||
| 2003 LW1 | Earth | 2003 Jun 6.394 | 1.00 | 4900 | 5000 | 0.97 | 0.00 | 16.8 | 179.7 | 23.13 | 60 150 | |||
| 2003 SY4 | Earth | 2003 Sep 17.296 | 1.00 | 2100 | 2100 | 0.98 | 0.00 | 6.2 | 179.6 | 26.54 | 10 30 | |||
| 2003 UR25 | Earth | 2003 Oct 17.634 | 0.08 | 28700 | 38800 | 0.98 | 0.00 | 32.3 | 179.8 | 25.61 | 20 50 | |||
| 2003 UT55 | Moon | 2003 Oct 26.746 | 1.00 | 2000 | 2100 | 0.94 | 0.00 | 3.1 | 174.8 | 27.36 | 10 20 | |||
| 2003 WT153 | Earth | 2003 Nov 28.364 | 1.00 | 7800 | 7800 | 0.25 | 0.00 | 3.0 | 179.7 | 28.05 | 1 10 | |||
| 2003 YH111 | Earth | 2003 Dec 24.350 | 1.00 | 14700 | 15600 | 0.98 | 0.00 | 18.2 | 179.7 | 24.54 | 30 80 | |||
| 2004 HD | Earth | 2004 Apr 25.136 | 1.00 | 12200 | 12200 | 0.94 | 0.00 | 15.3 | 179.8 | 24.65 | 30 70 | |||
| 2004 SR26 | Moon | 2004 Sep 20.964 | 1.00 | 2900 | 3200 | 0.95 | 0.00 | 4.3 | 166.8 | 26.43 | 10 30 | |||
| 2004 ST26 | Moon | 2004 Sep 22.089 | 0.18 | 800 | 1200 | 0.00 | 0.04 | 400 | 500 | 1.1 | 117.2 | 26.37 | 10 30 | |
| 2001 SE270 | Earth | 2005 Sep 20.072 | 0.02 | 16500 | 20800 | 0.99 | 0.00 | 33.8 | 179.8 | 25.10 | 20 60 | |||
| 2003 YT70 | Earth | 2005 Dec 6.364 | 0.03 | 41000 | 51700 | 0.97 | 0.00 | 22.2 | 179.8 | 25.55 | 20 40 | |||
| 2004 YG1 | Earth | 2005 Dec 23.741 | 0.01 | 5800 | 8900 | 0.98 | 0.00 | 26.8 | 179.7 | 21.35 | 140 320 | |||
| 2000 TH1 | Earth | 2007 Oct 6.537 | 0.01 | 13200 | 17600 | 0.99 | 0.00 | 36.1 | 179.8 | 22.36 | 90 220 | |||
| 2003 YT70 | Earth | 2007 Dec 6.345 | 0.01 | 34500 | 51700 | 0.97 | 0.00 | 22.2 | 179.8 | 25.55 | 20 40 | |||
| 1998 SD9 | Earth | 2008 Sep 9.407 | 0.02 | 5900 | 7000 | 0.95 | 0.00 | 17.0 | 179.8 | 24.15 | 40 100 | |||
| 1998 VF32 | Earth | 2009 Nov 18.679 | 0.02 | 4700 | 6000 | 0.97 | 0.00 | 21.0 | 179.8 | 21.15 | 180 400 | |||
| 2001 FE90 | Earth | 2009 Jun 30.402 | 0.01 | 4700 | 5900 | 0.80 | 0.00 | 8.4 | 179.8 | 19.81 | 330 730 | |||
| 2001 FE90 | Moon | 2009 Jun 30.632 | 0.02 | 4200 | 4800 | 0.99 | 0.00 | 8.6 | 173.3 | 19.81 | 330 730 | |||
| 2003 YT70 | Earth | 2009 Dec 6.178 | 0.01 | 41400 | 53000 | 0.97 | 0.00 | 22.9 | 179.8 | 25.55 | 20 40 | |||
| 2000 TU28 | Earth | 2010 Oct 16.730 | 0.02 | 12300 | 13200 | 0.98 | 0.00 | 30.0 | 179.8 | 20.42 | 190 420 | |||
| 2001 LB | Earth | 2012 Jun 11.647 | 0.01 | 9600 | 10800 | 0.98 | 0.00 | 30.6 | 179.8 | 20.77 | 200 460 | |||
| 2004 YA5 | Earth | 2012 Dec 21.583 | 0.01 | 4600 | 7300 | 0.99 | 0.00 | 31.2 | 179.8 | 22.58 | 90 200 | |||
| 1997 WQ23 | Earth | 2013 Nov 18.320 | 0.01 | 61000 | 70000 | 0.99 | 0.00 | 34.1 | 179.8 | 20.39 | 230 530 | |||
| 2004 BL86 | Earth | 2015 Jan 27.205 | 0.04 | 1500 | 1900 | 0.05 | 0.00 | 3.6 | 179.6 | 18.88 | 500 1100 | |||
| 2004 BL86 | Moon | 2015 Jan 27.337 | 0.03 | 900 | 1200 | 0.93 | 0.00 | 3.7 | 164.4 | 18.88 | 500 1100 | |||
| 2002 LY1 | Earth | 2016 May 29.100 | 0.13 | 14300 | 18300 | 0.99 | 0.00 | 38.2 | 179.8 | 21.92 | 120 280 | |||
| 2004 SS | Earth | 2017 Sep 24.522 | 0.01 | 6300 | 9100 | 0.92 | 0.00 | 13.5 | 179.7 | 21.95 | 110 260 | |||
| 2002 CB19 | Earth | 2018 Feb 7.188 | 0.02 | 6000 | 8300 | 0.96 | 0.00 | 17.8 | 179.8 | 24.76 | 30 60 | |||
| 1999 LK1 | Earth | 2018 May 21.361 | 0.09 | 8400 | 10100 | 0.96 | 0.00 | 19.8 | 179.8 | 22.11 | 110 250 | |||
| 2001 GP2 | Earth | 2020 Oct 6.662 | 0.01 | 8600 | 9500 | 0.00 | 0.01 | 4200 | 5000 | 1.1 | 179.3 | 26.88 | 10 20 | |
| 2001 GP2 | Moon | 2020 Oct 7.075 | 0.01 | 3800 | 3900 | 0.78 | 0.00 | 1.8 | 151.0 | 26.88 | 10 20 | |||
| 2003 AF23 | Earth | 2021 Jan 7.156 | 0.03 | 4800 | 6100 | 0.96 | 0.00 | 19.2 | 179.8 | 20.58 | 210 480 | |||
| 2004 FH | Earth | 2021 Feb 20.918 | 0.96 | 3800 | 9200 | 0.98 | 0.00 | 25.0 | 179.7 | 26.39 | 20 40 | |||
| 2000 PN8 | Earth | 2021 Aug 15.655 | 0.01 | 8700 | 11000 | 0.99 | 0.00 | 35.0 | 179.8 | 22.13 | 100 240 | |||
| 1999 FJ21 | Earth | 2021 Oct 12.873 | 0.02 | 7200 | 9200 | 0.98 | 0.00 | 27.0 | 179.8 | 20.59 | 220 510 | |||
| 23606 | Earth | 2022 Jul 19.642 | 1.00 | 15900 | 16600 | 0.99 | 0.00 | 39.8 | 179.8 | 18.47 | 600 1300 | |||
| 2004 UT1 | Moon | 2022 Oct 25.182 | 0.05 | 9800 | 12300 | 0.98 | 0.00 | 6.7 | 179.4 | 26.43 | 10 30 | |||
| 2004 UT1 | Earth | 2022 Oct 25.238 | 0.06 | 9400 | 11300 | 0.70 | 0.00 | 6.6 | 179.7 | 26.43 | 10 30 | |||
| 2001 LB | Earth | 2023 Jun 12.402 | 0.01 | 10300 | 10800 | 0.98 | 0.00 | 30.6 | 179.8 | 20.77 | 200 460 | |||
| 2000 YS134 | Earth | 2023 Dec 29.199 | 0.15 | 11100 | 14800 | 0.97 | 0.00 | 23.3 | 179.8 | 23.24 | 70 160 | |||
| 2005 FG | Earth | 2024 Mar 16.098 | 0.01 | 17100 | 28100 | 0.99 | 0.00 | 33.3 | 179.8 | 24.00 | 50 110 | |||
| 99942 | Moon | 2029 Apr 14.132 | 0.74 | 1900 | 2500 | 0.00 | 0.06 | 250 | 350 | 0.35 | 17.1 | 19.17 | 430 970 | |
| 2003 AF23 | Earth | 2030 Jan 7.410 | 0.02 | 4400 | 6100 | 0.96 | 0.00 | 19.1 | 179.8 | 20.58 | 210 480 | |||
| 2005 CD69 | Earth | 2030 Feb 25.433 | 0.01 | 30300 | 30800 | 0.95 | 0.00 | 17.0 | 179.8 | 24.11 | 40 90 | |||
| 2003 WT153 | Earth | 2030 Nov 17.881 | 0.34 | 12700 | 15000 | 0.91 | 0.00 | 12.9 | 179.8 | 28.05 | 1 10 | |||
| 2005 BC | Earth | 2034 Jul 15.295 | 0.01 | 4000 | 5200 | 0.96 | 0.00 | 20.0 | 179.8 | 18.12 | 700 1500 | |||
| 2002 AB2 | Earth | 2039 Jan 3.978 | 0.01 | 10300 | 12200 | 0.99 | 0.00 | 35.1 | 179.8 | 22.99 | 60 140 | |||
| 2004 ER21 | Earth | 2039 Mar 18.246 | 0.04 | 10900 | 13500 | 0.97 | 0.00 | 20.1 | 179.8 | 24.29 | 30 80 | |||
| 1999 VX25 | Moon | 2040 Nov 13.616 | 0.01 | 7800 | 8600 | 0.98 | 0.00 | 8.0 | 173.6 | 26.70 | 10 30 | |||
| 1999 VX25 | Earth | 2040 Nov 14.063 | 0.01 | 11400 | 12500 | 0.78 | 0.00 | 7.9 | 179.7 | 26.70 | 10 30 | |||
| 2005 KA | Moon | 2042 May 4.445 | 0.01 | 2900 | 3300 | 0.93 | 0.00 | 4.7 | 178.3 | 24.73 | 30 70 | |||
| 2005 KA | Earth | 2042 May 5.035 | 0.01 | 5600 | 7300 | 0.40 | 0.00 | 4.7 | 179.7 | 24.73 | 30 70 | |||
| 1997 YM9 | Earth | 2044 Dec 26.292 | 0.01 | 12300 | 14100 | 0.93 | 0.00 | 13.5 | 179.8 | 24.77 | 30 60 | |||
| 2000 LF3 | Earth | 2046 Jun 12.814 | 0.01 | 2600 | 2800 | 0.27 | 0.00 | 4.3 | 179.7 | 21.57 | 140 320 | |||
| 2004 DK1 | Earth | 2045 Apr 29.258 | 0.01 | 65200 | 81800 | 0.99 | 0.00 | 33.3 | 179.8 | 21.05 | 170 380 | |||
| 2001 QJ142 | Earth | 2047 Sep 26.214 | 0.03 | 25500 | 29500 | 0.99 | 0.00 | 37.3 | 179.8 | 23.42 | 60 130 | |||
Note. — Near Earth Asteroids eclipsed by Earth and Moon in the period 1990-2050, sorted by epoch. Probability , mean and maximum time , averaged over the VAs experiencing the eclipse, are reported for penumbra and umbra eclipses. The average Earth distance and Solar elongation are also showed. For penumbra eclipses, the minimum Solar Disk Fraction is also provided. The eclipse epoch is referred to the minimum of in case of a partial eclipse, or to the central moment for a total eclipse. Asteroid diameters are obtained from the Near-Earth Asteroids Data Base, European Asteroid Research Node (http://earn.dlr.de/). The absolute magnitude is obtained from the NEODyS server (Chesley & Milani, 2000). This list is limited to eclipses within 40 LD from the Earth and 10 LD from the Moon, with 0.01 and min() 0.99.
| asteroid | object | discovery epoch | eclipse epoch | t |
|---|---|---|---|---|
| [TDT] | [TDT] | [day] | ||
| 1991 TU | Moon | 1991 Oct 7.310 | 1991 Oct 7.279 | -0.031 |
| 1998 BT13 | Earth | 1998 Jan 24.403 | 1998 Jan 23.374 | -1.029 |
| 1998 BT13 | Moon | 1998 Jan 24.403 | 1998 Jan 23.915 | -0.488 |
| 1998 DX11 | Moon | 1998 Feb 23.352 | 1998 Feb 23.615 | 0.263 |
| 1999 HC1 | Earth | 1999 Apr 16.311 | 1999 Apr 18.970 | 2.659 |
| 1999 TM13 | Earth | 1999 Oct 5.287 | 1999 Oct 3.950 | -1.337 |
| 2001 UC5 | Earth | 2001 Oct 20.251 | 2001 Oct 21.724 | 1.473 |
| 2002 DQ3 | Earth | 2002 Feb 22.405 | 2002 Mar 1.482 | 7.077 |
| 2002 VY91 | Moon | 2002 Nov 12.227 | 2002 Nov 11.440 | -0.787 |
| 2003 LW1 | Earth | 2003 Jun 3.308 | 2003 Jun 6.394 | 3.086 |
| 2003 SY4 | Earth | 2003 Sep 17.291 | 2003 Sep 17.296 | 0.005 |
| 2003 UR25 | Earth | 2003 Oct 25.200 | 2003 Oct 17.634 | -7.566 |
| 2003 UT55 | Moon | 2003 Oct 26.938 | 2003 Oct 26.746 | -0.192 |
| 2003 WT153 | Earth | 2003 Nov 29.315 | 2003 Nov 28.364 | -0.951 |
| 2003 YH111 | Earth | 2003 Dec 27.301 | 2003 Dec 24.350 | -2.951 |
| 2004 HD | Earth | 2004 Apr 16.199 | 2004 Apr 25.136 | 8.937 |
| 2004 SR26 | Moon | 2004 Sep 22.234 | 2004 Sep 20.964 | -1.270 |
| 2004 ST26 | Moon | 2004 Sep 23.285 | 2004 Sep 22.089 | -1.196 |
Note. — Near Earth Asteroids experiencing an eclipse during the same close approach relative to their discovery. See Section 3.7 and Figure 8 for more details. The case of 2003 SY4 is slightly different from all the other eclipses in this table: part of the discovery observations were made during the eclipse, see Section 3.4.