A Faraday Rotation Search for Magnetic Fields in Large Scale Structure
Abstract
Faraday rotation of radio source polarization provides a measure of the integrated magnetic field along the observational lines of sight. We compare a new, large sample of Faraday rotation measures (RMs) of polarized extragalactic sources with galaxy counts in Hercules and Perseus-Pisces, two nearby superclusters. We find that the average of RMs in these two supercluster areas are larger than in control areas in the same galactic latitude range. This is the first RM detection of magnetic fields that pervade a supercluster volume, in which case the fields are at least partially coherent over several megaparsecs. Even the most conservative interpretation of our observations, according to which Milky Way RM variations mimic the background supercluster galaxy overdensities, puts constraints on the IGM magneto-ionic “strength” in these two superclusters. We obtain an approximate typical upper limit on the field strength of about G (500 kpc), when we combine our RM data with fiducial estimates of electron density from the environments of giant radio galaxies, and of the warm-hot intergalactic medium (WHIM).
Subject headings:
intergalactic medium — magnetic fields — plasmas — Faraday rotation – radio continuum:galaxies — large scale structure1. Introduction
The detection of a magnetized intergalactic medium (IGM) at levels of a few G within clusters of galaxies (Kim et al. 1990, Kim et al. 1991, Feretti et al. 1995, Clarke et al. 2001) raises the question of what IGM magnetic fields might be detectable in the wider intergalactic medium, well beyond galaxy clusters themselves, but within galaxy overdense “filaments” of large scale structure (LSS). The recent, much improved definition of filament-like galaxy distributions in the Sloan Digital Sky Survey (SDSS)(Abazajian et al. 2003, 2004, 2005), in addition to the more nearby Two Micron All Sky Survey (2MASS)(2MASS Team 2003) and the second Center for Astrophysics galaxy redshift survey (CfA2)(CfA2 Team 1998) at makes it easier to identify galaxy overdense filaments. In the local Universe, to which the two latter surveys apply, the superclusters’ larger angular extent encompasses an optimally large number of radio sources with measured Faraday rotations.
This paper describes an attempt, using the best RM data so far available, to detect an RM signal due to an associated intergalactic magneto-ionic medium in the Hercules, Virgo, and Perseus-Pisces superclusters of galaxies. As discussed below, different theoretical arguments and simulations cover a wide range of predictions, thus strongly motivating the task of obtaining possible constraints from direct observations.
2. Arguments for and observations in support of a widespread intergalactic magneto-plasma
2.1. Proposed early magnetic field generation and amplification in the course of LSS evolution
Magnetic field seeding in the primeval intergalactic medium has been proposed by Harrison (1970), in which chaotic motions of charged particles can seed an initial magnetic field by a Biermann Battery-like process (Biermann 1950). More recent calculations by Gnedin, Ferrara & Zweibel (2000) proposed to explain how the breakout of ionization fronts from protogalaxies and their propagation through hypothesized dense neutral filaments in the evolving web of large scale structure can also generate, and amplify an intergalactic magnetic field before . Essentially in the magnetic induction equation is positive, so that weak pre-stellar intergalactic fields in effect convert kinetic into magnetic energy. An IGM field during and after formation of the first galaxies is a natural consequence of early galaxy star-driven outflow, as modeled by Kronberg, Lesch, & Hopp (1999), especially earlier than . Analogous models by Furlanetto & Loeb (2001) for black hole/jet driven outflow have been shown to have a similar IGM magnetic field seeding effect at earlier epochs.
Space-filling fields at early epochs can be considered as seed fields to incorporate into computational models of large scale structure (LSS) evolution. The intergalactic fields could be amplified in the course of gravitational collapse of baryonic and dark matter into the “filaments” of large scale structure, essentially converting gravitational infall energy into magnetic energy. The combination of shearing and shocks have been calculated by some authors (e.g., Ryu et al. 1998) to generate magnetic fields up to 0.1 G in these intergalactic filaments. Up to now, there has been no observational verification of the actual field strengths in large scales in filaments. Indeed, independent LSS evolution simulations by other groups (e.g., Dolag et al. 2005) arrive at very low LSS IGM magnetic field strengths, too weak to be detectable in our present Faraday rotation data. Remaining uncertainties in the detailed physics of these difficult simulations underline the importance of direct observational tests, one of which we describe in this paper.
2.2. Black hole seeded intergalactic magnetic fields and cosmic rays
A very different source of IGM magnetization originates in the reservoir of gravitational infall energy in galactic central black holes (e.g., Kronberg et al. 2001). The average comoving density of galactic black holes (BH) in the mature universe is estimated at M⊙/Mpc3 and they are widespread in the population of galaxies (e.g., Gebhardt et al. 2000). When we combine this fact with the radio source evidence that central BH - driven jets and radio lobes convert a substantial fraction of the BH formation energy into magnetic fields that are transferred to the IGM via radio lobes (e.g., Kronberg et al. 2001), the BH-generated magnetic field strengths in galaxy walls and filaments is estimated to be of order 0.1 G or more (Colgate and Li 2004).
Independent calculations of the BH photon energy release during the quasar epoch near have been made by Soltan (1982), Small & Blandford (1992), and Chokhsi & Turner (1992). The efficiency of conversion of the presumed central BH infall energy to photon energy released is remarkably high, a few tens of percent. Analyses of giant radio galaxies (GRGs) show that the conversion efficiency of this BH infall energy into magnetic energy is comparably high (Kronberg et al. 2001, 2004), i.e. the magnetic energy, cosmic ray energy and photon energy released into the IGM are comparable.
2.3. Estimates of a detectable LSS RM signal based on analyses of Mpc scale BH-powered radio sources
The Faraday rotation through an intergalactic region permeated by a magnetic field and thermal (non-relativistic) gas is
| (1) |
Over a dimension Mpc, containing a 1 G field and having cm-3, the estimated RM rad m-2. The RM would be reduced by where is the number of field reversals over a line of sight through the supercluster. The outer lobes of GRGs (1 Mpc) contain at least partially aligned fields over at least a fraction of a megaparsec (e.g., Kronberg, Wielebinski & Graham 1986, Mack et al. 1997). Similar evidence is provided by the peripheral regions of the synchrotron-emitting cosmic ray halos of some galaxy clusters (Clarke & Enßlin 2005). These facts suggest that some early component of large scale ordering existed within typical supercluster volumes.
Information on the plasma densities from direct observation can be gleaned from detailed, multifrequency observations of a few GRGs having dimensions up to Mpc. Several such systems have established RM variations that probe the “ambient” intergalactic medium within Mpc of the radio source and give estimates of . Typically, - cm-3 for the ambient IGM on 1-3 Mpc scales around the GRGs, and magnetic field strengths, based on the assumption of particle/field energy equipartition are close to 1 G (e.g. Willis & Strom 1978, Strom & Willis 1980, Kronberg, Wielebinski and Graham 1986). Magnetic field strengths at these levels are independently consistent with values of G estimated by Kim et al. (1989) from very low levels of intergalactic synchrotron emission at 0.3 GHz that they detected in the IGM out to Mpc from the Coma cluster of galaxies.
The above measurements lead us to estimate possible RMigm values from a supercluster environment that could be as high as 20 rad m-2 in an optimistic scenario, for a typical supercluster pathlength scale of Mpc, cm-3, and G. It is more likely that RM contributions from LSS are typically less than 20 rad m-2, but some fraction of this RM could be detectable, depending on our ability to remove Galactic foreground RM, and this is what motivates us to attempt it.
3. Data and analysis tools
3.1. Faraday Rotation Measure Data
We have used an augmented version of the extragalactic source Faraday rotation measures published by Simard-Normandin, Kronberg and Button (1981). The number of RMs that are suitable for our LSS filament probes is roughly double that in the Simard-Normandin, Kronberg & Button catalog of 1981. The accuracy of some of the RMs has also been improved in the present analysis by the addition of more radio polarization measurements. We omitted the very few RM sources that are in front of the local superclusters so as to have only background RM “illuminators” of the supercluster medium.
We define the supercluster boundaries using optical galaxy counts as explained further below. Because Faraday rotations of radio galaxies and quasars at are commonly affected by optically unseen intervening systems and source-intrinsic evolutionary effects (Kronberg & Perry 1982, Welter, Perry & Kronberg 1984, Athreya et al. 1998) we have omitted the RMs of most sources that are at large redshift since they, as expected, show RM anomalies that are unrelated to the RM-weak, local universe intervenors that that we wish to probe. We also removed RMs of all sources lying within 7∘ of the Galactic plane because of the strong RM perturbations due to the Milky Way. Finally, since galaxy clusters are known to perturb the Faraday rotations of radio sources within and behind them (Kim et al. 1990, 1991, Clarke et al. 2001), we have removed RM sources within 0.5∘ of known galaxy clusters.
The increased numbers of Faraday RMs now available to us are sufficiently large that we have for the first time, relatively good sky coverage behind and beside the local superclusters. We used two RM subsets, (i) sources with known , and (ii) a comparable number of sources with unknown , but from which we have rejected a small number of anomalous values which could be due to high effects or intermediate redshift clusters. The second sample is comparable in size to the first, and gives us substantially more sources at the expense of some possible high- effect “pollution”. Consequently we combined the two subsets in all subsequent analysis, and have “cleaned” out statistically deviant high RMs.
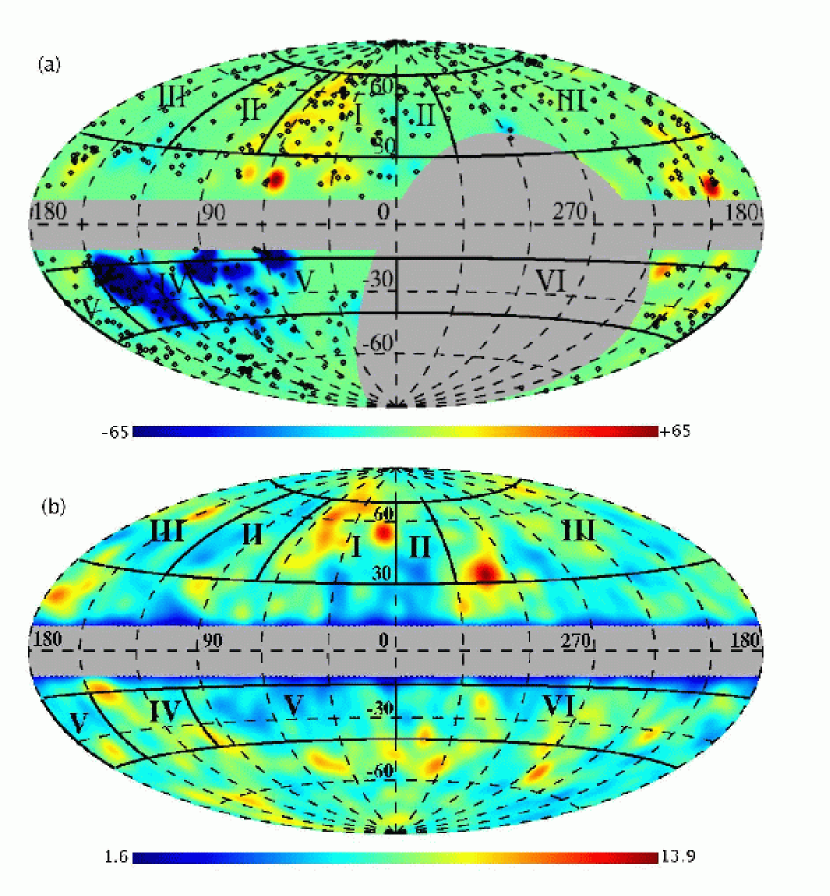
We distinguish between two kinds of RMs: the individual measured source RMs and the smoothed RM (SRM). The latter are a combination of galactic features and, possibly, given the “expectation” arguments outlined above, degree-scale contributions from local-universe large scale structure. SRMs are obtained by averaging individual RMs within a circle of a radius of , centered on the sources. The SRM smooths out small-scale RM fluctuations due to the radio sources, and should mainly contain information on magnetic fields from large angular scale structures. In order to display the SRM variations more clearly and to compare with the superclusters visually, we Gaussian-smooth the SRMs to a 7-degree scale, to match the smoothing scale for the 2MASS data; A 7-degree smoothing is sufficient to clearly display the supercluster profiles. The upper panel of Fig. 1 shows a plot of the Gaussian-smoothed distribution of the radio source SRMs for the galactic sky that are relevant to the present analysis. The black points show the positions of the individual sources used in the SRM calculation. The colorbar gives the scale for our best estimate of the SRM over the sky. In order to more clearly illustrate the contrast of the lower SRMs, we saturated the SRM color scale at rad m-2 and rad m-2 in blue or red respectively. The larger SRMs extended to rad m-2. The southern sky below -25∘ is excluded because of the lower angular density of RMs, hence less well-determined SRMs. We also exclude the area near the galactic equator, i. e., , due to the strong galactic contribution to SRM (Simard-Normandin & Kronberg 1980).
3.2. The CfA2 and 2MASS Galaxy Surveys
We have utilized two sets of galaxy survey data for our analysis, the second Center for Astrophysics survey and the Two Micron All Sky Survey.
The second Center for Astrophysics (CfA2) Redshift Survey covers the whole northern celestial hemisphere, and has measured redshifts of about 18,000 bright galaxies with apparent blue magnitude less than 15.5. This survey captures the three-dimensional properties of the large-scale structures in the nearby universe (), which is very useful for RM-LSS cross-correlation analysis (CfA2 Team 1998).
The Two Micron All Sky Survey (2MASS) has covered 99.998% of the sky observed from both northern and southern 2MASS observation sites (2MASS Team 2003). The 2MASS has three infrared cameras in the J ( m), H ( m), and Ks ( m) bands. Near-infrared observations are useful for lines of sight near the Galactic Plane since the extinction due to the interstellar medium at near-infrared wavelengths is only about one-tenth of that at optical wavelengths. The all-sky data release from 2MASS includes 470,992,970 point sources and 1,647,599 extended sources or galaxies in the nearby universe. In order to keep the data uniform, we only use those extended sources with apparent Ks-band magnitude brighter than 14.5 (i.e., ). This still leaves 1,312,603 extended sources for our analysis.
The 2MASS contains only two-dimensional information of LSS, while the CfA2 contains three-dimensional information. Therefore, as described in Subsections 4.1 and 4.2 in detail, we use different tools to analyze the data from the two surveys. For 2MASS, we compare the column density with RMs, calculated using the HEALPix algorithm (section 4.1), whereas for CfA2, we use the Voronoi tessellation method, described next.
3.3. 3D Voronoi Tessellation
Voronoi Tessellation (VT) is a robust tool for calculating number densities in two-, three- or higher-dimensional spaces. Here, we use a very efficient VT algorithm, QHULL (Barber, Dobkin & Huhdanpaa 1996), to calculate the galaxy number density in the CfA2 catalog. The procedure is summarized below.
First, using QHULL, we construct the entire volume of the CfA2 catalog with a number of Voronoi Diagrams (VDs). Each VD corresponds to a galaxy in this catalog. The VD of a given galaxy is a convex hull bounded by a series of planes that bisect the segment between this galaxy and its neighbors. In consequence, any query point inside this VD is closer to this galaxy than any other galaxy. The “proprietary volume” of a galaxy is that of its VD (Icke & van de Weygaert 1987). The local galaxy number density is the inverse of its volume, i.e., , where and are the number density and volume for the -galaxy. The overdensity of a galaxy is defined as
| (2) |
where is splined from , which is the mean number density at a given redshift bin at . The rotation measure should relate to both the galaxy number density and path length of a radio ray passing through a portion of large-scale structure volume. Due to the survey selection function, the mean number density depends strongly on galaxy redshift. In order to eliminate the effect of this selection function, we employ an estimator of the galaxy overdensity by effectively normalizing out the survey selection function. The overdensity describes the relative fluctuations of galaxy density, therefore in principle it should not depend on redshift. At this point we are in a position to use the overdensity of galaxies for our correlation analysis.
3.4. Pathlength and weighted pathlength
Aside from the overdensity, another important parameter is the pathlength of radio sources through the superclusters. First, we need to ascertain whether the line of sight to a radio source passes through superclusters. Second, we need to calculate the effective pathlength. Since we have tessellated the superclusters into a large number of VDs, the pathlength to a radio source is the sum of lengths inside the VDs that radiation from the source passes through, i.e.,
| (3) |
where is the pathlength, and is the length inside the VD which radiation from radio source passes through. We also introduce a related parameter, the weighted pathlength, , which is the sum of the product of overdensity and length inside VDs:
| (4) |
where is the overdensity of the VD which the radio source passes through. As defined in Eqn. 2, overdensity is a linear function of the real galaxy number density, Hence, the product of overdensity and pathlength is a linear function of galaxy column density at the specific VD.
4. Results and Discussion
In order to correlate the RMs of radio sources with galaxy overdensity in nearby superclusters, it is crucial to find a way to identify those superclusters or local filaments of large-scale structure. We have developed a fast algorithm to identify superclusters after tessellating all galaxies in the CfA2 catalog. The algorithm will be described elsewhere (Xu 2005). The basic idea is to find structures (or continuous Voronoi Diagrams) with overdensities in a certain range. For CfA2, we found that an overdensity larger than 2 sets a very reasonable threshold to identify superclusters. Using this algorithm, we successfully identified and defined 9 nearby supercluster candidates.
Out of 9 supercluster candidates that we initially identified in the CfA2 catalog, only the Perseus-Pisces, Hercules, and Virgo superclusters give a sufficiently large angular coverage in a favorable part of the galactic sky, with a sufficiently good match of galaxy column density and angular RM coverage on the sky. This is needed to ensure that we have a sufficient number of radio sources in those sky areas to statistically analyze the data. The Virgo supercluster is the least favorable of these three, being inconveniently close to us, hence distributed over a very large area of sky, so that galactic foreground RM effects are more difficult to remove. Further, the low angular number density of Virgo supercluster galaxies is relatively more contaminated by background galaxies. Therefore, we compare the RMs with 2MASS data only for the Perseus-Pisces and Hercules superclusters, although we did attempt the VD method for Virgo (Fig. 2).
In this analysis it is important to recall that “foreground” SRM features due to the Milky Way probably exist at some level at the higher galactic latitudes where our superclusters lie. Our search for an RM signal from local supercluster fields can therefore only rely on detailed correlations between zones of galaxy overdensity and of the SRM. The (reasonable) premise here is that Milky Way-induced SRMs are not correlated with extragalactic magnetized regions. Even if galactic intergalactic superpositions exist at weak RM levels we can, at minimum, set the first useful upper limits to SRM contributions from supercluster zones. Such upper limits are interestingly close to the predictions of theoretical calculations, as discussed in Section 3.
There is an intriguing juxtaposition of a Milky Way and extragalactic RM contribution in Region A, a well-known anomaly in the RM sky (Simard-Normandin & Kronberg 1980). Region A, the huge negative RM zone located in and [see the large deep blue area in Fig. 1(a)], overlaps in part with the Perseus-Pisces supercluster, but has a greater overall angular extent. As we discuss below, there is a weak, but positive correlation (Table 1) between the SRM and galaxy overdensity in this zone. If this correlation is not being (perversely) masked by galactic effects, it would indicate that ordered magnetic fields in the Perseus-Pisces supercluster maintain the same prevailing sense on megaparsec scales. Unfortunately firm conclusions on this question cannot yet be drawn because of possible “interference” by the Milky Way foreground RM. Alternatively stated, the P-P supercluster filament “rides” on the large negative RM zone of region A. One possible interpretation is that the P-P supercluster contribution to the SRM (Fig. 1) contains a positive RM component that is not strong enough to overwhelm the galactic RM contribution in this same area.
The RM region A does not appear to correlate with other known large scale features of the galactic sky, such as the HI column density, diffuse galactic synchrotron emission, gamma rays, etc. The galactic feature that does generally coincide with region A is the diffuse 45m radiation, due presumably to galactic dust (Schlegel, Finkbeiner & Davis 1998). It is further salutary that the RMs in Region A are predominantly negative, which conforms to the prevailing direction of the interstellar field in the Sun’s vicinity. However this fact by itself need not necessarily refute the existence of a mixed galactic/extragalactic origin for the anomalous Region A.
4.1. Correlation between RMs and 2MASS Data
2MASS is an all-sky photometric survey with three infrared cameras. An easy way to calculate the 2MASS galaxy number density is to pixelize the all-sky data appropriately. Pixels corresponding to the location of large-scale structures should have a higher number density of galaxies. The public software package Hierarchical Equal Area isoLatitude Pixelization (HEALPix) of the sphere (Górski, Hivon, & Wandelt 1999) is well-suited to this purpose. We pixelize the 2MASS data into cells. Since each pixel has the same area, we need concern ourselves only with the number of galaxies in each pixel. In order to obtain a continuous density field, we smooth the galaxy column density () onto a scale to eliminate discontinuities on very small scales. After smoothing, the mean galaxy number in each pixel is around 7. Therefore, we classify the number density into three ranges: an underdense range (), one sigma higher than the mean density range (), and an overdensity range ().
| Sky Area | Galaxy Density Range | SRM mean |
| [rad m-2] | ||
| all | ||
| Hercules Area I, 50 sources | 14.8 | |
| (, ) | 15.9 | |
| 12.9 | ||
| all | ||
| Hercules Comparison Area II | 8.7 | |
| ( or , ), 30 sources | 10.9 | |
| all | ||
| Hercules Comparison Zone, Area I+II+III, 154 sources | 11.4 | |
| (, ) | 8.7 | |
| 10.5 | ||
| all | ||
| Perseus-Pisces Area IV, 45 sources | 65.7 | |
| (, ) | 53.5 | |
| 55.5 | ||
| all | ||
| Perseus-Pisces Comparison Area V, 42 sources | 49.4 | |
| ( or , ) | 32.6 |
To illustrate the nearby superclusters more clearly, we Gaussian-smooth on a scale of 7 degrees as shown in the lower panel of Fig. 1. The Hercules and Perseus-Pisces superclusters constitute the high density parts labeled I and IV, respectively. Labels II and III indicate the (low galaxy density) RM comparison zones for region I in the same Galactic latitude ranges (); Label V indicates the comparison zone of region IV (). We do not use region VI since the RM data there are less complete.
As estimated in Section 2.3, RM values from a supercluster environment might be as high as 20 rad m-2. If we assume that is proportional to the pathlength of radio sources through large-scale structures, and that is constant, we would expect positive correlations between RMs and . Due to the unknown complexity of alignment and reversal scale of the IGM magnetic field, it is hard to find a direct correlation between the absolute RMs and galaxy counts in the corresponding pixels. However, we may expect that the mean values of absolute RMs in a supercluster area should be larger than in other areas without superclusters. Due to the magnetic field of the Galaxy, however, observed SRMs strongly depend on the galactic latitude (Simard-Normandin & Kronberg 1980). We therefore analyze the RM data in two corresponding spherical rings (see Table 1 and Fig. 1). Table 1 lists mean values of absolute SRM of the various areas classified above. We have filtered out zones of anomalously high local galaxy density, so as to avoid contamination by e.g. galaxy clusters.
For the Hercules supercluster zone we find that over its entire area the mean SRM is consistently larger than in the two comparison zones. It is close to, but does not coincide with the North Galactic Spur (Haslam et al. 1982). This systematic difference also holds for each subrange of galaxy density (Table 1). However, whereas there is a global correlation of enhanced SRM with the overall boundary of the Hercules supercluster, the detailed locations at 7∘ resolution of maxima in smoothed galaxy column density with those of the SRM [comparing Figs. 1(a) and (b)] do not correspond exactly. This is also reflected in the plot of weighted pathlengths (Section 3.4) against RM in Fig. 2, in which we used the VD method and the CfA2 data (Section 4.2). We can interpret the combination of these two results to indicate that an RM component is generated in the Hercules supercluster, but if so, most ordered magnetic field regions avoid the zones of highest galaxy density. This conclusion must remain tentative until we better understand the galactic foreground RM (which may also play some role, as suggested by the galactic pulsar RMs). A future higher density of pulsar RMs is most crucially needed to clarify the decomposition of galactic and supercluster RM contributions in this high latitude zone.
In the case of the Perseus-Pisces supercluster, the SRMs within the overall supercluster boundary are similarly larger, again for all galaxy density regimes (Table 1). In contrast to the Hercules supercluster, there is also a suggestion of a positive correlation on smaller scales between SRM and galaxy density. This is seen both in Fig. 1, and in the plots (Fig. 2) of vs. SRM.
For the Virgo supercluster, we find no evidence for a correspondence on any smoothed scale (Figs. 1 and 2).
4.2. Correlation between RMs and CfA2 data

The CfA2 galaxy redshift survey covers the northern celestial sky. Using the Voronoi Tessellation technique mentioned in Section 3.3 and in Xu (2005), we identify galaxy superclusters in the CfA2 catalog. Then, from Eqns. 3-4, we calculate the real pathlength and weighted pathlength of the -th radio source passing through the supercluster. Although has the dimension of length, it is a linear function of galaxy number column density, which we assume is proportional to the column density of thermal electrons in the IGM. The RM is proportional to the electron column density and the line of sight component of the magnetic field (Cf. Eqn. 1). Therefore, we expect a positive correlation between RMs and . Fig. 2 shows plots of weighted pathlength vs. source RM and SRM respectively. The left three panels, from top to bottom, show the relation of and source RM in Hercules, Perseus-Pisces, and Virgo superclusters respectively, and the right three panels show the relation of and SRM in those three superclusters. We find that the is positively correlated to the fluctuations of absolute SRM in the Perseus-Pisces supercluster, but that there are no such correlations in the other two superclusters (see above).
4.3. RM data vs. RM expectations in the Hercules supercluster
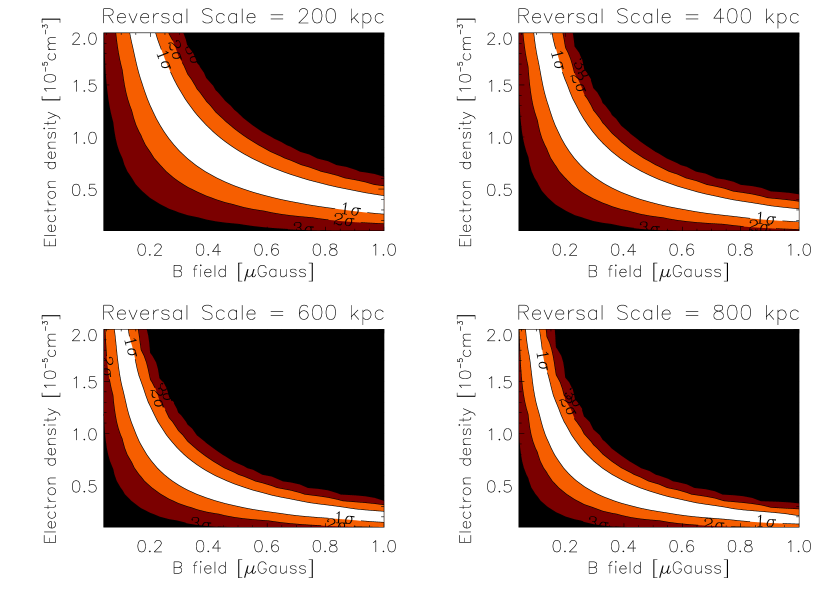
In Section 2.3, it was roughly estimated that the RM in a supercluster may reach rad m-2, scaled to Mpc, cm-3, and G, by using the simple model described in Eqn. 1 and the related text in Section 2.3. RMs estimated from this model are designated as MRMs. Comparing these MRMs with the measured SRMs, we put constraints on the IGM magnetic fields and electron density. The detailed procedure is described as follows. First, we use the simple model to estimate MRMs of all radio sources in the Hercules supercluster for different magnetic field reversal scales by varying and . Second, we calculate the of each given pair of and , for a given -field reversal scale. Specifically,
| (5) |
where is the total number of radio sources passing through the Hercules supercluster. Third, as usual, the corresponding normalized likelihood is defined as , where the is the minimum of a certain pair of and . Finally, we may derive the , , and contours from likelihood values equal to 0.607, 0.135, and 0.011 respectively as shown in Fig. 3. From the calculated likelihood, we obtain constraints on the magnetic field and the thermal electron density. The four panels in Fig. 3 show the constraints on and for magnetic field reversal scales of 200, 400, 600, and 800 kpc respectively. The constraints have the expected dependence on the reversal scales, the larger reversal scales yielding a lower-magnetic-field constraint with a given electron density. This follows straightforwardly from Eqn. 1. Fig. 3 illustrates how the -field, reversal scale, and are strongly degenerate. Independent measurements are needed to help break this degeneracy. For instance, the most recent warm-hot IGM (WHIM) observations imply a hydrogen density of cm-3 (Nicastro et al. 2005a, b). If we combine this global estimate with our results here, we obtain -field constraints of G () and G () with reversal scales of 400 kpc and 800 kpc respectively. Here, we use the SRMs as distinct from the RMs generated by the medium in the filaments. Since the SRMs may contain a Milky Way component, the absolute values of SRMs are statistically larger than the RMs generated in the filaments. In this sense, the constraints shown in Fig. 3 should be considered as upper limits for the magnetic fields in filaments.
5. Summary and conclusion
We have performed the first search for intergalactic magnetic fields in three galaxy-overdense zones of the nearby universe: the Virgo, Hercules, and the Perseus-Pisces superclusters of galaxies. We have compared our results with simplified model expectations of IGM magnetic fields and intergalactic thermal gas, the latter being represented by the WHIM. Algorithms were developed to calculate zones of galaxy overdensity in these three areas using the 2MASS and CfA2 galaxy survey data, and combined with new Faraday rotation measures.
Our results are summarized as follows:
(1) The large angular extent of the Virgo supercluster combined with its relatively low galaxy surface density make any Faraday RM contribution difficult to distinguish from small variations in the foreground RM of our Galaxy. We obtain a null result with the best available data on RM and galaxy counts, which have inadequate signal-to-noise for the purpose.
(2) For the Hercules supercluster, the Faraday RMs are enhanced overall within the supercluster boundary on the sky. However within the boundaries, the enhanced RMs do not generally occur precisely at zones of maximum supercluster pathlength. This may reflect the existence of large scale coherence of extragalactic magnetic fields within the Hercules Supercluster, but outside of the most galaxy-overdense zones within the supercluster volume.
(3) The Perseus-Pisces supercluster, which coincides with a larger “region A”, a zone of anomalously large RMs off the Galactic plane (Simard-Normandin and Kronberg 1980), shows the clearest detailed correlation with galaxy column density and supercluster volume pathlength for background Faraday-rotated radio sources. This correlation makes it likely, but not absolutely certain that some of the enhanced RMs are actually generated in the IGM of the supercluster over and above a Milky Way contribution. As with the Hercules supercluster, future larger numbers of pulsar RMs are needed to disentangle the relative RM contributions from the Milky Way and the ICM of the Perseus-Pisces supercluster/filament zone.
(4) Comparison with simple models of “expectation” IGM fields gives a result consistent with typical IGM fields in the supercluster IGM of order 0.3 G at a significance level.
Future advances in probing the Faraday Depths (Burn 1966; Brentjens & deBruyn 2005) of supercluster environments will require (1) much denser sky coverage of discrete source Faraday rotation measurements as Gaensler et al. (2005) have recently achieved for the Magellanic clouds, and (2) a better specification of the galactic magneto-ionic environment at off-plane directions using deeper surveys of pulsar RMs and dispersion measures, and multi-frequency all-sky radio polarization surveys. In addition, we require (3) fainter spectroscopic X-ray detections of intergalactic gas transitions to better specify the temperature and density of the WHIM. The first two will be easily accomplishable with the next radio telescope generation such as the proposed “Square Kilometer Array” (Carilli & Rawlings 2004). At present, the SDSS and other low redshift optical galaxy surveys are the most complete portion of the entire suite of observations required to better characterize the physics of the IGM.
acknowledgments
This publication makes use of data products from the Two Micron All Sky Survey, which is a joint project of the University of Massachusetts and the Infrared Processing and Analysis Center/California Institute of Technology, funded by the National Aeronautics and Space Administration and the National Science Foundation. At Los Alamos National Laboratory, this research is supported by the Department of Energy, under contract W-7405-ENG-36. Support is also acknowledged (PPK and QWD) from the Natural Sciences and Engineering Research Council of Canada.
References
- 2MASS Team (2003) 2MASS Team, 2003, http://www.ipac.caltech.edu/2mass/
- Abazajian et al. (2003) Abazajian, K. et al. 2003, AJ, 126, 2018 (DR1 paper)
- Abazajian et al. (2004) Abazajian, K. et al. 2004, AJ, 128, 502 (DR2 paper)
- Abazajian et al. (2005) Abazajian, K. et al. 2005, AJ, 129, 1755 (DR3 paper)
- Athreya et al. (1998) Athreya, R.M., Kapahi, V.K., McCarthy, P.J., & van Breugel, W. 1998, A&A, 329, 809-820
- Barber, Dobkin & Huhdanpaa (1996) Barber, C.B., Dobkin, D.P., & Huhdanpaa, H. 1996, ACM Trans. Math. Software 22, 469; http://www.qhull.org/
- Biermann (1950) Biermann, L. 1950, Z. für Naturforschung A, 5, 65
- Brentjens & deBruyn (2005) Brentjens, M., & deBruyn 2005, A&A (in press)
- Burn (1966) Burn, B.J. 1966, MNRAS, 133, 67
- Carilli & Rawlings (2004) Carilli, C. & Rawlings, S. (eds.) “Science with the Square Kilometre Array”, 2004, New Astronomy, 48
- CfA2 Team (1998) CfA2 Team, 1998, http://cfa-www.harvard.edu/huchra/zcat/
- Chokshi & Turner (1992) Chokshi, A., & Turner, E.L. 1992, MNRAS, 259, 421
- Clarke & Ensslin (2000) Clarke, T.E. & Enßlin, T.A., 2005, AJ, in press
- Clarke, Kronberg & Böhringer (2001) Clarke, T.E., Kronberg, P.P., & Böhringer H. 2001, ApJ, 547, L111
- Colgate & Li (2004) Colgate, S.A. & Li, H. 2004, Comptes rendus - Physique, ed. Sigl, G. & Boratav, M. 5, 431 - 440
- Dolag et al (2005) Dolag, K., Grasso, D., Springel, V., & Tkachev, I. 2005, Journal of Cosmology & Particle Phys., 1, 9
- Feretti et al. (1995) Feretti, L., Dallacasa, D., Giovannini, G., & Tagliani, A. 1995, A&A, 302, 680.
- Furlanetto & Loeb (2001) Furlanetto, S.R., & Loeb, A. 2001, ApJ, 556, 619
- Gaensler et al. (2005) Gaensler, B. M. et al. 2005, Science, 307, 1610-1612
- Gebhardt et al. (2000) Gebhardt et al. 2000, ApJ, 539, L13-16
- (21) Gnedin, N.Y., Ferrara, A., & Zweibel, E.G. 2000, ApJ, 539, 505
- Górski, Hivon, & Wandelt (1999) Górski, K.M., Hivon, E., & Wandelt, B.D., in Proceedings of the MPA/ESO Cosmology Conference “Evolution of Large-Scale Structure”, eds. Banday, A.J., Sheth, R.S., and Da Costa, L., PrintPartners Ipskamp, NL, pp. 37-42 (also astro-ph/9812350)
- Harrison (1970) Harrison, E.R. 1970, MNRAS, 147, 279.
- Haslam et al. (1982) Haslam, C.G.T, Stoffel, H., Salter, C.J, & Wilson, W.E. 1982, A&AS, 47, 1
- Icke & van de Weygaert (1987) Icke, V. & van de Weygaert, R. 1987, A&A, 184, 16
- Kim et al. (1989) Kim, K.T., Kronberg, P.P., Giovannini, G., & Venturi, T. 1989, Nature, 341, 720
- Kim et al. (1990) Kim, K.T., Kronberg, P.P., Dewdney, P.D., & Landecker, T.L. 1990, ApJ, 355, 29
- Kim et al. (1991) Kim, K.T., Tribble, P., & Kronberg, P.P. 1991, ApJ, 379, 80, 1991.
- Kronberg et al. (2001) Kronberg, P.P., Colgate, S.A., Li, H., & Dufton, Q.W. 2004, ApJ, 604, L77
- Kronberg, Lesch, & Hopp (1999) Kronberg, P.P., Lesch, H., & Hopp, U. 1999, ApJ, 511, 56.
- Kronberg et al. (2001) Kronberg, P.P., Dufton, Q.W., Li, H., & Colgate, S.A. 2001, ApJ, 560, 178
- Kronberg & Perry (1982) Kronberg, P.P. & Perry, J.J. 1982, ApJ, 263, 518
- Kronberg et al. (1986) Kronberg, P.P., Wielebinski, R., & Graham, D.A. 1986, A&A, 169, 63
- Mack et al. (1997) Mack, K.-H., Klein, U., O’Dea, C.P., & Willis, A.G. 1997, A&AS, 123, 423-444
- Nicastro et al. (2005a) Nicastro, F., et al. 2005a, Nature, Volume 433, Issue 7025, pp. 495-498
- Nicastro et al. (2005b) Nicastro, F., et al. 2005b, astro-ph/0501126
- Ryu et al (1998) Ryu, D.S., Kang, H., & Biermann, P.L. 1998, A&A, 335, 19 - 25
- Schlegel, Finkbeiner & Davis (1998) Schlegel, D. J., Finkbeiner, D. P., & Davis, M. 1998, ApJ, 500, 525
- Simard-Normandin & Kronberg (1980) Simard-Normandin, M. & Kronberg, P. P. 1980, ApJ, 242, 74-94
- Simard-Normandin, Kronberg & Button (1981) Simard-Normandin, M., Kronberg, P.P., & Button, S. 1981 ApJ, Suppl., 45, 97-111
- Small & Blandford (1992) Small, T.A., & Blandford, R.D. 1992, MNRAS 259, 725
- Soltan (1982) Soltan, A. 1982, MNRAS, 200, 115
- Strom & Willis (1980) Strom, R.G., & Willis, A.G. 1980, A&A, 85, 36
- Welter et al. (1984) Welter, G.L., Perry, J.J. & Kronberg, P.P. 1984, ApJ, 279, 19
- Willis & Strom (1978) Willis, A.G., and Strom, R.G. 1978, A&A, 62, 375
- Xu (2005) Xu, Y. 2005, in preparation