First Results from the CHARA Array. III.
Oblateness, Rotational Velocity
and Gravity Darkening of Alderamin
Abstract
We present observations of the A7IV-V star Alderamin ( Cep, HR 8162, HD 203280) from the Georgia State University CHARA Array. These infrared interferometric angular size measurements indicate a non-circular projected disk brightness distribution for this known rapid rotator. The interferometric observations are modeled as arising from an elongated rigid atmosphere, with apparent polar and equatorial radii of milliarcseconds (mas) and mas, respectively, for a difference of microarcseconds (as), and with an axial ratio of . Using the Hipparcos distance of pc, these angular measures translate to and . The inclination of Alderamin to the line of sight indicated by this modeling is effectively edge-on (). The star has a true rotational velocity of km/s (% of breakup velocity), and a polar temperature of roughly K. Significantly, a necessary aspect of this modeling is a determination of the gravity darkening coefficient, which at a value of is consistent with a convective photosphere, as expected for an A7IV-V star. Our detailed characterization of this object allows us to investigate various scenarios for the angular momentum history of Alderamin and the appropriateness of certain stellar evolution models.
1 Introduction
The Georgia State University’s (GSU) Center for High Angular Resolution Astronomy (CHARA) Array is a six-element optical/infrared interferometer located on Mt. Wilson in southern California. The CHARA Array has six 1-m telescopes operational and recently completed its first full year of science observations, including observations of stellar diameters, young stellar objects, and rapidly rotating stars. A companion paper (ten Brummelaar et al., 2005) describes the full compliment of technical details of the instrument, and McAlister et al. (2005) details the first science results from the instrument, on the rapid rotator Regulus. CHARA’s operational status of having the longest - & -band baselines in the world make it uniquely well suited for observations of main sequence star absolute diameters.
The star Alderamin ( Cep, HR 8162, HD 203280) is a well-studied object, being one of the 20 brightest A-type stars in the sky (Hoffleit & Warren, 1995) and one of the nearer stars to the Sun (Perryman et al., 1997; Cox, 2000). Originally classified as an A2n (Douglas, 1926), it is now accepted to be an A7IV-V main sequence star (Johnson & Morgan, 1953) and has been known to be a rapid rotator for over 50 years (Slettebak, 1955). The measurements of the star’s apparent rotational velocity () range from 180-200 km s-1 (Gray, 1980; Abt & Morrell, 1995) up to 245-265 km s-1 (Bernacca & Perinotto, 1970; Abt & Moyd, 1973), depending upon the spectral lines used in the investigation. These values of are a substantial fraction of an A7V star’s critical velocity of no more than 415 km s-1 (a velocity which decreases as the object evolves and increases in size) (Slettebak, 1966), where centripetal acceleration at the stellar equator equals gravitational acceleration.
Recent advances in interferometric observations have allowed for direct observation of rotationally oblate main sequence stellar surfaces, including the first such observation by van Belle et al. (2001) of the A7IV-V rapid rotator Altair, confirmation of that object’s latitude-dependent temperature structure (Ohishi et al., 2004; Peterson et al., 2005), and the CHARA Array observations of Regulus (McAlister et al., 2005). Similar observations of the related Be star phenomenon have been also achieved by interferometers (Quirrenbach et al., 1994; Domiciano de Souza et al., 2003).
The effects of stellar rotation have been measured spectroscopically for almost a century, beginning with Schlesinger (1909, 1911). Models of rotating stars have explored the impact of rotation upon both stellar effective temperature (Slettebak, 1949) and stellar shape (Collins, 1963, 1965; Collins & Harrington, 1966). Recently, models have begun to incorporate the effects of differential rotation as a function of stellar latitude (Zahn, 1992). Rotation impacts important observable parameters such as photometry (Collins & Smith, 1985) and surface brightness distributions as originally shown by von Zeipel (1924a, b). Rotation has non-trivial implications upon stellar evolution, as explored in the various papers by, among others, Claret and Maeder (cf. Martin & Claret (1996); Claret (2000); Maeder (1997, 2000)).
Herein we report the determination of the overall diameter and projected shape of Alderamin upon the sky from near-infrared, long-baseline interferometric measurements taken with the CHARA Array. Direct observation of the stellar disk can provide unique insight into basic stellar parameters. The measured angular size in conjunction with the bolometric flux and distance yields constraints on parameters such as latitude-dependent local effective temperature111We note that a star’s effective temperature is a globally defined quantity in terms of the stellar luminosity, . For denoting the temperature associated with specific surface elements of the stellar surface, we will follow the convention of Collins (1963, 1965) and use the term local effective temperature. and linear radii, both of which remain quantities poorly established empirically for virtually all stars. Upon fitting a family of rotating models for the projected stellar photosphere upon the sky, we further demonstrate that a unique value for may be derived from the interferometric data.
The CHARA Array observations that produced these results are discussed in §2, detailing source selection and observation. In §3, we detail supporting spectral energy distribution fits which constrain stellar parameters appropriate for this analysis. The circular symmetry of our check star is then established in §4, which also allow us to characterize the uncertainties inherent in the visibility data. In §5, Alderamin’s departure from a circular on-sky brightness distribution is established, and in §6, we demonstrate that inclination, true rotational velocity, and other astrophysical parameters may be derived from Alderamin’s oblateness by fitting the data with the appropriate family of Roche models. Finally, in §7, we examine the astrophysical implications of the best-fit model, such as the possible angular momentum history of the object.
2 Observations
The interferometric observable used for these measurements is the fringe contrast or visibility (squared) of an observed brightness distribution on the sky. Normalized in the interval , a uniform disk single star exhibits monochromatic visibility modulus in a uniform disk model given by
| (1) |
where is the first-order Bessel function, is the projected baseline vector magnitude at the star position, is the apparent uniform disk angular diameter of the star, and is the wavelength of the interferometric observation.
| Baseline | Projected baselines | Projected sky anglesaaPA is east of north. | Dates |
|---|---|---|---|
| W1-E1 | 279-312m | 70-120o | 15-21 Jun 2004 |
| S1-E1 | 250-304m | 0-75o | 26-29 Jun 2004 |
Alderamin was observed in the -band (m wide centered at m) contemporaneously with a primary calibration star, HD197373, and a check star, HD 211833, by the CHARA Array on 8 nights between 2004 Jun 17 and 2004 Jun 29. Observations of Alderamin were always bracketed within minutes with the calibration source, and every other Alderamin-calibration set included an observation of HD211833. On the nights of Jun 17, 19, 20, and 21, Alderamin was observed with the W1 and E1 pair of CHARA telescopes; on Jun 26-29, the S1 and E1 pair was utilized; details are given in Table 1. Data collection on the nights between Jun 22 and 25 was attempted with the W1 and S1 pairing, but due to weather and instrumental difficulties, these data were of insufficient quality for this study and were discarded. Other nights between Jun 17 and Jun 29 were lost to weather and instrument problems. Our check star, HD 211833, was selected on the basis of an expected angular size similar to Alderamin, in addition to an expectation of circular symmetry in its sky projection, based upon its low . Alderamin and HD 211833, along with an “unresolved” calibration object, HD 197373, were observed multiple times during each of these nights, and each observation set, or scan, was approximately 180 s long, consisting of 200 scans. Following commonly accepted & expected optical interferometry practice (van Belle & van Belle, 2005), we attempted to achieve absolute instrument calibration through use of a calibration object that matched the instrument’s resolution limit and limiting accuracy, as demonstrated by night-to-night repeatability.
For a 0.41 mas calibration source such as HD 197373, the CHARA Array’s longest baseline at 330m should give a raw of 0.80 before instrumental and atmospheric degradation. For each scan we computed a mean -value from the scan data, and the error in the estimate from the rms internal scatter (ten Brummelaar et al., 2005). Alderamin was always observed in combination with its calibration or check sources within and on the sky, respectfully. The calibration source HD 197373 is expected to be nearly unresolved by the interferometer with a predicted angular size of mas (computed in §3); expected angular size and error were based upon fitting template spectral energy distributions of the proper spectral type from Pickles (1998) to available broadband photometry, particularly in the near-infrared (Gezari et al., 1996; Cutri et al., 2003). Since many stars deviate significantly from blackbody behavior and/or have significant reddening (Blackwell & Lynas-Gray, 1998), we expect this approach to provide significantly better estimates of calibrator angular size than a simple blackbody fit. These objects were additionally selected to be slow apparent rotators, with 30 km s-1 (Uesugi & Fukuda, 1982; Henry et al., 2000). Table 2 summarizes the general parameters for the objects observed in this investigation.
Interferometer ’s were obtained by recording a photometric signal of the two telescope combined beam as the interferometer delay lines were slewed through the white light fringe position on the sky at a pre-set group velocity. This signal was normalized with a low pass filter, and a power spectrum was computed. Using calibration scans of the individual beams and the closed shutter, the noise bias was removed from the power spectrum, and the integration of the power results in an estimate of instrumental . An additional correction for atmospheric turbulence visibility bias is also used to adjust this ; these steps are all described in mathematical detail in ten Brummelaar et al. (2005). Formal errors for each measure of were established from the measurement statistics associated with these photometric signals.
The atmospheric calibration of Alderamin data on the sky is performed by estimating the interferometer system visibility () using the calibration source with model angular diameters and then normalizing the raw Alderamin visibility by to estimate the measured by an ideal interferometer at that epoch (Mozurkewich et al., 1991; Boden et al., 1998). Multiple observations of the calibration source were averaged together in a time-weighted sense, with the error variance being doubled for a one hour time separation. Uncertainties in the system visibility and the calibrated target visibility were propagated though the data stream using standard error-propagation calculations. This atmospheric calibration process was accomplished through use of the publicly available wbCalib program222Detailed documentation and downloads available online at http://msc.caltech.edu..
The formal errors reported by the instrument measurement process are always smaller than those created by the atmospheric calibration process, which will be discussed further in §4. More detail on the CHARA Array’s target and calibrator selection, data reduction and technical aspects is available in the literature (McAlister et al., 2005; ten Brummelaar et al., 2005). Calibrating our Alderamin data set with respect to the calibration object listed in Table 2 results in a total of 41 calibrated scans on Alderamin over the 8 observing nights in 2004, and 22 calibrated scans on HD 211833 over the same nights. Our calibrated Alderamin measurements are summarized in Table 3.
| Source | aaEstimated angular size from SED fitting as described in §3. | Distance from | Spectral | Notes | |
|---|---|---|---|---|---|
| (mas) | Alderamin (deg) | Type | (km s-1) | ||
| Alderamin | A7IV-V | 200 | Primary target | ||
| HD 197373 | 5.0 | F6IV | 30 | Primary calibrator | |
| HD 211833 | 6.8 | K3III | 2 | Resolved check star |
| Projected | Position | Hour | Normalized | Uniform Disk | |
|---|---|---|---|---|---|
| MJD | Baseline | Angle | Angle | Ang. Size | |
| (m) | (deg)aaPA is east of north. | (hr) | bbErrors have been normalized as discussed in §4. | (mas) | |
| 53173.363 | 279.16 | 112.8 | -2.73 | ||
| 53173.385 | 287.16 | 105.3 | -2.21 | ||
| 53173.415 | 296.88 | 95.3 | -1.48 | ||
| 53173.448 | 305.03 | 84.9 | -0.70 | ||
| 53173.472 | 309.28 | 77.4 | -0.13 | ||
| 53175.376 | 285.87 | 106.5 | -2.29 | ||
| 53175.421 | 299.99 | 91.7 | -1.21 | ||
| 53175.434 | 303.27 | 87.5 | -0.89 | ||
| 53175.473 | 310.25 | 75.1 | 0.05 | ||
| 53176.383 | 289.27 | 103.2 | -2.06 | ||
| 53176.398 | 294.11 | 98.3 | -1.70 | ||
| 53176.423 | 301.20 | 90.2 | -1.10 | ||
| 53176.437 | 304.40 | 85.8 | -0.77 | ||
| 53176.462 | 309.13 | 77.7 | -0.15 | ||
| 53176.490 | 312.22 | 69.0 | 0.51 | ||
| 53177.437 | 305.05 | 84.9 | -0.70 | ||
| 53177.456 | 308.58 | 78.8 | -0.24 | ||
| 53182.348 | 269.01 | 50.4 | -2.51 | ||
| 53182.446 | 298.31 | 26.4 | -0.16 | ||
| 53182.466 | 301.61 | 21.3 | 0.33 | ||
| 53182.482 | 303.69 | 17.2 | 0.72 | ||
| 53183.306 | 249.91 | 60.1 | -3.45 | ||
| 53183.322 | 258.10 | 56.2 | -3.07 | ||
| 53183.352 | 271.72 | 48.8 | -2.35 | ||
| 53183.368 | 277.82 | 45.0 | -1.97 | ||
| 53184.327 | 261.74 | 54.3 | -2.89 | ||
| 53184.341 | 268.24 | 50.8 | -2.55 | ||
| 53184.358 | 275.42 | 46.5 | -2.13 | ||
| 53184.381 | 283.38 | 41.1 | -1.59 | ||
| 53184.397 | 288.19 | 37.2 | -1.21 | ||
| 53184.421 | 294.30 | 31.3 | -0.63 | ||
| 53184.433 | 297.02 | 28.1 | -0.32 | ||
| 53184.458 | 301.24 | 22.0 | 0.27 | ||
| 53185.375 | 282.19 | 41.9 | -1.67 | ||
| 53185.388 | 286.43 | 38.7 | -1.35 | ||
| 53185.410 | 292.33 | 33.3 | -0.83 | ||
| 53185.419 | 294.64 | 30.9 | -0.59 | ||
| 53185.437 | 298.14 | 26.6 | -0.18 | ||
| 53185.448 | 300.09 | 23.8 | 0.09 | ||
| 53185.469 | 303.05 | 18.6 | 0.59 | ||
| 53185.481 | 304.40 | 15.5 | 0.88 |
| Projected | Position | Hour | Normalized | Uniform Disk | |
|---|---|---|---|---|---|
| MJD | Baseline | Angle | Angle | Ang. Size | |
| (m) | (deg)aaPA is east of north. | (hr) | bbErrors have been normalized as discussed in §4. | (mas) | |
| 53173.400 | 277.40 | 114.8 | -2.85 | ||
| 53173.424 | 286.57 | 106.1 | -2.26 | ||
| 53173.455 | 296.33 | 96.0 | -1.53 | ||
| 53173.478 | 302.55 | 88.5 | -0.97 | ||
| 53175.400 | 279.81 | 112.5 | -2.70 | ||
| 53175.443 | 294.41 | 98.2 | -1.69 | ||
| 53175.484 | 305.19 | 84.7 | -0.68 | ||
| 53176.406 | 282.88 | 109.6 | -2.50 | ||
| 53176.446 | 296.27 | 96.1 | -1.54 | ||
| 53176.498 | 308.17 | 79.6 | -0.29 | ||
| 53177.470 | 303.18 | 87.6 | -0.90 | ||
| 53182.449 | 289.23 | 35.9 | -1.07 | ||
| 53182.485 | 297.53 | 26.8 | -0.20 | ||
| 53183.331 | 240.18 | 64.4 | -3.85 | ||
| 53183.375 | 263.39 | 53.4 | -2.78 | ||
| 53184.364 | 259.29 | 55.5 | -2.99 | ||
| 53184.401 | 275.39 | 46.4 | -2.10 | ||
| 53184.438 | 287.68 | 37.3 | -1.21 | ||
| 53185.393 | 273.55 | 47.5 | -2.21 | ||
| 53185.425 | 284.49 | 39.9 | -1.47 | ||
| 53185.453 | 292.24 | 33.0 | -0.79 | ||
| 53185.485 | 298.95 | 24.8 | -0.01 |
3 Spectral Energy Distribution Fitting
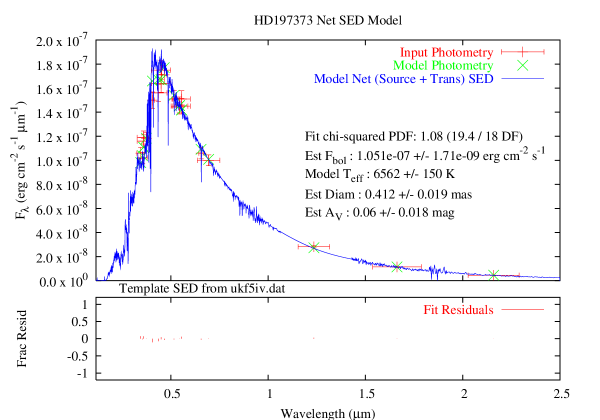
For each of the three stars observed in this investigation, a spectral energy distribution (SED) fit was performed. This fit was accomplished using photometry available in the literature as the input values, with template spectra appropriate for the spectral types indicated for the stars in question. The template spectra, from Pickles (1998), were adjusted by the fitting routine to account for overall flux level, wavelength-dependent reddening, and expected angular size. Reddening corrections were based upon the empirical reddening determination described by Mathis (1980), which differs little from van de Hulst’s theoretical reddening curve number 15 (Johnson, 1968; Dyck et al., 1996). Both narrowband and wideband photometry in the 0.3 m to 3 m were used as available, including Johnson (Eggen, 1963, 1972; Moreno, 1971; Oja, 1996), Stromgren (Crawford et al., 1966; Piirola, 1976), 2Mass (Cutri et al., 2003), Vilnius (Zdanavicius et al., 1969, 1972), and (Kornilov et al., 1991); flux calibrations were based upon the values given in Cox (2000). The results of the fitting are given in Table 5, and an example SED fitting plot is given in Figure 1.
The utility of this fitting was twofold. First, for our calibration source, HD 197373, an a priori estimate of its size is necessary to account for residual resolution that may be afforded by the interferometer’s extraordinarily long baselines. With an expected limb darkened size of from the SED fit, HD 197373 has a predicted of % for a 330-m baseline used at 2.2 m; we shall consider this size effectively identical to its uniform disk size, since for a F-type size, the difference between the two is at the 1% level (Davis et al., 2000; Claret & Hauschildt, 2003), which is far less than our size estimate error. Ideally, a calibration source would be sufficiently point-like that its would be indistinguishable from unity, but unfortunately the current system sensitivity does not afford that option. The uncertainty in the calibrator visibility represents one of the fundamental limitations of the system visibility accuracy. However, our current selection of calibrator is sufficiently small in diameter that there are no concerns about a varying system calibration due to unaccounted-for calibrator surface morphology.
Second, SED fitting provides us with an accurate characterization of the stellar bolometric flux. In the case of our check star, HD 211833, the combination of that flux and an actual measure of the star’s angular size allows for a direct calculation of the star’s effective temperature in §4 (rather than the model value used to numerically fit the template). Such an analysis will also be applied in §5.2 to our primary target, Alderamin, but as will be discussed in that section, a single effective temperature is insufficient to characterize the star at the level of detail at which we will be examining it.
We note that the indicated spectral type and luminosity class for HD 211833 is that of K3III (Bidelman, 1957; Schmitt, 1971), or of a K1III (Wright et al., 2003), but that in Table 6, we indicate its best fit spectral template was for a K0-1II star with a SED fitting chi-squared per degree of freedom of /DOF, indicating perhaps some uncertainty in not just its spectra type but true luminosity class. Fits of the ‘normal’ K1 through K3 giant models from Pickles (1998) indicate /DOF values of 7.01, 6.18, and 9.31, respectfully; the metal-weak and metal-poor templates show no obvious improvement over these values. However, as will be examined in the next section, luminosity class uncertainty does not impact our analysis, in that HD 211833 appears spherical regardless of luminosity class.
4 HD 211833 - A ‘Round’ Check Star
Before we examine our Alderamin data in detail, we will examine the visibility data for our check star, HD 211833. HD 211833 is located in close proximity on the sky to the calibrator and primary target (), and the data collected on all three objects was done in a contemporaneous fashion (), with little change expected in the point-response of the instrument from scan to scan. One of HD 211833’s primary attributes that led to its selection as our check star was a known, low rate of apparent rotation, with km/s (de Medeiros & Mayor, 1999). From that low we inferred that the object would have a circular appearance upon the sky, due to either an intrinsic low rotation rate, or a pole-on viewing aspect. This circular symmetry is independent of uncertainty in the star’s luminosity class.
| Parameter | Value | Units | Source |
|---|---|---|---|
| Apparent rotation velocity | 2 | km/s | de Medeiros & Mayor (1999) |
| Spectral Type | K3III | Bidelman (1957); Schmitt (1971) | |
| K1III | Wright et al. (2003) | ||
| K0-1II | §3 | ||
| Parallax () | mas | (Perryman et al., 1997) | |
| Bolometric flux () | erg cm-2 s-1 | This work | |
| Angular size () | mas | This work | |
| Effective temperature () | K | This work | |
| Linear radius () | This work |
Once normalized values for have been obtained as described in §2, the simplest interpretation is to fit a uniform disk (UD) angular size to the individual data points following Equation 1. For our check star HD 211833, a single UD fit to the 22 data points results in an indicated angular size of mas, with a chi-square per degree of freedom fitting value of /DOF=13.90. Examination of the HD 211833 UD data as an ellipsoidal sky projection (as will be detailed in §5.1 for Alderamin) results in fit values of mas, mas, and , but a reduced chi-squared of /DOF=13.68 - which represents both no significant improvement in fit, and more importantly, a negligible detection of asymmetry.
However, given the known rotational velocities of the calibration and check sources in this investigation, it is entirely reasonable to expect that examination of our check star as a uniform disk as a function of baseline projection angle should result in a /DOF of 1.0. For the sake of this investigation, we will suggest that the true measurement uncertainty of the CHARA Array in the utilized operating mode is not fully characterized by merely tracking the measurement scatter as discussed in §2, and that the actual error bars should be a factor of 3.42 larger than indicated by that scatter. In doing so, the /DOF for HD 211833’s uniform disk fit becomes 1.0, and the indicated uniform disk angular size is mas; as before, the ellipsoidal fit does not indicate a statistically significant improvement. We will employ this scaling factor for the errors for examination of the Alderamin data in light of what should be the appropriate modeling context. The uniform disk angular sizes as a function of baseline projection angle are seen in Figure 2.
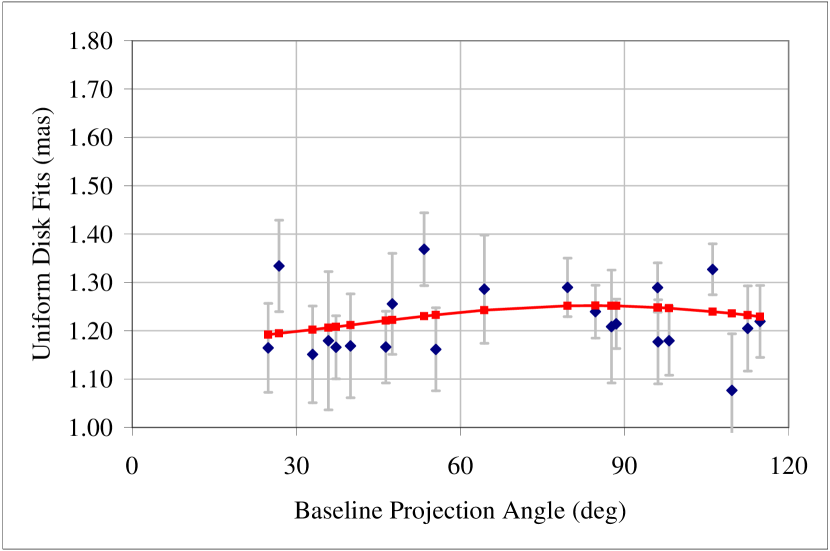
From HD 211833’s parallax of (Perryman et al., 1997), we may derive a linear radius of . The bolometric flux from §3, in conjunction with the angular size, may be used to derive an effective temperature of K (see §5.2 for details on this procedure). Both the radius and temperature numbers are consistent with our use of a K0-1II SED fitting template in §3. The full characterization of HD 211833 that results from this ancillary investigation can be found in Table 6.
5 Alderamin
5.1 Apparent Stellar Disk
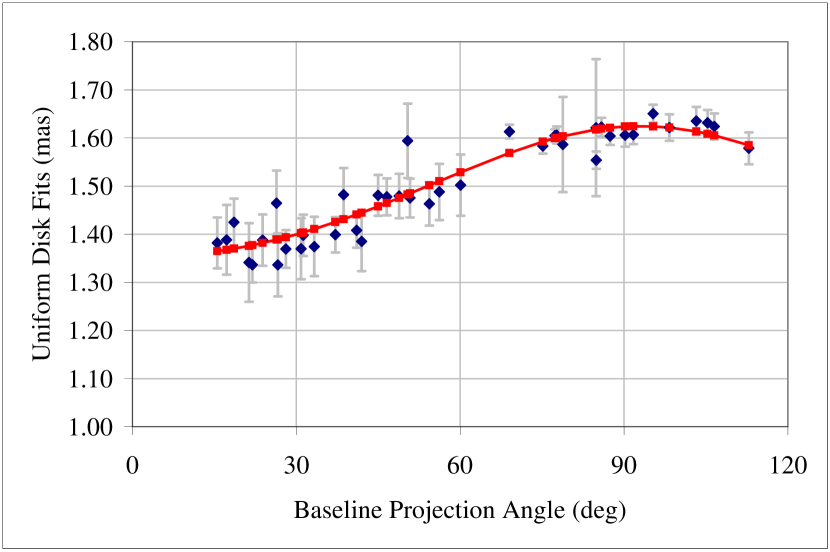
The normalized values of for Alderamin for each observation are listed in Table 3, with their associated epoch, projected interferometer baseline length, position angle and observation hour angle. A value is given for each observation, representing the individual visibility value derived from the two simultaneous measurements made on light output from either side of the beam recombination optic. Also given in Table 3 is an angular size for each individual from uniform disk fit (see Equation 1), which for the purposes of this section alone will be used to provide an initial evaluation of the data. Some of the data points lie in the non-monotonic region of a uniform disk visibility curve (where leads to multiple possible values of ); we shall assume for this first look at our data that the appropriate values of lie on the central lobe of a uniform disk visibility function, noting that this assumption does not carry over into our physically more appropriate analysis of §6. From those values, fitting a single global value of to the data ensemble results in a mean uniform disk size of mas with a chi-squared per degree of freedom of /DOF. As is readily evident from Figure 3, a position angle-independent fit would clearly be poor.
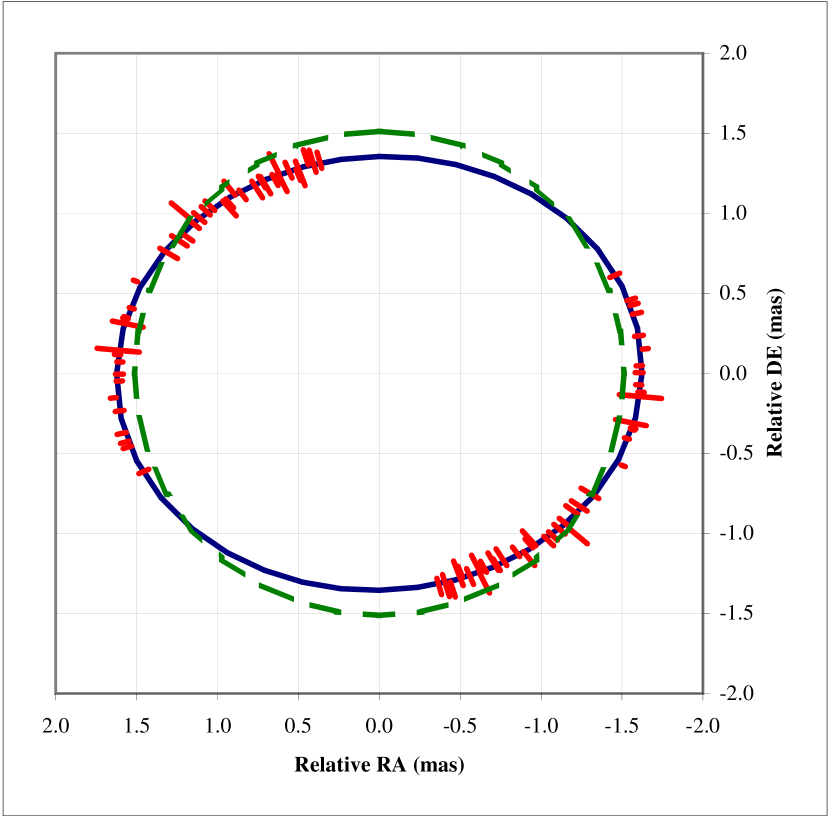
This discrepancy can be explored by relaxing the assumption of spherical symmetry and including the position angle of the observations in the fit. A spherical gaseous star will deform when rotating; such a shape projected onto the sky will appear, to first order, as an ellipse. For given physical situations, the true geometry of a rotating star will depart from that of an ellipsoid at the 5-20% level, and we will return to this in a much more physically appropriate way in §6. However, such a fit is useful as a mathematical construct to initially establish the position angle dependence of our angular size data. Using the basic equation for an ellipse,
| (2) |
we may solve for a projection angle-dependent angular size, where and are the major and minor axes of the ellipse on the sky in mas, respectively, and is the orientation angle of the ellipse on the sky with corresponding to the major axis pointing to the north on the sky and increasing to the east of north. Fitting Equation 2 to the data in Table 2, we find that mas, mas, and with /DOF - this is a substantial improvement over the circular fit. An illustration of this fit and the UD data is seen in Figure 4.
Other potential causes for Alderamin’s departure from circularly symmetric data may be ruled out. If Alderamin were either a true or line-of-sight close binary star, our interpretation of the variations with baseline length and position angle would be incorrect. If a nearby binary were present in the interferometer beam, variations in the instrument’s would be present in the data set, but as a function of time, and not just baseline projection angle.
We also consider two other potential deviations of the apparent disk of Alderamin from that of a uniform brightness distribution. The first, limb darkening, will affect a star’s observed visibility curve and potentially bias our results. Second, for a rapidly rotating star, this phenomenon takes on an additional latitude dependence, often referred to in the literature as gravity-darkening (eg. Claret (2000)). As first shown by von Zeipel (1924a), the polar zones of stars distorted by rapid rotation will be hotter than their equatorial zones, because the poles are closer to the center of the star. The consequential non-uniform flux distribution over the stellar surface affects a star’s visibility curve. Our expectation is that the ellipsoidal fit in this section can be improved upon by accounting for these effects, which we will do in §6.
5.2 Effective Temperature
Although we may compute a single effective temperature from our data on Alderamin, it must be stressed that this will be nothing more than a mathematical construct derived from geometrical considerations for the purposes of characterizing the gross properties of the star. Rewriting the stellar effective temperature equation in terms of angular diameter and bolometric flux , a value of was calculated from the flux and mean Rosseland diameter , corresponding to the level in the atmosphere where the Rosseland mean opacity is unity, using
| (3) |
where the units of are erg/cm2s, and , , are in mas. The error in is calculated from the usual propagation of errors applied to Equation 3. The resultant mean for Alderamin is determined here from the flux value given in §3 and the angular size data given in §5.1 to be K. Previously, a value of 7773K was estimated by Gray et al. (2003), which agrees well with our measure, noting again that this value for effective temperature is solely derived from geometric considerations and is an inadequate true characterization of a stellar surface over which the temperature, in fact, is latitude dependent.
We should note, however, that this determination of differs from the values for pole and equator local effective temperatures that result from the Roche fitting in §6. This is due to the accuracy with which the overall bolometric flux can be determined for Alderamin, using data across the spectrum from the U band (0.3 m) to longwards of the M-band (5 m). In contrast to that, the photometric fitting portion of the approach detailed in §6 that constrains the pole temperatures of the models is limited by the accuracy with which the and -band brightness of Alderamin has been determined, which is and (Johnson et al., 1966; Cutri et al., 2003), respectfully.
A larger implication of this result is the potential inadequacy of effective temperatures derived from angular diameters at single projections across the disks of rotationally distorted stars. As we will see in the next section, this effect can be much more significant than limb darkening in ascertaining a star’s , an effect which is expected to be routinely considered in all studies of stellar effective temperature.
6 Rapid Rotator Fitting
The key to understanding the peculiar diameter results for Alderamin lies in its rapid rotation. The force of centrifugal acceleration at the equator, resulting from the rotation, offsets the effect of gravitation owing to the mass of the star. Under the conditions of hydrostatic equilibrium, uniform rotation, and a point mass gravitational potential, we may derive the equatorial rotational velocity, assuming we view the star at an inclination angle . As developed in the work by Collins (1963, 1965) and presented in Jordahl (1972), the equation of shape for such a star under rotation may be written as
| (4) |
From Equation 4, we can arrive at an expression for the colatitude-dependent stellar radius at a rotation speed :
| (5) |
where is the dimensionless rotation speed
| (6) |
and is the radius normalized to the stellar polar radius for a given . It is worth noting that, in contrast to our elliptical approximation in §5.1, this approach solves for the expected shape of the stellar limb using an approach based upon physics rather than merely geometry.
To interpret our interferometric data, we used a Monte Carlo approach which began by constructing models of Alderamin based upon rotation and polar radius , sufficient to map the entire surface as a function of stellar colatitude and longitude. Model surfaces were constructed for the star at intervals of in both colatitude and longitude across the whole volume. Flux for a given surface area was then computed using the appropriate influence of gravity darkening (von Zeipel, 1924a; Claret, 2003), with . For the models in question, pole temperature and gravity darkening coefficient were the free parameters that characterized this effect, following the relationship between local effective temperature, , and local effective surface gravity:
| (7) |
as detailed in Collins (1965) and Domiciano de Souza et al. (2002). These models were then mapped onto the sky, through the use of two additional free parameters describing orientation, inclination and on-sky rotational orientation , with limb-darkening appropriate for these model stars as indicated by Claret & Hauschildt (2003) applied at this point as well.
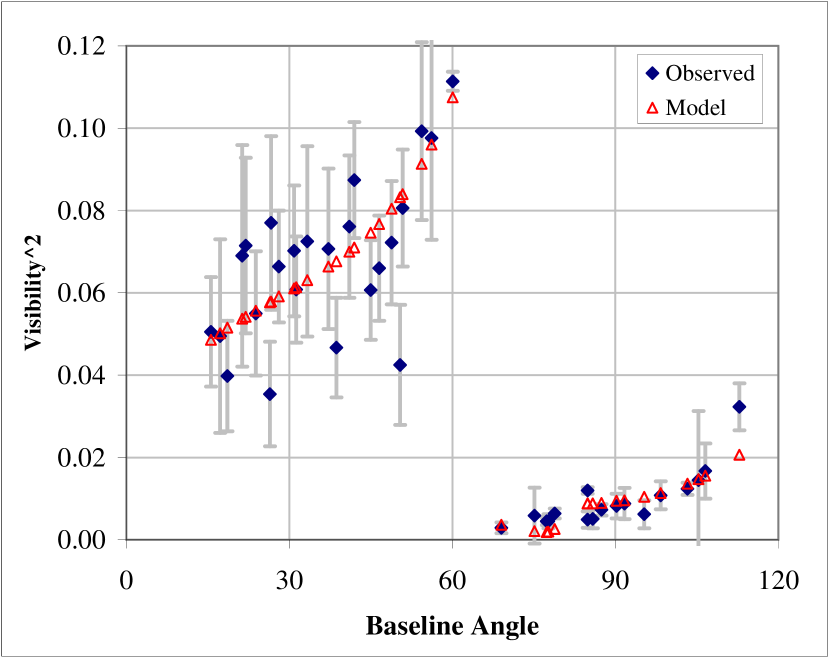
For comparison with interferometric data, the 2-dimensional model star projected onto the sky was Fourier transformed to provide model ’s for comparison with all observed visibility data points simultaneously. This transformation took into account a mild bandwidth smearing effect due to the data being taken through a broad filter, by repeating the calculation at a number of points through the filter and averaging the results. Additionally, the temperature of each area element of a given model’s sky projection would be used to compute a contribution to the overall apparent flux density from the star in both the and bands. The sum total of the apparent flux density was then compared to measured and band photometry for the star, thereby providing a constraint upon for the models.
Thus, for a given set of six randomized free parameters , a 101,000 point volume surface was generated, projected upon the sky, rotated and the resultant image Fourier transformed for comparison to each of the observed data points, and a DOF calculated. The multidimensional downhill simplex method optimization code from Numerical Recipes (Press et al., 1992) was then utilized to derive the best solution from the random starting point, a process that took typically 500 iterations. In contrast to the earlier generation reduction code used in van Belle et al. (2001), this analysis compares the model and observed data in Fourier space, rather than image space, which will result in a more accurate result. In particular, some of the assumptions regarding uniform disk geometry found in van Belle et al. (2001) are no longer invoked; the consideration of gravity darkening discussed above is possible only with this approach.
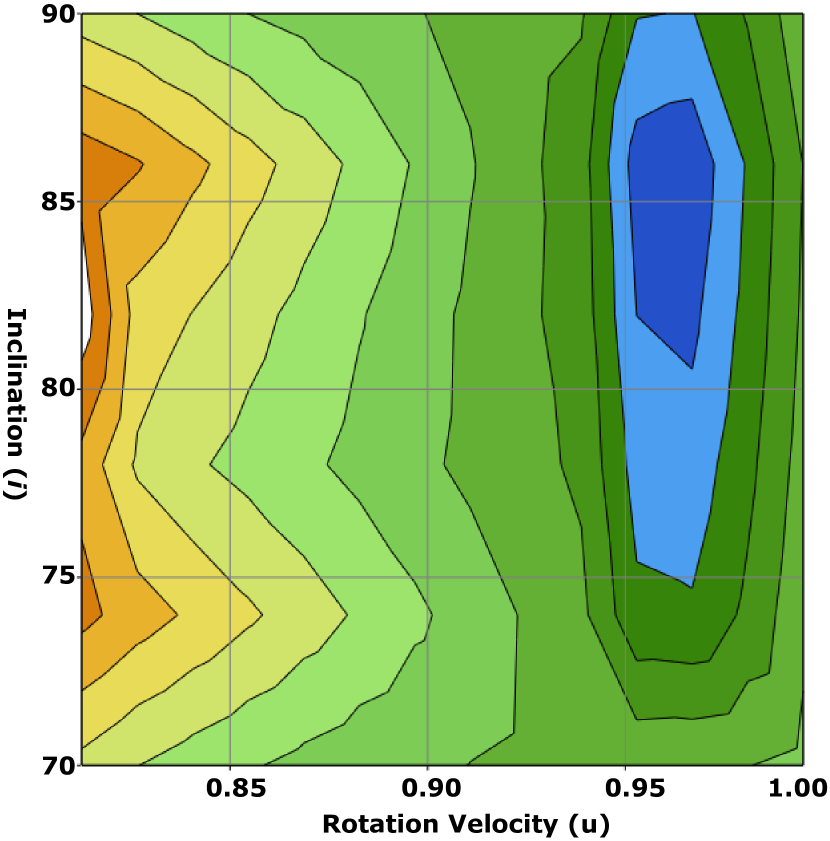
An exhaustive search of the rotating star parameter space was used to explore the DOF space through optimizations of over 1,000 random starting points. Furthermore, a static grid of values was explored for optimal values to ensure that no local minima were trapping the optimization code. The grid consisted of 1,000 points spread uniformly over the space enclosed by , and was run multiple times with random seed values, to ensure full mapping of the resultant DOF surface.
Once our best solution and its associated DOF was established, errors for the individual parameters were derived. This was done by exploring the confidence region boundary through a modified version of our optimization code that searched the parameter space about our optimum six-parameter fit for appropriate increases in DOF. Each run of this modified code would target one of the six parameters for maximum deviation from its best-fit value, adjusting the six parameters towards that goal while maintaining the /DOF constraint. As with the original code, the modified code would start with randomized seed values of the six parameters, which in this case were slight deviations off of the best fit. Once done, the multidimensional downhill simplex method code would iterate to meet the /DOF condition and maximize the target parameter deviation. Through approximately a thousand runs of the code for each of the six parameters in question, the full confidence region boundary was explored and the appropriate error value was established for those parameters.
Trial runs of the DOF minimization technique using artificial data sets from synthetic stars were able to fully recover the initial four parameter characterization for the original synthetic star. The model data sets covered a wide range of position angles, from to in steps, and with visibility errors slightly better than in the Alderamin dataset, which on average are 4% per measurement.
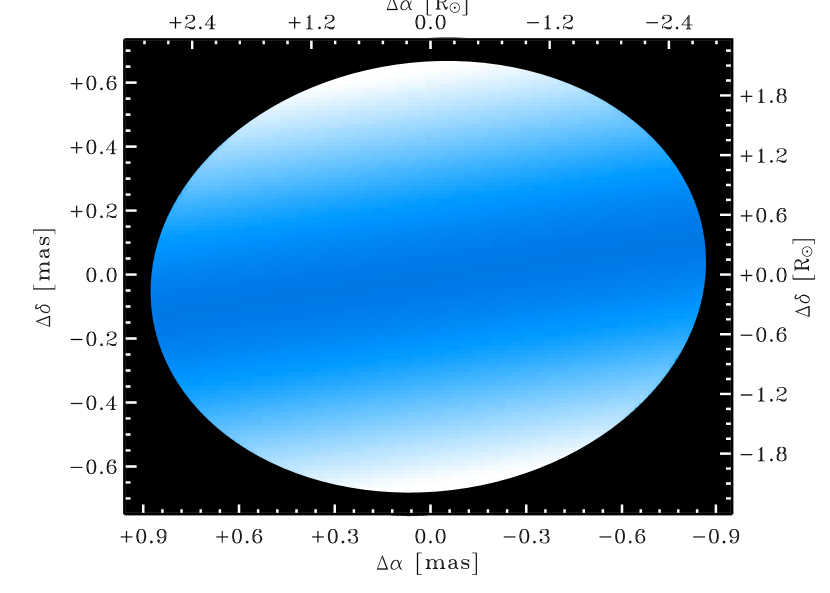
The DOF surface resulting from the Alderamin dataset is plotted in Figure 6, where are optimized for minimum DOF for a given pair of coordinates. The six parameter best-fit model’s appearance upon the sky is plotted in Figure 7. The best-fit value of DOF=2.16 is slightly higher than the value for the ellipsoidal fit found in §5.1, but this is due primarily to the additional complication of the fit found in incorporating the and band photometry constraints. From our solution values for these dimensionless parameters, we used values of for the mass of Alderamin (derived in §7), and a parallax of mas (Perryman et al., 1997), to extract ‘real world’ values such as rotation velocity and rotational period.
The difference between the primary and secondary axes of our best fit model is microarcseconds, with an oblateness ratio of . Our derived value for of km/s is in reasonable agreement with the larger spectroscopically determined values, as presented in §1. Since our technique of mapping the surface (and in particular, the limb) of the star is sensitive to the highest velocity material of the star, we were not surprised that our is on the high end of the spectroscopically determined numbers; apparent velocities from spectra have to account for rotationally broadened spectral lines convolved across the entire surface of the star, and could potentially underestimate values because of this approach. The dominant source of error in our technique is the mass estimate, which we will discuss in the next section. The linear sizes are well constrained by the Hipparcos parallax, which has only a 0.4% quoted error.
| Parameter | Value | Units | Reference | |
|---|---|---|---|---|
| Values from the literature | ||||
| Spectral type | A7IV-V | (Bidelman, 1957) | ||
| Parallax () | mas | (Perryman et al., 1997) | ||
| Bolometric flux () | erg cm-2 s-1 | |||
| Mass () | mas | This work | ||
| Metallicity ([Fe/H]) | 0.09 | (Gray et al., 2003) | ||
| Ellipsoidal fit | ||||
| mas | ||||
| mas | ||||
| Position angle () | deg | |||
| Parameter | Value | Units | |
|---|---|---|---|
| Primary Fitting Parameters | |||
| Apparent polar radius () | mas | ||
| Position angle () | deg | ||
| Gravity darkening () | |||
| Inclination () | deg | ||
| Polar temperature () | K | ||
| Dimensionless velocity () | |||
| Chi-squared per degree of freedom (/DOF) | 2.16 | ||
| Derived Values | |||
| Apparent equatorial radius () | mas | ||
| Polar radius () | |||
| Equatorial radius () | |||
| Oblateness () | |||
| Radii difference () | |||
| Fractional breakup velocity () | |||
| Equatorial velocity () | km / s | ||
| Critical velocity () | km / s | ||
| Apparent velocity () | km / s | ||
| Period () | hours | ||
| Mass () | |||
7 Discussion
The breadth and depth of the parameters presented in Table 8 allow for a detailed examination of the present and past state of Alderamin. As discussed in Reiners (2003) and references therein, for spectral types later than A2, a gravity darkening value of is expected for these stars due to their outer convective envelopes. Our best-fit value of is consistent with this expectation and lends a degree of confidence to the best-fit model. Although the errors on our model value are generous, they do indicate that a gravity darkening value for a radiative envelope of is not consistent with the best-fit model. (Running the data reduction code found in §6 and restricting to a value of 0.25, we find a global minimum with /DOF=5.01.)
The radii associated with Alderamin are somewhat larger than the typical values expected for a main-sequence A7V star. Our previous investigation of the similarly rapidly rotating star Altair (van Belle et al., 2001), with an identical spectral type of A7IV-V, indicates polar and equatorial sizes that are 30-50% smaller. These increased sizes relative to Altair indicate to us that Alderamin is slightly evolved, perhaps being more adequately classified as an A7IV; this finding is consistent with an age of 0.82 Gyr for Alderamin as quoted by Rieke et al. (2005). This same study found only marginal evidence for excess flux at 24 m, and indicates that there is negligible excess at 2.2 m, and is consistent with the 25 m null result of Laureijs et al. (2002). These results are evidence that the observations presented here examine the photosphere of the star alone and are not contaminated by contributions from a circumstellar disk.
We can compare our data on Alderamin to the models of Girardi et al. (2000), which follow stars of a given mass through their evolution, predicting gravity and temperature; from the values of log(g) predicted for these models, we may derive linear radii. We can compare the location of Alderamin in radius-temperature space to these predicted tracks, as seen in Figure 8; solar metallicity tracks were used, given Alderamin’s near-solar metallicity of [Fe/H]=0.09 (Gray et al., 2003), and the tracks all start an age of =7.8 and are stepped in increments of =0.05. From a simple examination of the location of Alderamin on this plot, three new aspects of the star appear to be revealed: First, it’s evolutionary status of tracking off of the main sequence is confirmed; second, the mass of the object appears to be , which is consistent with Malagnini & Morossi (1990); and third, its age appears to be , roughly 800 Myr, which is consistent with the finding of Rieke et al. (2005). However, basing these interpretations upon these models in particular may be suspect, since the impact of Alderamin’s extreme rotation probably alters its specific isochrone. We may illustrate this by considering the rotation history of the object through conservation of angular momentum.
The moment of inertia for a star may be written as
| (8) |
where is the radius of gyration (Stȩpień, 2000); for the fully convective case, whereas for the fully radiative case. Although Alderamin’s value for is not known in detail, we may consider it for the moment to be constant over the star’s recent evolution off of the main sequence. From the Girardi et al. (2000) plots in Figure 8, we may estimate the average linear size of Alderamin to have increased from to its current value of . However, by conservation of angular momentum, the star’s rotation speed when it was this smaller size would have been , very nearly rotational breakup speed. Such a previous speed is not impossible from dynamical considerations alone, but is far greater than 90% of breakup, which has been argued to be the expected upper limit due to star formation considerations - although this limit is not borne out by the observations (Stassun et al., 1999; Rebull, 2001).
As such, one of two circumstances may have affected the rotation history of Alderamin, independently or in unison. First, the moment of inertia may have changed through changes in the radius of gyration as the ratio of convective to radiative portions of the star changed. Second, the Girardi et al. (2000) evolutionary tracks potentially do not properly describe the radius history of a rapid rotator such as Alderamin. Considerable work on the impact of rapid rotation upon the evolution of massive stars has been done by Maeder & Meynet (eg. Maeder & Meynet (2000)), but solar metallicity model tracks do not appear readily available. Alternatively, rotation speeds in excess of 90% of may be allowed in extreme cases such as these.

8 Conclusions
We have measured the visibility varying due to the apparent oblateness of Alderamin’s disk upon the sky and modeled those data with an appropriate Roche model. This approach allows for an interferometric measurement of the true stellar rotation velocity and latitude-dependent temperature structure, which in turn enabled a more detailed investigation into the underlying rotation environment of this star, and its angular momentum history, than could be afforded by previous spectroscopic measurements of . The determination of the star’s gravity darkening from spatial data alone is a unique challenge to stellar models and consistent with those theoretical expectations. Such rotational speed and shape determinations can potentially be also useful for evaluating stellar seismology data (Gizon & Solanki, 2004). Furthermore, we have demonstrated a technique that can recover a level of detail on rapidly rotating stars that heretofore had been out of reach of direct observational techniques. Verifying a larger test interferometric cohort around less rapidly spinning stars undoubtedly could be key to advances in stellar science.
As detailed in van Belle et al. (2004), a simple examination of the rotational velocity catalog collated by Bernacca & Perinotto (1973) indicates there are over 70 known bright (4) main sequence stars in the northern hemisphere that are rapid rotators with 200 km s-1; examination of bright (8) evolved objects in de Medeiros & Mayor (1999) that have 15 km s-1 indicates there are over 70 potential targets as well. Objects that fit these criteria should exhibit apparent flattening of their disks at the level. Clearly there are numerous opportunities to implement this technique with the new generation of long-baseline optical and infrared interferometers such as the CHARA Array, NPOI, and VLTI, which all have multiple baselines allowing the required stellar disk projection measurements to be made in much shorter observing times. Our CHARA Array follow-up observing campaign of other rapidly rotating stars already has initial results that support this promising line of research.
9 Appendix - a priori Oblateness Estimation for Rapid Rotators
Outside of the rigorous mathematical analysis of observed data for rapid rotators, it is useful to have a shorthand approximation of what the expected oblateness for a rapid rotator should be. This is particularly useful to developing target lists of these types of objects for the CHARA Array and other interferometers. The force of centripetal acceleration at the equator, resulting from the rotation, offsets the effect of gravitation owing to the mass of the star. Under the conditions of hydrostatic equilibrium, uniform rotation, and a point mass gravitational potential, we may derive the equatorial rotational velocity, assuming we view the star at an inclination angle . Under these conditions, we have that
| (9) |
where and are the apparent minor and major stellar radii, and is the stellar mass (cf. Brouwer & Clemence (1961), Elliot & Nicholson (1984), Baron et al. (1989)). Using catalog measurements of (eg. Glebocki & Stawikowski (2000)), and a reasonable estimate for and (for use as ) derived from spectral type, an estimate of the size ratio may be established.
As an example, Malagnini & Morossi (1990) estimate the mass of Alderamin at ; an A7IV-V star should have an approximate radius of (Cox, 2000); in conjunction with a spectroscopic estimate of km/s (Bernacca & Perinotto, 1970), we find that should be approximately , which is good agreement with the solutions presented in Table 8.
References
- Abt & Morrell (1995) Abt, H. A., & Morrell, N. I. 1995, ApJS, 99, 135
- Abt & Moyd (1973) Abt, H. A., & Moyd, K. I. 1973, ApJ, 182, 809
- Baron et al. (1989) Baron, R.L., French, R.G., Elliot, J.L., 1989, Icarus 78, 119
- Bernacca & Perinotto (1970) Bernacca, P. L., & Perinotto, M. 1970, Contributions dell’Osservatorio Astrofisica dell’Universita di Padova in Asiago, 239, 1
- Bernacca & Perinotto (1973) Bernacca, P. L. & Perinotto, M. 1973, Contributi dell’Osservatorio Astrofisico dell’Universita di Padova in Asiago, Padova: Cleup, 1970-1973
- Bidelman (1957) Bidelman, W. P. 1957, PASP, 69, 326
- Blackwell & Lynas-Gray (1998) Blackwell, D. E., & Lynas-Gray, A. E. 1998, A&AS, 129, 505
- Boden et al. (1998) Boden, A.F, et al., 1998, ApJ, 504, L39
- Brouwer & Clemence (1961) Brouwer, D., Clemence, G.M., 1961, in The Solar System III, eds. G.P. Kuiper, B.M. Middlehurst (Chicago:Univ. of Chicago Press), pp. 31-94
- Claret (2000) Claret, A., 2000, A&A, 359, 289
- Claret (2003) Claret, A. 2003, A&A, 406, 623
- Claret & Hauschildt (2003) Claret, A., & Hauschildt, P. H. 2003, A&A, 412, 241
- Collins (1963) Collins, G.W., II, 1963, ApJ, 138, 1134
- Collins (1965) Collins, G.W., II, 1965, ApJ, 142, 265
- Collins & Harrington (1966) Collins, G.W., II, Harrington, J.P., 1966, ApJ, 146, 152
- Collins & Smith (1985) Collins, G.W., II, Smith, R.C., 1985, MNRAS, 213, 519
- Cox (2000) Cox, A. N. 2000, Allen’s astrophysical quantities, 4th ed. Publisher: New York: AIP Press; Springer, 2000. Editedy by Arthur N. Cox. ISBN: 0387987460,
- Crawford et al. (1966) Crawford, D. L., Barnes, J. V., Faure, B. Q., & Golson, J. C. 1966, AJ, 71, 709
- Cutri et al. (2003) Cutri, R. M., et al. 2003, VizieR Online Data Catalog, 2246, 0
- Davis et al. (2000) Davis, J., Tango, W. J., & Booth, A. J. 2000, MNRAS, 318, 387
- de Medeiros & Mayor (1999) de Medeiros, J.R., Mayor, M., 1999, A&AS 139, 433
- Domiciano de Souza et al. (2002) Domiciano de Souza, A., Vakili, F., Jankov, S., Janot-Pacheco, E., & Abe, L. 2002, A&A, 393, 345
- Domiciano de Souza et al. (2003) Domiciano de Souza, A., Kervella, P., Jankov, S., Abe, L., Vakili, F., di Folco, E., & Paresce, F. 2003, A&A, 407, L47
- Douglas (1926) Douglas, A. V. 1926, ApJ, 64, 262
- Dyck et al. (1996) Dyck, H. M., Benson, J. A., van Belle, G. T., & Ridgway, S. T. 1996, AJ, 111, 1705
- Eggen (1963) Eggen, O. J. 1963, AJ, 68, 697
- Eggen (1972) Eggen, O. J. 1972, ApJ, 175,787
- Elliot & Nicholson (1984) Elliot, J.L., Nicholson, P.D., 1984, in Planetary Rings, eds. R. Greenberg, A. Brahic, (Tucson:Univ. of Arizona Press), pp. 25-72
- Gezari et al. (1996) Gezari, D.Y., Pitts, P.S., Schmitz, M., 1996, Catalog of Infrared Observations, edition 3.5
- Girardi et al. (2000) Girardi, L., Bressan, A., Bertelli, G., & Chiosi, C. 2000, A&AS, 141, 371
- Gizon & Solanki (2004) Gizon, L., & Solanki, S. K. 2004, Sol. Phys., 220, 169
- Glebocki & Stawikowski (2000) Glebocki, R. & Stawikowski, A. 2000, Acta Astronomica, 50, 509
- Gray (1980) Gray, D. F. 1980, PASP, 92, 771
- Gray et al. (2003) Gray, R. O., Corbally, C. J., Garrison, R. F., McFadden, M. T., & Robinson, P. E. 2003, AJ, 126, 2048
- Gulliver et al. (1994) Gulliver, A.F., Hill, G., Adelman, S.J., 1994, ApJ, 429, L81
- Henry et al. (2000) Henry, G. W., Fekel, F. C., Henry, S. M., & Hall, D. S. 2000, ApJS, 130, 201
- Hoffleit & Warren (1995) Hoffleit, D. & Warren, W. H. 1995, VizieR Online Data Catalog, 5050, 0
- Johnson & Morgan (1953) Johnson, H.L., Morgan, W.W., 1953, ApJ, 117, 313
- Johnson et al. (1966) Johnson, H. L., Iriarte, B., Mitchell, R. I., & Wisniewskj, W. Z. 1966, Communications of the Lunar and Planetary Laboratory, 4, 99
- Johnson (1968) Johnson, H. L., 1968, in Stars and Stellar Systems, 7, Nebulae and Interstellar Matter, ed. B.M. Middlehurst & L.H. Aller (Chicago: Univ. of Chicago Press), chap. 5
- Jordahl (1972) Jordahl, P.R., 1972, Ph.D. thesis, University of Texas at Austin.
- Kornilov et al. (1991) Kornilov, V. G., Volkov, I. M., Zakharov, A. I., Kozyreva, L. N., Kornilova, L. N., & et al. 1991, Trudy Gosudarstvennogo Astronomicheskogo Instituta, 63, 4
- Laureijs et al. (2002) Laureijs, R. J., Jourdain de Muizon, M., Leech, K., Siebenmorgen, R., Dominik, C., Habing, H. J., Trams, N., & Kessler, M. F. 2002, A&A, 387, 285
- Maeder (1997) Maeder, A., 1997, A&A, 321, 134
- Maeder (2000) Maeder, A., 2000, New Astronomy Reviews, 44, 291
- Maeder & Meynet (2000) Maeder, A., & Meynet, G. 2000, ARA&A, 38, 143
- Mathis (1980) Mathis, J.S., 1980, ARA&A, 28, 37
- McAlister et al. (2005) McAlister, H.A., et al., 2005, ApJ, 628, 439
- Malagnini & Morossi (1990) Malagnini, M.L., Morossi, C., 1990, A&AS, 85, 1015
- Martin & Claret (1996) Martin, E.L., Claret, A., 1996, A&A, 306, 408
- Moreno (1971) Moreno, H. 1971, A&A, 12, 442
- Mozurkewich et al. (1991) Mozurkewich, D., et al., 1991, AJ, 101, 2207
- Ohishi et al. (2004) Ohishi, N., Nordgren, T. E., & Hutter, D. J. 2004, ApJ, 612, 463
- Oja (1996) Oja, T. 1996, VizieR Online Data Catalog, 2182, 0
- Perryman et al. (1997) Perryman, M.A.C., et al., 1997, A&A, 323, 49
- Peterson et al. (2005) Peterson, D.M., et al., 2005, ApJ, accepted for publication
- Pickles (1998) Pickles, A. J. 1998, PASP, 110, 863
- Piirola (1976) Piirola, V. 1976, Observatory and Astrophysics Laboratory University of Helsinki Report, 1
- Press et al. (1992) Press, W.H., Teukolsky, S.A., Vetterling, W.T., Flannery, B.P., 1992, Numerical Receipes in C, Port Chester, Cambridge University Press
- Quirrenbach et al. (1994) Quirrenbach, A., Buscher, D. F., Mozurkewich, D., Hummel, C. A., & Armstrong, J. T. 1994, A&A, 283, L13
- Rebull (2001) Rebull, L. M. 2001, AJ, 121, 1676
- Reiners (2003) Reiners, A., 2003, A&A, 408, 707
- Rieke et al. (2005) Rieke, G. H., et al. 2005, ApJ, 620, 1010
- Schlesinger (1909) Schlesinger, F., 1909, Publ. Allegheny Observatory, 1, 134
- Schlesinger (1911) Schlesinger, F., 1911, MNRAS, 71, 719
- Schmitt (1971) Schmitt, J. L. 1971, ApJ, 163, 75
- Slettebak (1949) Slettebak, A., 1949, ApJ, 110, 498
- Slettebak (1955) Slettebak, A. 1955, ApJ, 121, 653
- Slettebak (1966) Slettebak, A. 1966, ApJ, 145, 126
- Stassun et al. (1999) Stassun, K. G., Mathieu, R. D., Mazeh, T., & Vrba, F. J. 1999, AJ, 117, 2941
- Stȩpień (2000) Stȩpień, K. 2000, A&A, 353, 227
- ten Brummelaar et al. (2005) ten Brummelaar, T., et al., 2005, 628, 453
- Uesugi & Fukuda (1982) Uesugi, A., Fukuda, I., 1982, Revised Catalogue of Stellar Rotational Velocities.
- van Belle et al. (1999) van Belle, G. T., Lane, B.F., Thompson, R.R., The PTI Collaboration, 1999, AJ, 117, 521
- van Belle et al. (2001) van Belle, G. T., Ciardi, D. R., Thompson, R. R., Akeson, R. L., & Lada, E. A. 2001, ApJ, 559, 1155
- van Belle et al. (2004) van Belle, G. T., Ciardi, D. R., Thompson, R. R., & Akeson, R. L. 2004, IAU Symposium, 215, 177
- von Zeipel (1924a) von Zeipel, H., 1924a, MNRAS, 84, 665
- van Belle & van Belle (2005) van Belle, G. T. & van Belle, G., 2005, PASP, accepted for publication
- von Zeipel (1924b) von Zeipel, H., 1924b, MNRAS, 84, 684
- Wright et al. (2003) Wright, C. O., Egan, M. P., Kraemer, K. E., & Price, S. D. 2003, AJ, 125, 359
- Zahn (1992) Zahn, J.-P., 1992, A&A, 265, 115
- Zdanavicius et al. (1969) Zdanavicius, K., et al. 1969, Vilnius Astronomijos Observatorijos Biuletenis, 26, 3
- Zdanavicius et al. (1972) Zdanavicius, K., et al. 1972, Vilnius Astronomijos Observatorijos Biuletenis, 34, 3