11email: krips@ph1.uni-koeln.de; eckart@ph1.uni-koeln.de; rainer@ph1.uni-koeln.de 22institutetext: Institut de Radio Astronomie Millimétrique, 300 rue de la Piscine, 38406 Saint Martin d’Hères, France
22email: neri@iram.fr; downes@iram.fr 33institutetext: Instituto de Astrofísica de Andalucía (CSIC), C/ Camino Bajo de Huétor,24, Apartado 3004, 18080 Granada, Spain; 33email: stephane@iaa.es 44institutetext: Observatorio Astronómico Nacional (OAN)-Observatorio de Madrid, Alfonso XII, 3, 28014 Madrid, Spain
44email: s.gburillo@oan.es 55institutetext: Observatoire de Paris, LERMA, 61 Av. de l’Observatoire, 75014 Paris, France
55email: Francoise.Combes@obspm.fr
Continuum emission in NGC 1068 and NGC 3147:
Indications
for a turnover in the core spectra††thanks: This paper was based on
observations with the IRAM Interferometer. IRAM is supported by
INSU/CNRS (France), MPG (Germany) and IGN (Spain).
We present new interferometric observations of the continuum emission at mm wavelengths in the Seyfert galaxies NGC 1068 and NGC 3147. Three mm continuum peaks are detected in NGC 1068, one centered on the core, one associated with the jet and the third one with the counter-jet. This is the first significant detection of the radio jet and counter-jet at mm wavelengths in NGC 1068. While the fluxes of the jet components agree with a steep spectral index extrapolated from cm-wavelengths, the core fluxes indicate a turnover of the inverted cm- into a steep mm-spectrum at roughly 50 GHz which is most likely caused by electron-scattered synchrotron emission. As in NGC 1068, the spectrum of the pointlike continuum source in NGC 3147 also shows a turnover between cm and mm-wavelengths at 25 GHz resulting from synchrotron self-absorption different to NGC 1068. This strongly resembles the spectrum of Sgr A⋆, the weakly active nucleus of our own galaxy, and M81⋆, a link between Sgr A⋆ and Seyfert galaxies in terms of activity sequence, which may display a similar turnover.
Key Words.:
galaxies: active – Seyferts: individual: NGC 1068 & NGC 3147 – Radio continuum: galaxies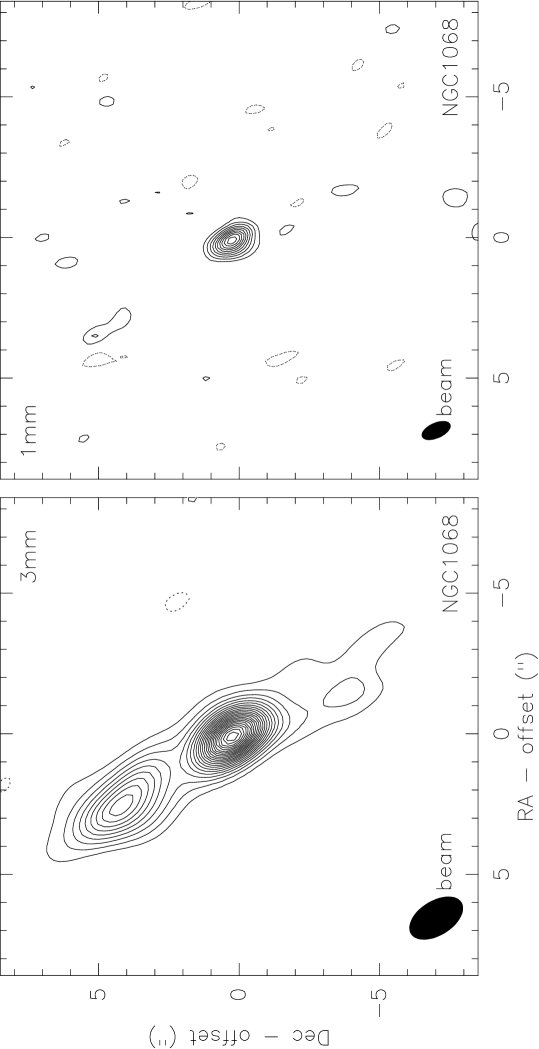

| NGC 1068 | ||||
| Component | RA | Dec | flux | Size |
| (offset)a | (offset)a | densityd | maj.min., PA | |
| [′′] | [′′] | [mJy] | [,∘] | |
| core-3mm | 0.10.1 | 0.20.1 | 360.4 | (0.80.1) (0.60.1), 7010 |
| jet-3mm | 2.50.3 | 4.10.3 | 170.5 | (2.60.1) (1.20.1), 392 |
| counterjet-3mmb | 1.40.5 | 3.80.5 | 70.6 | - |
| core-1mm | 0.10.2 | 0.20.2 | 220.8 | (0.60.1) (0.470.04), 4020 |
| jet-1mmb | 3 | 5 | 61.0 | - |
| NGC 3147 | ||||
| core-3mm | 0.00.1 | 0.10.1 | 5.30.2 | 0.10.5c |
| core-1mm | 0.10.2 | 0.20.2 | 2.80.5 | 0.10.3c |
-
a
offsets with respect to =02h42m40.71s and =∘00′47.94′′ for NGC 1068 (corresponds to the position of the radio core; Muxlow et al. 1996) and to =10h16m53.65s and =73∘24′02.70′′ for NGC 3147 (e.g. Ulvestad & Ho 2001; Krips et al., in prep.).
-
b
The SNR is not sufficient to estimate a size.
-
c
emission most likely point-like
-
d
values have been determined by fitting Gaussian profiles to the visibilities. The uncertainties do not include systematic errors from the flux calibration (10-20%).
1 Introduction
NGC 1068 and NGC 3147 are both part of the NU(clei of)-GA(laxy) project (García-Burillo et al. 2003) that recently succeeded in mapping the molecular gas emission of 12CO(1–0) and 12CO(2–1) in 12 nearby Seyfert and LINER galaxies with high angular resolution and high sensitivity using the IRAM Plateau de Bure Interferometer (PdBI). NUGA primarily aims at analysing the dynamics and distribution of the gas on the smallest possible scales to disentangle the accretion mechanisms of the gas onto the nucleus which are supposed to be strongly correlated with the observed nuclear activity. As a by-product of this project, information on the continuum emission at 1 mm and 3 mm was also gained for NGC 1068 and NGC 3147.
NGC 1068, at a redshift of , is one of the best studied Seyfert galaxies. It is regarded to be the archetype for unification schemes of Seyferts. Khachikian & Weedman (1974) first classified NGC 1068 as Seyfert 2 due to the detection of unpolarized (direct-path) emission lines with narrow widths originating in the Narrow-Line-Region (NLR). The NLR appears to be extended to the North-East with respect to the nucleus (e.g. Groves et al. 2004). The radio jet is found to be located in the same direction (e.g. Gallimore et al. 2004). Emission from the broad line region (BLR) could also be detected through polarized (scattered-path) emission lines with broad line widths (Antonucci & Miller et al. 1985). This strongly suggests that NGC 1068 contains a hidden Seyfert 1 nucleus supporting the unified theory for Seyfert galaxies. The position of the nucleus could be precisely derived by radio continuum observations carried out by Gallimore et al. (2004). They report a compact component with a flat spectrum lying in a maser disk that is most likely the central engine. NGC 1068 is one of the few (i.e. ) extragalactic systems in which maser emission could be detected. With the aid of H2O maser emission, Greenhill & Gwinn (1997) determined the mass of the AGN to 1.7 M⊙in the central 2.2 pc. The bolometric luminosity of NGC 1068 can be derived to a few 10-3Ledd indicating - in terms of Eddington luminosity - a slightly higher radiation efficiency of the accretion and/or a higher accretion rate than in other LLAGN. The molecular gas in NGC 1068 was mapped by Schinnerer et al. (2000, and references therein). It is distributed in a two arm spiral, along a bar and in a warped nuclear ring with two emission peaks which are interpreted as orbit crowding points. Schinnerer et al. (2000) report also on a detection of the 3 mm continuum emission in NGC 1068: two components become visible at this wavelength, a 16 peak at the radio core position and a 3 peak at the position of the radio jet. Going to longer wavelengths, more continuum structure appears (e.g., Ulvestad et al. 1987, Gallimore et al. 1996 & 2004): the central continuum peak splits up into four components, of which two show steep radio spectra (i.e., with ) while the remaining two have flat to inverted spectra (i.e., and ). The inverted spectrum feature (labeled S1 in Gallimore et al. 1996) is associated with the nucleus of NGC 1068 whereas the remaining three components are supposed to be part of the extended jet and counter-jet.
NGC 3147, at a redshift of , is classified as Sbc galaxy hosting a Seyfert 2 nucleus (Ho et al. 1997). ROSAT observations (Roberts & Warwick 2000) unveil an X-ray source at the position of the nucleus which is associated with a supermassive black hole. Assuming the empirical correlation between black hole mass and bulge stellar velocity dispersion (e.g., Gebhardt et al. 2000, Ferrarese & Merritt 2000), the black hole mass can be estimated to 4 M⊙(Ulvestad & Ho 2001). The bolometric luminosity can be determined to 10-4Ledd (Ulvestad & Ho 2001) indicating a slightly higher radiation efficiency of the accretion than in other LLAGN similar to NGC 1068. VLBA and VLBI radio observations also show a pointlike, non-thermal continuum source at the position of the nucleus (Ulvestad & Ho 2001, Anderson et al. 2004, Krips et al. in prep.). The radio spectrum is inverted and no signs of variability are found on timescales of a few years. The CO emission is astonishingly similar to NGC 1068. Besides a double-peaked nuclear ring observed in CO(2–1), spiral arms and/or a ring-like structure become visible at larger scales in IRAM PdBI observations (García-Burillo et al. 2005, Leon et al., in prep.).

2 Observations
2.1 NGC 1068
Observations of NGC 1068 at 3 mm and 1 mm were carried out with the IRAM PdBI in February 2003 using all six antennas in A configuration. The bandpass was calibrated on NRAO150 while phase and amplitude calibration were performed on 0235+164 and 0238-084. CRL618 and MWC349 were chosen to determine the absolute flux scale. The receivers were tuned to the redshifted 13CO(1–0) line (i.e., 109.8 GHz) at 3 mm and to the redshifted 12CO(2–1) line (i.e., 231.1 GHz) at 1 mm. A total bandwidth of 580 MHz with a spectral resolution of 1.25 MHz was used per sideband. Applying uniform weighting111Actually, when speaking of uniform weighting, it rather corresponds to robust weighting which is a compromise between natural and pure uniform weighting. This is a convention in the IRAM GILDAS Packages. in the mapping process, beamsizes are derived to 2.11.2′′ with a position angle (PA) of 32∘at 3mm and to 1.00.6′′ with PA=36∘at 1mm.
2.2 NGC 3147
12CO(1–0) and 12CO(2–1) emission from NGC 3147 were observed with the IRAM PdBI in February 2002 and 2004 using all six antennas in A, B, C, and D configuration. 3C345 was used as bandpass calibrator, while 1546+027, 1044+719 and 0838+710 were chosen as amplitude and phase calibrators. The flux was calibrated on MWC349 and 3C273. The receivers were tuned on the redshifted 12CO(1–0) line (i.e., 114.2 GHz) at 3 mm and to the redshifted 12CO(2–1) line (i.e., 229.9 GHz) at 1 mm. The total bandwidth was set to 580 MHz in each sideband with a spectral resolution of 1.25 MHz. The natural beamsizes are determined to 1.41.2′′ with PA=57∘at 3 mm and to 0.70.5′′ with PA=60∘at 1 mm.
3 Results
The continuum maps at 3 mm and 1 mm were computed from those channels in which no line emission is expected (i.e., Upper Side Band (USB) at 3 mm and Lower Side Band (LSB) at 1 mm). Continuum emission was detected at 3 mm and at 1 mm in both sources.
All cm and mm fluxes are accurate at least to within % accounting also for uncertainties in the flux calibration and systematic errors.
3.1 NGC 1068
3.1.1 3 mm
The 3 mm continuum map is shown in Fig. 1 revealing three different components, one associated with the nucleus, one with the jet and one with the counter-jet. The jet component is elongated in North-East direction, agreeing with results found at cm wavelengths. Also a 6 feature is detected on the opposite side of the nucleus indicating the counter-jet. Schinnerer et al. (2000) detected the core with a flux of 365 mJy and the jet with 3 to 155 mJy at a slightly higher frequency (115 GHz) but missed the counter jet. This agrees well in flux and position with our new data (see Table 1).
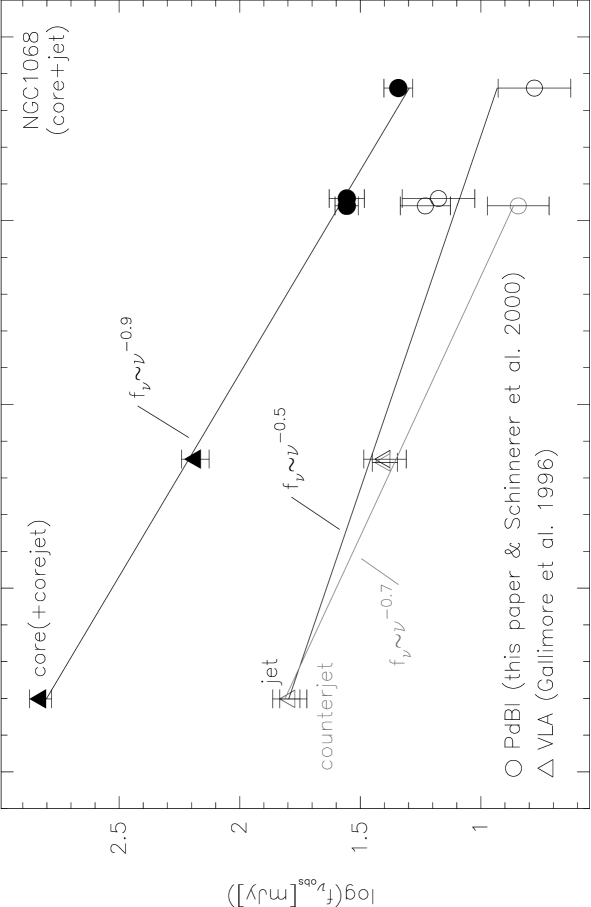
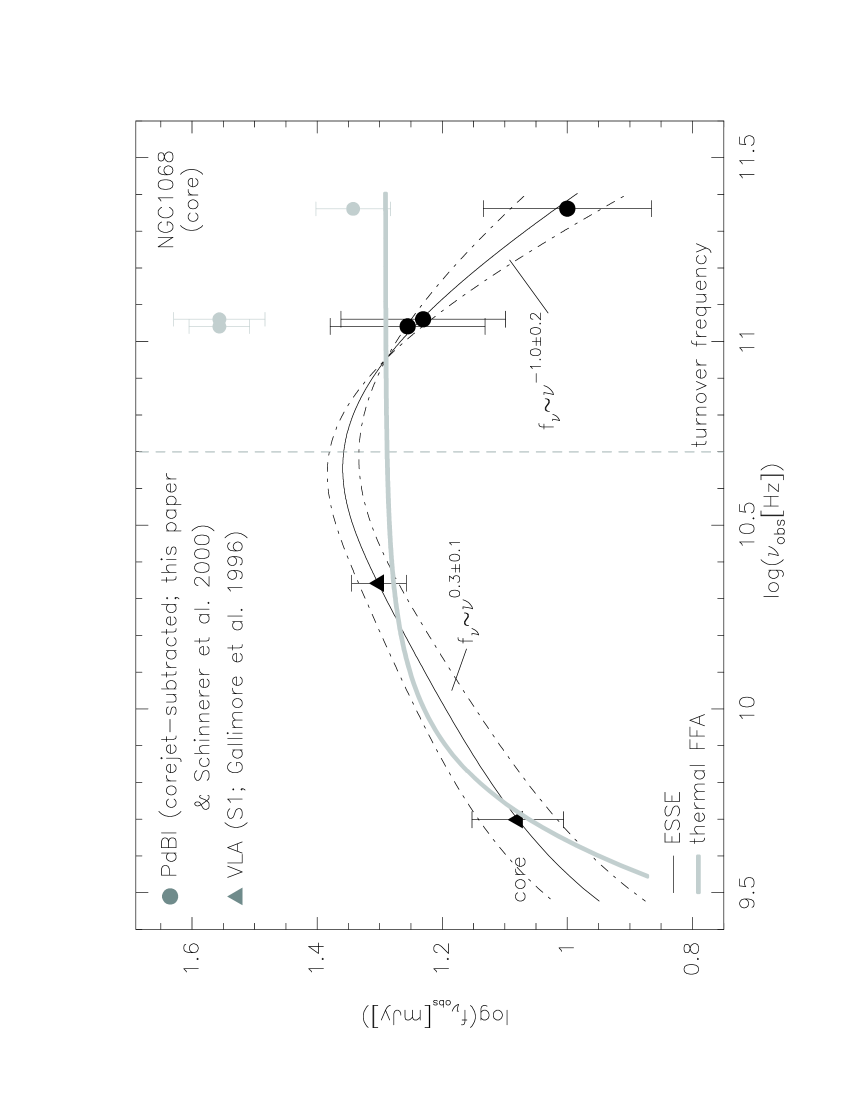
Three elliptical Gaussian profiles were fitted to our 3 mm data. The results are listed in Table 1. The position of the core is determined at =02h42m40.71s and =∘00′47.7′′ consistent with the core position derived at 6 cm (Gallimore et al. 2004). The jet and counter-jet fluxes are plotted in Fig. 3 at different frequencies including radio fluxes estimated by Gallimore et al. (1996). The diagram shows a steep spectral index of () for the jet and for the counter-jet. This is consistent with optically thin synchrotron radiation that is expected for jet emission. The situation for the core is more complex since VLA maps (Gallimore et al. 1996) unveil further subarcsecond components which cannot be resolved with the IRAM PdBI: The PdBI “core” is resolved by VLA into two further jet features (NE,C) with steep spectra and two flat to inverted components (S1,S2) one of which is associated with the nucleus (labeled S1 in Gallimore et al. 1996). An estimate from lower resolution radio maps (Gallimore et al. 1996), not distinguishing between the respective subarcsecond components, indicates a steep spectrum for the overall (inner 2”) region we designated as “core(+corejet)” (i.e. S1+S2+NE+C; =0.9; upper panel of Fig. 3). Thus, optically thin synchrotron radiation from the subarcsecond jet (core-jet; NE+C+S2) most likely dominates the emission at mm-wavelengths. However, since the fluxes of the subarcsecond radio (22 GHz) spots (namely NE,C and S2 in Gallimore et al. 1996) are known, their contribution to our “core(+corejet)” mm-component can be estimated to separate it from the nuclear component S1 and at least a rough estimate for S1 at 3 mm can be given. Assuming the spectrum calculated from Gallimore et al. (1996; middle panel in Fig. 3) for these features, we find that 60% of the 3 mm core(+corejet) still comes from these components (middle panel of Fig. 3). Subtracting this value from the 3 mm fluxes (115 and 110 GHz) allows to compare both with the core (S1) fluxes at 5 GHz of 121 mJy and at 22 GHz of 19.10.6 mJy (VLA, Gallimore et al. 1996). The lower panel of Fig. 3 indicates a drop of the flux from the power law spectrum with towards the 3 mm data. Accounting for the narrower beam at the cm-wavelengths compared to the mm-observations and thus resolution effects, the drop might be even more extreme222Note that the beamsize at 5 GHz is however larger than at 22 GHz.. Another caveat to keep in mind is possible variability. However, the mm fluxes give no hints for any variability between different epochs although a flux variation of 30% has been reported for one of the core-jet components (C) (Gallimore et al. 2004). This needs to be verified with future observations.
3.1.2 1 mm
In our PdBI data from 2003, we clearly detect (2022 mJy/beam) continuum emission at 1 mm (Fig. 1), while Schinnerer et al. (2000) report only an upper limit of the 1 mm continuum of 6 mJy. However, a refined analysis of the earlier Schinnerer et al. (2000) maps shows that also their data contain continuum emission which is consistent to 10% with what we calculate from the new observations. The position of the core derived from the 1 mm data is consistent with the position derived at 3 mm. The flux of the 1 mm core component follows the power law fitted to the lower frequencies in Fig. 3 (upper panel). One has to keep in mind, however, that the core emission at 1 mm might also still be biased by the different core-jet components (NE,C and S2; Gallimore et al. 1996) within the central 1′′ detected with VLA and VLBA. Assuming the spectral indices estimated from the radio fluxes and taking the (VLA) fluxes at 22 GHz (Gallimore et al. 1996), the contribution of these further components (NE,C, S2) to the pure core (S1) emission at 1 mm can be estimated to 60% (middle panel of Fig. 3). The flux of the estimated mm core-jet might be even higher accounting for the higher angular resolution of the cm data compared to the mm data and thus of resolution effects, so that the 1 mm flux of the pure core could still be lower. Subtracting the contribution of the core-jet from the 1mm flux and comparing it with the core flux derived at cm wavelengths by Gallimore et al. (1996), we find further support for a turnover between cm and mm wavelengths (lower panel of Fig. 3). Even if we do not apply a core-jet correction and assume hence the 1 mm emission to be mainly dominated by the core alone, the 1 mm flux is already significantly below the inverted power law spectrum produced by the cm and 3 mm fluxes. Although resolution effects between 3 mm and 1 mm have to be taken into account, they should only play a significant role for the extended core-jet components but not for the core itself since it appears to be quite compact at cm wavelengths (VLA scales). Thus, accounting for all arguments, we think that the turnover is a real intrinsic property of the NGC 1068 nucleus and no artefact of resolution effects or calibration uncertainties.
In general, three mechanisms can be proposed to explain such a low-frequency turnover in NGC 1068 (e.g., Roy et al., 1998, Gallimore et al., 1997 & 2004): (1) synchrotron emission from a plasma with electron self-absorption (SSA), (2) synchrotron emission which is electron-scattered in the obscured central region (ESSE), or (3) thermal free-free absorption from an X-ray heated (thermal FFA), ionized plasma. The spectra in all three cases can be fitted with the following equation (e.g., Kraus 1986):
| (1) |
where is in units of Hz, and and are the respective spectral indices for the optically thick/thin part of the spectrum. In the first case of synchrotron self absorption (SSA) and also in the third case of thermal free-free absorption (FFA), 333 is only an artificial parameter to summarize all three cases in one equation. is 1. In the second case of electron-scattered synchrotron emission (i.e. free-free absorption by a scattering ionised gas; ESSE), is equal to with:
| (2) |
is the electron temperature in units of Kelvin, is the mean square electron density in , and is the path length along the sight line in pc (e.g., Altenhoff et al., 1960; Mezger & Henderson 1967).
Gallimore et al. (1996) already excluded the first scenario based on the low brightness temperatures of 3 K derived at 5 GHz. They argue that this temperature is too low for synchrotron self absorption which generally becomes important at much higher brightness temperatures ( K; e.g., Williams 1963, Kellerman & Owen 1989). We therefore consider only the two latter cases in the following of either electron-scattered synchrotron emission (ESSE) or thermal free-free absorption (FFA) for the S1 component in NGC 1068. As thermal free-free emission is found to have generally and (e.g., Kraus 1986 (Orion or Rosette nebula); Roy et al., 1998), this does not appear to be consistent with the measured spectrum in which the data point at 1 mm lies significantly below the thermal FFA curve (see boldfaced grey solid curve in the lower panel of Fig. 3). However, one important caveat to be considered are resolution effects which might result in an artificial drop of the spectrum between 3 mm and 1 mm. This cannot be totally excluded although it seems likely that this effect has a stronger influence on the extended jet and core-jet components than on the rather compact core (S1). Assuming the ESSE case (see solid and dashed-dotted curves in the lower panel of Fig. 3), the observed spectrum can be nicely reproduced. The fitted optical depth is consistent with an absorbing plasma at K, and an emission measure of cm-6pc agreeing with the values used by Roy et al. (1998) and Gallimore et al. (2004). The turnover frequency can be derived to 5010 GHz for NGC 1068. The error was calculated from the fit assuming equal weighting factors for the data points.
Besides the core emission, a further weak (5) continuum peak is detected at (roughly) the position of the large scale radio jet. The flux is compatible with the steep jet spectrum () extrapolated from lower frequencies.
3.2 NGC 3147
3.2.1 3 mm
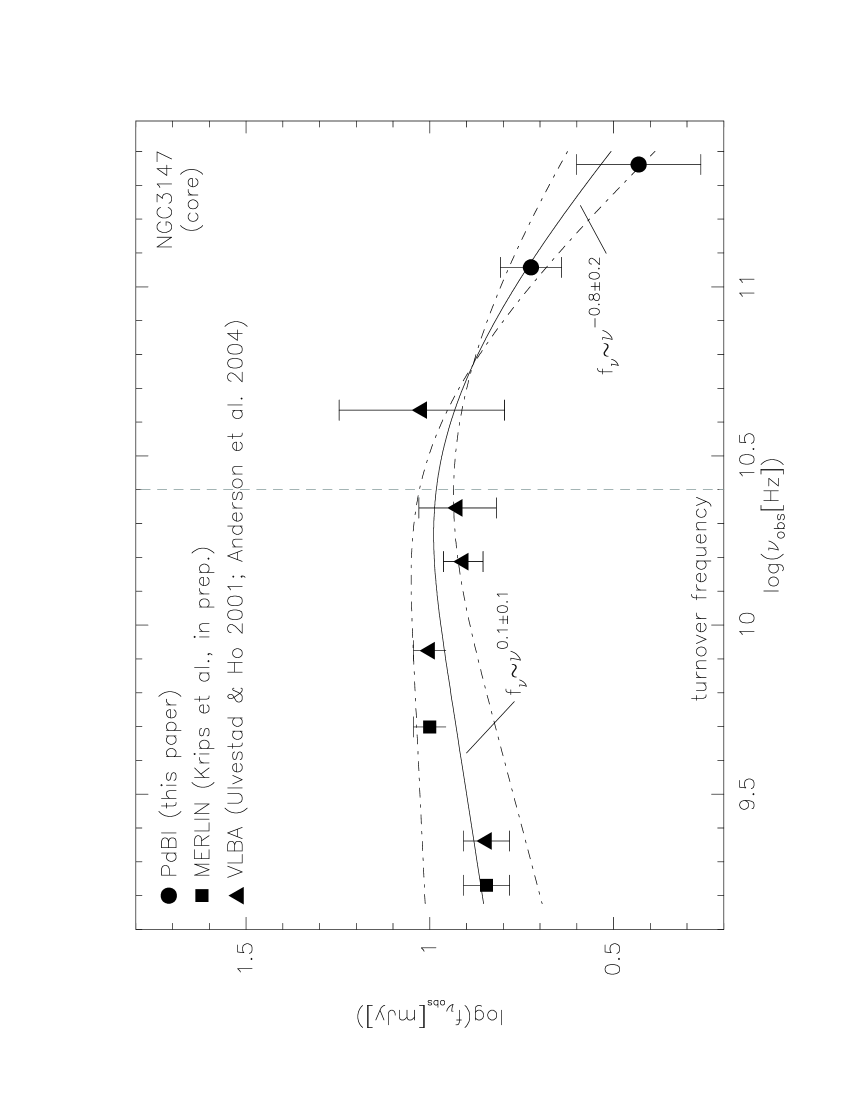
The 3 mm continuum appears pointlike consistent with radio observations at different angular resolutions (VLBA: Ulvestad & Ho 2001, VLBI & MERLIN: Krips et al., in prep.). While the radio fluxes span an inverted spectrum with (), the 3 mm continuum significantly falls below the spectrum extrapolated to the mm domain from radio frequencies (Fig. 4). This cannot be explained by resolution effects. First, NGC 3147 is pointlike almost on all angular scales which is supported by identical radio fluxes at one frequency but derived from different angular resolutions. Second, the radio fluxes derived with MERLIN (i.e., beamsizes are 0.2′′) are higher than the mm-flux determined with the IRAM PdBI (beamsize is 1′′). Variability equally appears to be unlikely. Observations at different epochs, different wavelengths (18cm, 6cm, 3mm & 1mm), and with different instruments (IRAM PdBI, MERLIN & VLBI) give no hints for any variation above 10% of the flux in NGC 3147, neither at cm nor at mm wavelengths (Ulvestad & Ho 2001, Krips et al., in prep.).
3.2.2 1 mm
As already expected from 3 mm and cm wavelengths, the continuum emission at 1 mm is pointlike as well. Based on the results of the radio data, resolution effects can thus be almost discarded. The flux derived at 1 mm further decreases compared to 3 mm and higher wavelengths (see Fig. 4). Thus, the turnover in the spectrum from cm to mm wavelengths indeed is an intrinsic property of the active nucleus in NGC 3147. The relatively high brightness temperature derived at 5 GHz of at least K (e.g., Anderson et al. 2004, Krips et al., in prep.), suggests synchrotron self-absorption to be responsible for the turnover in NGC 3147, different to NGC 1068. By fitting Equation 1 to the data, the turnover frequency can be derived to 2510 GHz.
4 Correlation between radio/mm and X-rays
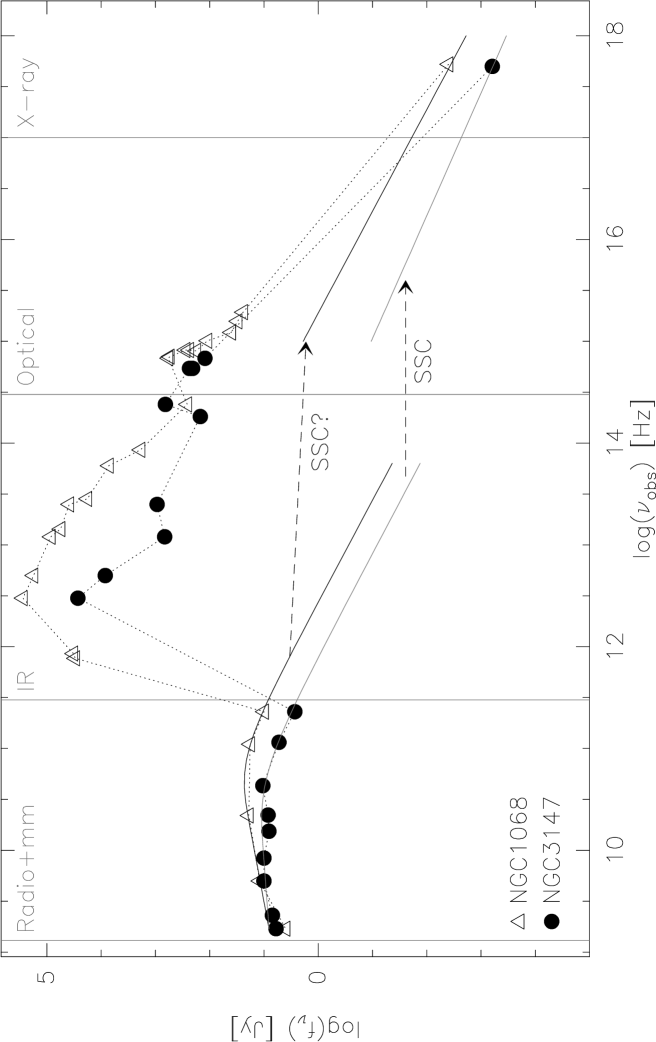
Fig. 5 presents the overall spectrum of NGC 1068 and NGC 3147 from radio to X-ray frequencies. For completeness, infrared and optical fluxes are plotted additionally. The cm/mm data points correspond to those shown in Fig. 3 (bottom) and Fig. 4.
Through Synchrotron Self (inverse) Compton scattering (SSC), the submm-wavelength photons can be up-scattered into the NIR and X-ray domain. Using the formula given by Marscher (1983) and Gould (1979), we can constrain the size of the emitting regions with the observed X-ray fluxes in NGC 1068 (in the case of ESSE) and NGC 3147. To reproduce the observed values, a radius of the order of 100 ( is the Schwarzschild radius) for the emitting region in NGC 1068 and NGC 3147 are needed, assuming a Lorentz factor of a few thousand. While this is consistent with the radio data of NGC 3147, it appears to be too small for NGC 1068, relative to the VLBI images of Gallimore et al. (2004), which suggest a size 10 times larger. Although the X-ray source is assumed to be of the same order, the radio emission originates from an area which is at least an order of magnitude larger (Gallimore et al. 2004). This indicates that, at least in the case of NGC 3147, the underlying physical mechanisms producing the radio and X-ray emission are correlated with each other through SSC whereas the situation in NGC 1068 might be more complicated due to the scattering process and the equation used above might not be appropriate anymore. The correlation between X-rays and radio fluxes via SSC was already reported for quasars (e.g., Roberts & Warwick 2000), the equivalents to NGC 1068 and NGC 3147 at a much higher activity level, and was recently also found for low-power accreting black holes (e.g., Falcke et al. 2004). As a thermal FFA cannot be totally excluded for NGC 1068, a correlation between the radio continuum and X-ray emission is also expected in this case since the absorbing ionized plasma producing the thermal free-free emission is heated by X-rays coming from the AGN.
The turnover frequency of a synchrotron spectrum depends on the magnetic field strength among others. Taking again the equation used by Gould (1979) and Marscher (1983), the magnetic field density can be estimated in the case of NGC 3147. However, this estimate also involves an assumption of the source size and is very sensitive to the assumed value so that it must be taken with caution and rather understood as a consistency check. However, assuming SSC mechanism as discussed above, the X-ray flux set a constraint on the size of the emitting region for NGC 3147 yielding a radius around 100. If we assume this size for NGC 3147, then the turnover frequency of 25 GHz at a flux of 12 mJy implies a magnetic field strength of 10 Gauss. This is 3 times lower than the magnetic field of Sgr A*, for an accretion rate below the Bondi value (Quataert & Gruzinov 2000, Eckart et al. 2004).
5 Summary & Discussion
Continuum emission was detected in NGC 1068 and NGC 3147 with the IRAM PdBI at 3 mm and 1 mm. While the maps of NGC 1068 unveil several extended components in form of a jet, a counter-jet and an extended core, the continuum emission in NGC 3147 appears pointlike. The jet and counter-jet in NGC 1068 were detected for the first time with a large signal-to-noise ratio at mm-wavelengths. Their positions and fluxes are consistent with values obtained from radio observations. Extrapolating the influence of the core-jet (1′′) components seen in VLA maps (Gallimore et al. 1996), i.e. at higher angular resolution, on the measured mm-flux at the position of the core, a turnover in the pure core spectrum is indicated at roughly 50 GHz. However, further observations at higher angular resolution are needed to separate the different components within 1′′ at mm-wavelengths. This will allow to strengthen the case for the turnover indicated here. The situation in NGC 3147 is significantly less speculative. The pointlike structure of its continuum emission discards the influence of resolution effects on the derived fluxes induced by different angular resolutions. The spectrum clearly reveals a turnover from flat (cm) to steep (mm). The turnover frequencies can be determined to 50 GHz for NGC 1068 and to 25 GHz for NGC 3147. While the turnover in the spectrum of NGC 1068 is most likely caused by electron-scattered synchrotron emission (although thermal free-free absorption cannot be totally discarded with our new mm-data), the turnover in the spectrum of NGC 3147 can be associated with synchrotron self-absorption.
The spectra of NGC 1068 and NGC 3147 both remind of the one of Sgr A⋆ at the center of our own galaxy (e.g. Melia & Falcke 2001). Also in M81⋆, the center of M81, hints have been found that its spectrum might have a turnover between cm and mm-wavelengths. The bolometric luminosity (10-5Ledd, Reuter & Lesch 1996) of M81⋆ is intermediate between that of Sgr A⋆ (10-8-10-10Ledd, Melia & Falcke 2001; Yuan et al. 2003) and the 2 Seyfert galaxies NGC 1068 (10-3Ledd) and NGC 3147 (10-4Ledd) and can thus be regarded as link between our weak galactic center and low-luminosity AGN. The similar behaviour of their spectra might be a further hint for this. Turnovers in the synchrotron spectra of compact radio sources have been already identified in quasars before, the other extreme in terms of activity (e.g., Lobanov 1998, Bloom et al. 1999). Giga-Hertz-Peaked (GPS) quasars with turnover frequencies at a few GHz are known since quite a while but quasar spectra peaking at several 10 GHz have been found as well (e.g., Bloom et al., 1999). This further connection from AGN with low radiation efficiencies of the accretion and/or highly sub-Eddington accretion rates over those at somewhat higher efficiencies/rates to the most extreme cases with accretion rates close to the Eddington limit allows to set tighter constraints on the models suggested to explain the different activity levels. Sgr A⋆ in particular provides the unprecedented opportunity to witness the accretion mechanisms at play on scales which are impossible to reach for extragalactic AGN but there is hardly any accretion going on in this case. Studies of the galactic center stimulated the re-emergence of radiatively inefficient accretion flow models (RIAFs, see Melia & Falcke 2001; Quataert 2003), including the advection dominated accretion flow approach (ADAF, e.g., Narayan & Yi 1994) and its derivatives. These models are characterized by low efficiency in converting thermal energy into electromagnetic radiation, but differ in terms of the inner boundary conditions such as the presence of strong winds (e.g., Blandford & Begelman 1999) and/or convection (Quataert & Gruzinov 1999), each of which lead to differing predictions of the detailed spectral energy distribution (SED) and its variability. M81⋆ will be an ideal testbed to broaden the available observational data base and verify, i.e. further constrain the existing models for sub-Eddington accretion. This will enable to set a closer link to somewhat higher or more efficiently radiating systems like NGC 1068 and NGC 3147. Anderson et al. (2004) confronted the measured SED of NGC 3147 with a predicted spectrum from ADAF and jet models. The simple ADAF models reproduce most of the observed spectrum in NGC 3147 but result in a too low radio emission. The same is probably true for NGC 1068 when comparing its spectrum with their models. Including a compact radio jet to the ADAF model (i.e., the optically thick part of the base of a (relativistic) jet (see also Athreya et al. 1997)), the spectra can be better simulated. This supports recent studies which have even found evidence for the jet dominating the nuclear radio emission in LLAGN over RIAFs (e.g., Nagar et al. 2001, Falcke et al. 2004) while emission from black holes accreting close to the Eddington rate are rather dominated by their accretion disks. NGC 1068 clearly shows jet emission on different angular scales. Although thermal free-free emission in the core cannot be totally discarded with our new mm-data, the mm/cm emission appears to be rather consistent with synchrotron emission from a compact component in the core (e.g., the base of the jet) which is electron-scattered by the obscuring torus. NGC 3147 has so far given no hints for any extended jet down to a scale of 1pc but a compact jet cannot be excluded. Although the black hole in NGC 3147 is ten times more massive than in NGC 1068, its bolometric luminosity is an order of magnitude less than in NGC 1068 indicating a lower radiation efficiency of the accretion.
Acknowledgements.
Part of this work was supported by the German Sonderforschungsbereich, SFB, project number 494. SL acknowledges support by DGI Grant AYA 2002-03338 and Junta de Andalucía’. We thank the referee, J.S. Ulvestad, for useful comments that helped to improve the discussion of the data. We are grateful to Linda Tacconi and Eva Schinnerer for providing the reduced IRAM PdBI data published in S00.References
- (1) Altenhoff, W., Mezger, P.G., Wendker, H., & Westerhout, G., 1960, Veröff. Sternw., Bonn, 59, 48
- (2) Antonucci, R.R.J. & Miller, J.S., 1985, ApJ, 297, 621
- (3) Bloom, S.D., Marscher, A.P., Moore, E.M., Gear, W., Ter sranta, H., Valtaoja, E., Aller, H.D., and Aller, Margo F., 1999, ApJS, 122, 1
- (4) Blandford, R.D., & Begelman, M.C., 1999, MNRAS, 303, 1
- (5) Eckart, A., Baganoff, F. K., Morris, M., Bautz, M. W., Brandt, W. N., Garmire, G. P., Genzel, R., Ott, T., Ricker, G. R., Straubmeier, C., Viehmann, T., Schödel, R., Bower, G. C., and Goldston, J. E., 2004, A&A, 427
- (6) Falcke, H., Körding, E., Markoff, S., 2004, A&A, 414, 895
- (7) Ferrarese, L. & Merritt, D., 2000, ApJ, 539, 9
- (8) Gallimore, J.F., Baum, S.A., and O’Dea Ch.P., 1996, ApJ, 458, 136
- (9) Gallimore, J. F., Baum, S. A., and O’Dea, C. P., 1997, Nature, 388, 852
- (10) Gallimore, J.F., Baum, S.A., and O’Dea Ch.P., 2004, ApJ, 613, 794
- (11) García-Burillo, S., Combes, F., Hunt, L. K., Boone, F., Baker, A.J., Tacconi, L.J., Eckart, A., Neri, R., Leon, S., Schinnerer, E., Englmaier, P., 2003, A&A, 407, 485
- (12) García-Burillo, S., Combes, F., Eckart, A., Tacconi, L., Hunt, L., Leon, S., Baker, A., Englmaier, P., Boone, F., Schinnerer, E., Neri, R., Krips, M., to appear in the proceedings of “The Evolution of Starbursts”, August 16-20, 2004, Bad Honef, Germany, ed. Huettemeister, Manthey, Aalto, Bomans
- (13) Gebhardt, K., Bender, R., Bower, G., Dressler, A., Faber, S.M.; Filippenko, A.V.; Green, R., Grillmair, C., Ho, L.C.; Kormendy, J., Lauer, T.R., Magorrian, J., Pinkney, J., Richstone, D., and Tremaine, S., 2000, ApJ, 539, 13
- (14) Gould, R.J.,1979, A&A, 76, 306
- (15) Greenhill, L.J., Gwinn, C.R., 1997, Ap&SS, 248, 261
- (16) Groves, B.A., Cecil, G., Ferruit, P., Dopita, M.A., 2004, ApJ, 611, 786
- (17) Ho, L.C., Filippenko, Al.V., Sargent, W.L.W., 1997, ApJS, 112, 315
- (18) Khachikian, E.Y., Weedman, D.W., 1974, ApJ, 192, 581
- (19) Kellerman, K.I., & Owen, F.N., Radio galaxies and quasars, In Galactic and Extragalactic Radio Astronomy (eds Verschuur, G.L., & Kellermann, K.I:), 563-600 (Springer, New York, 1989)
- (20) Kraus, J.D., Radio Astronomy, Cygnus-Quasar Books, 1986
- (21) Lobanov, A.P., 1998, A&ASS, 132, 261
- (22) Marscher, A.P., 1983, ApJ, 264, 296
- (23) Melia, F. & Falcke, H., 2001, ARA&A, 39, 309
- (24) Mezger, P.G., & Henderson, A.P., 1967, ApJ, 147, 471
- (25) Muxlow, T.W.B., Pedlar, A., Holloway, A.J., Gallimore, J.F., & Antonucci, R.R.J., 1996, MNRAS, 278, 854
- (26) Nagar, N.M., Wilson, A.S., & Falcke, H., 2001, ApJ, 559, 87
- (27) Narayan, R., & Yi, I., 1994, ApJ, 428, 13
- (28) Quataert, E. & Gruzinov, A., 2000, ApJ, 545, 842
- (29) Schinnerer, E., Eckart, A., Tacconi, L.J., Genzel, R. & Downes, D., 2000, ApJ 533, 850
- (30) Reuter, H.-P. & Lesch, 1996, A&A, 310, L5
- (31) Roberts, T.P. & Warwick, R.S., 2000, MNRAS, 315, 98
- (32) Roy, A., Colbert, E.J.M., Wilson, A.S., and Ulvestad, J.S., 1998, ApJ, 504, 147
- (33) Ulvestad, J.S., Neff, S.G., Wilson, A.S., 1987, AJ, 93, 22
- (34) Ulvestad, J.S. & Ho, Luis C., 2001, ApJ 562, L133
- (35) Williams, P. J. S. 1963, Nature, 200, 56
- (36) Yuan, F., Quataert, E., and Narayan, R., 2003, ApJ, 598, 301