Spitzer Space Telescope detection of the young supernova remnant 1E 0102.2-7219
Abstract
We present infrared observations of the young, oxygen-rich supernova remnant 1E 0102.2-7219 (E0102) in the Small Magellanic Cloud, obtained with the Spitzer Space Telescope. The remnant is detected at 24 m but not at 8 or 70 m and has a filled morphology with two prominent filaments. We find evidence for the existence of up to M⊙ of hot dust ( K) associated with the remnant. Most of the hot dust is located in the central region of E0102 which appears significantly enhanced in infrared and radio continuum emission relative to the X–ray emission. Even if all of the hot dust was formed in the explosion of E0102, the estimated mass of dust is at least 100 times lower that what is predicted by some recent theoretical models.
1 Introduction
Young supernova remnants (SNRs) are exciting laboratories for studying energetic phenomena occurring in the interstellar medium (ISM) such as cosmic ray acceleration, nucleosynthesis, dust formation and destruction, and collisionless shock physics (McKee, 2001; Vink, 2004). One small subclass of young SNRs, with less than a dozen members, is the so called oxygen–rich SNRs. These remnants have very high–velocity debris ( km s-1) and high abundances of oxygen, neon, carbon, and magnesium. They are believed to be remnants of the most massive stars (typical mass of M⊙). The oxygen-rich SNRs arise mainly from Type Ib/c supernovae, and their typical representative is Cas A. Another very young oxygen-rich SNR, found in the Small Magellanic Cloud (SMC), is 1E 0102.2-7219 (hereafter E0102), commonly considered as dynamically very similar to Cas A.
E0102 is a well studied object at optical, radio, and X–ray wavelengths. Its kinematic age is approximately 1000 years, making it one of the youngest SNRs known. E0102 is located pc in projected distance NE of the edge of the massive star–forming region LHA 115-N 76C (N 76, Henize 1956). The remnant is a prominent radio source at 6 cm, with a shell-like morphology and a diameter of (Amy & Ball, 1993). X–ray images of E0102 show a faint, filled circular structure that marks the location of hot gas associated with the forward moving blast wave. The bright X–ray ring — mainly due to strong emission lines of O, Ne and Mg — marks the interaction of the reverse shock with the stellar ejecta and shows significant substructure: a bright knot in the southwest with a radial extension or “spoke”, a bright arc in the southeast, and a bright linear feature or “shelf” to the north (Gaetz et al., 2000; Flanagan et al., 2004). All observations point to a very massive progenitor star ( M⊙).
We report here the detection of E0102 at 24 m in the Spitzer Space Telescope (SST) Survey of the SMC555http://celestial.berkeley.edu/spitzer (S3MC). We summarize observations and data reduction strategy in §2. The infrared (IR) morphology of E0102 is presented in §3, and compared with observations at other wavelengths in §4. We discuss the origin of the IR emission associated with the remnant in §5, and summarize our results in §6.
2 Observations and Data Processing
Images presented here were obtained as a part of the S3MC program that images the SMC in all Infrared Array Camera (IRAC) and Multiband Imaging Photometer (MIPS) bands (Bolatto et al., in preparation). The SST mosaics were constructed using the MOPEX data reduction package (Makovoz & Marleau, 2005). The angular resolution is 2″, 6″and 18″, at 8, 24 and 70 m, respectively. All images were flat-fielded to remove the residual background. For the 24 m image, a fourth order polynomial function was modeled for each image row around the SNR and subtracted to properly separate the IR emission associated with the remnant from the surrounding diffuse emission associated with N76. The final images have a noise level of 0.07, 0.08, and 0.5 MJy sr-1 at 8, 24, and 70 m, respectively.
3 1E 0102.2-7219 at 24 and 70 m
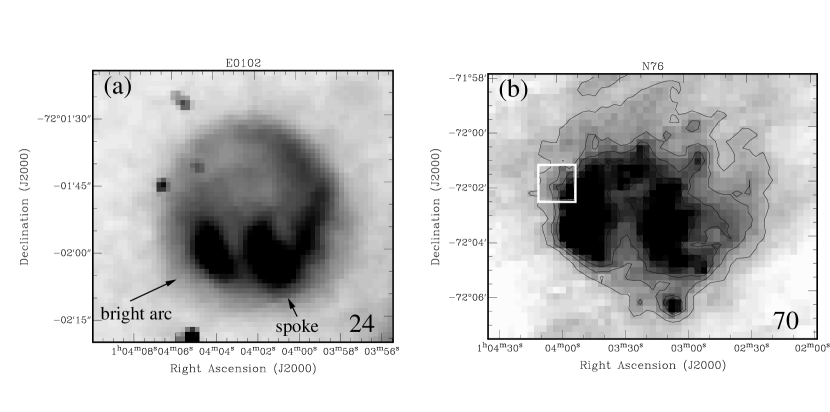
E0102 is prominent in the 24 m SST image, while it is not clearly detected in any of the other SST bands at the depth of our observations. The 24 m MIPS image of E0102 is shown in Figure 1a. The remnant displays an almost filled morphology, with some limb brightening along the west side, and two bright elongated knots of emission to the south. The two bright knots, with a mean intensity of MJy sr-1, have major axes parallel to each other. The bigger and slightly brighter knot to the west corresponds to the “spoke” feature seen in X–rays, while the smaller knot to the east is spatially coincident with the bright arc seen in the X-ray ring (Gaetz et al., 2000; Flanagan et al., 2004).
Conversely, at 70 m and with the resolution provided by the SST (18″), it is not easy to extricate the remnant from the extended IR emission from the nearby H II region N 76. Figure 1b shows the MIPS image of N 76 at 70 m, where the white box represents the area around E0102 that is shown in Figure 1a. E0102 is not obviously detected at 70 m, although there is a small bump present in the low-level IR contours exactly at the remnant’s position. The measured flux density of the whole remnant at 24 m is mJy, while 1- upper limits at 8 and 70 m are 3 and 20 mJy, respectively. The resultant flux density ratios are , and .
4 Comparison with X-ray and radio continuum data
Observations of young SNRs at different wavelengths trace different regions/stages of the SNR/ISM interaction. The X–ray emission arises from both forward and reverse shocks. The hotter outer ring identifies the forward shock, while the bright, inner ring originates from the reverse-shocked stellar ejecta, and is seen in various emission lines (Hayashi et al., 1994; Flanagan et al., 2004). The 6 cm radio continuum image traces synchrotron emission from ultra-relativistic electrons accelerated by the expanding supernova shock wave, and marks the extent of the forward shock (Amy & Ball, 1993). In young SNRs, strong radio continuum emission can also be found in the contact region between the forward and reverse shocks (DeLaney et al., 2004). The IR emission associated with young SNRs can originate from several different mechanisms (see Section 5.1 for discussion).
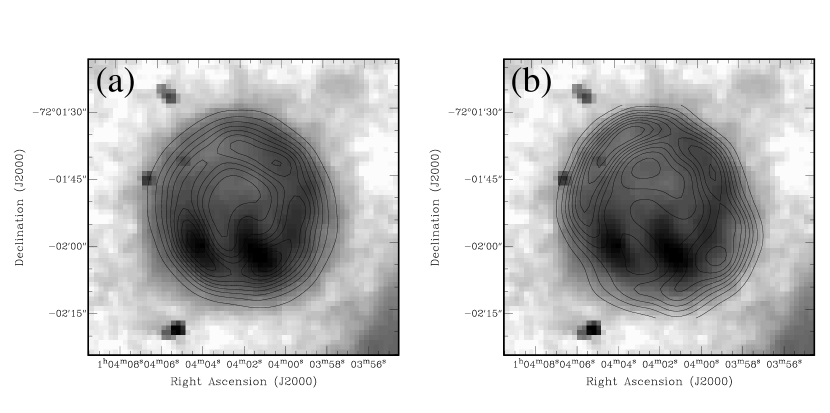
The comparison between the 24 m and X–ray images of E0102 reveals surprisingly similar structures despite the very different wavelengths and emission mechanisms. The SST 24 m image of E0102 overlaid with the Chandra X–ray contours from Gaetz et al. (2000) is shown in Figure 2a. The position and curvature of the two IR knots agree remarkably well with those seen in the X–rays. The “spoke” has a very similar size in both the IR and X–ray data while the bright arc is more confined in the IR. The region on the northeast side has the lowest intensity at 24 m, again in agreement with X-ray observations. Despite these similarities, some differences are also apparent. For example, while the X–ray image has a high contrast, edge–brightened ring structure, the 24 m image displays a lower contrast between the ring and the central region. In addition, the intensity of the IR emission in the limb does not decrease as sharply towards the edge of the SNR as the X-ray emission does.
The morphology of the IR emission is less similar to that seen in the radio continuum distribution. Figure 2b shows a comparison of the 24 m emission and the 6 cm image by Amy & Ball (1993). The IR emission extends all the way to the edge of the radio continuum distribution. Only in the southwestern part is the radio continuum emission significantly more extended than the IR emission. The IR knots do not have corresponding features in the radio continuum.
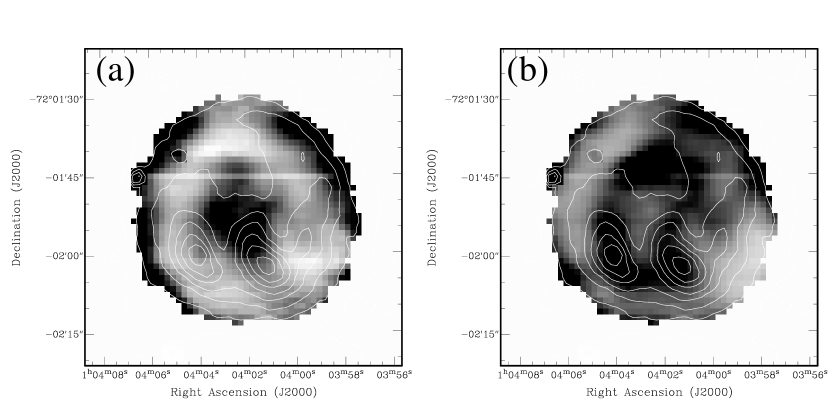
For a more quantitative comparison we convolved and regridded the X–ray and 6 cm images to match the resolution and pixel size of the 24 m image. We then normalized each image to its peak value (each normalized image has a peak value equal to 1). The normalization factors were: 4.7 MJy sr-1, counts arcsec-2 s-1, and 177 mJy beam-1, for the 24 m, X–ray, and 6 cm images, respectively. Three ratio images were then derived from the normalized images: 24 m/X–ray (Figure 3a), 24 m/6 cm (Figure 3b), and 6 cm/X–ray (not shown). Figure 3a emphasizes the good spatial correlation between the 24 m emission and the bright X–ray ring. The almost featureless white ring has a typical pixel value of . The bright arc is almost invisible in this ratio image, while only the north part of the “spoke” is noticeable, with a slightly higher ratio of . The SNR’s edges are mainly dark, with a higher ratio (), emphasizing that the 24 m distribution decreases less sharply than the X–ray distribution. The striking feature in this figure is the central region of the SNR, particularly between the two IR knots, which has the highest IR intensity relative to the X–ray intensity, . At the same location in the IR/radio ratio image (Figure 3b) there is a relatively low ratio (), indicating enhanced synchotron emission (at 6 cm). The ratio image in Figure 3b shows a thinner ring with a larger radius, reaching the edge of the forward shock. This image has many more significant features, emphasizing the generally poor spatial correlation between the IR and radio continuum distributions. The two knots are prominent in this image as their IR intensity is in significant excess relative to the radio continuum intensity. The region on the northeast side of the SNR with the lowest intensity at 24 m stands out in this ratio image as it appears faint in the radio relative to the IR.
5 Discussion
5.1 Origin of IR emission
E0102 is the first SNR in the SMC detected in the IR, and it is a prominent object at 24 m. Our comparison of the 24 m image with radio and X–ray observations suggests that the IR emission is associated with both forward and reverse shocks. The noticeable excess of the IR emission relative to the bright X–ray ring suggests the presence of thermal dust continuum emission associated with the SNR and originating from the circumstellar and/or interstellar dust being heated by the X–ray emitting plasma. For collisionally heated interstellar dust grains, with a grain radius of 0.01 m and immersed in a hot gas with cm-3 and K, the expected dust temperature is K (based on Dwek 1987).
However, circumstellar or interstellar dust grains embedded in the hot SN cavity are destroyed by sputtering and their lifetime is given by yr, where is the density of the hot post-shock cavity (in cm-3), is the radius of dust grains (in m), and the assumed temperature is K (Dwek & Werner, 1981). Assuming a typical size for small dust grains in the SMC m (Stanimirović et al., 2000) and knowing that the grains have to survive for the age of E0102 (103 yr), we estimate cm-3 for the density of the post-shock cavity. This is in agreement with estimated densities from modeling UV/optical emission lines (Blair et al., 2000).
5.2 Hot dust in 1E 0102.2-7219
Our measured flux density at 24 m and upper limits at 8 and 70 m suggest that the IR emission peaks around 24 m and sharply falls off toward shorter and longer wavelengths. This is suggestive of the existence of hot dust associated with the SNR, with a temperature of K. In this scenario, our 1- upper limits at 8 and 70 m are slightly higher than the expected IR flux densities for a quasi-blackbody spectrum at K (). We have taken into account the contribution from the synchrotron emission, extrapolated from radio measurements (Payne et al., 2004), which is not significant (only mJy at 24 m). The estimated temperature of hot dust in E0102 is in accord with expectations for the collisionally heated interstellar and/or circumstellar dust.
However, the two bright X–ray knots and a significant fraction of the bright X–ray ring structure correlate spatially very well with the IR distribution. This suggests that a fraction of IR emission is most likely associated with the reverse shock as well, and may even be largely due to line emission. The MIPS band at 24 m contains emission lines of [OIV] at 25.88 m and [FeII] at 25.98 m. Both lines were observed in the young Galactic SNRs RCW103 (Oliva et al., 1999) and Cas A (Arendt et al., 1999). The fact that E0102 is detected only at 24 m, as well as the fact that this is the only SNR we detect in these SST observations (for discussion see Bolatto et al., in preparation), also argue in favor of a significant contribution from emission lines of [OIV] and/or [FeII]. As Fe is found to be almost absent, to a level of relative to O, in the ejecta of E0102 (Hayashi et al., 1994; Blair et al., 2000) the line emission of [OIV] is more likely to affect our 24 m measurements. Future SST spectroscopic observations (J. Rho, private communication) will be able to tell us the exact contribution of [OIV] to the IR flux at 24 m. For a preliminary estimate we use the 24 m/X–ray ratio image (Figure 3a) and assume that all the IR emission in excess to X–ray emission (pixels with values , mainly in the central region and at the SNR’s edges) correspond to the dust continuum emission. All other IR emission (IR emission that correlates well with the X–ray emission) is predominantly due to [OIV] emission. By integrating the 24 m image over these two exclusive subsets, we estimate that % of the total IR emission from E0102 could be due to the line emission.
If we assume the dust mass absorption coefficient cm2 g-1 (Draine & Lee, 1984) and a distance of 60 kpc (Westerlund, 1991), we estimate the total mass of hot dust associated with the SNR to be M⊙. As shown above, up to 60% of the 24 m flux could be due to the line emission. This gives a lower limit on the mass of hot dust associated with the SNR, M⊙. Even if all the hot dust traced at 24 m was formed in the explosion of E0102, the estimated mass of dust is significantly lower than what is expected from some recent theoretical models. For example, Todini & Ferrara (2001) suggested that a large amount of dust could be formed in explosions of core-collapse SNRs even in early galaxies with very low metallicity; for a progenitor star with a mass of 12–35 M⊙ this model predicts M⊙. This range is further predicted to increase by a factor of 2–3 as the metallicity approaches the solar value. With the metallicity of the solar value, the amount of dust we estimate for E0102 is at least a factor of 100 lower than the lowest predicted value. It is interesting, though, that the amount of hot dust in E0102 is only a few times lower than that found in the recent measurement of hot dust in Cas A (Hines & et al., 2004), although the two SNRs occurred in very different interstellar environments.
6 Conclusions
We have obtained IR observations of the young, oxygen-rich SNR E0102 as a part of a large program to image the SMC with the SST in all available bands. The remnant is detected only at 24 m, and its IR distribution has a filled morphology with two prominent elongated filaments. Our comparison of IR observations with the existing X–ray and radio continuum images suggests that the IR emission is most likely associated with both reverse and forward shocks. We find evidence for the existence of up to M⊙ of hot dust at a temperature of K, associated with the remnant. The [OIV] emission line may be contributing significantly (up to 60%) to our flux measurement at 24 m. The hot dust is mainly located in the central region of E0102 which appears significantly enhanced in IR and radio continuum emission relative to the X–ray emission. The amount of dust associated with E0102, under the assumption that all the dust was formed during the SN explosion, is at least 100 times lower than what is predicted by some recent theoretical models for dust production in the ejecta of core-collapse supernovae.
References
- Amy & Ball (1993) Amy, S. W. & Ball, L. 1993, ApJ, 411, 761
- Arendt et al. (1999) Arendt, R. G., Dwek, E., & Moseley, S. H. 1999, ApJ, 521, 234
- Blair et al. (2000) Blair, W. P., Morse, J. A., Raymond, J. C., Kirshner, R. P., Hughes, J. P., Dopita, M. A., Sutherland, R. S., Long, K. S., & Winkler, P. F. 2000, ApJ, 537, 667
- DeLaney et al. (2004) DeLaney, T., Rudnick, L., Fesen, R. A., Jones, T. W., Petre, R., & Morse, J. A. 2004, ApJ, 613, 343
- Draine & Lee (1984) Draine, B. T. & Lee, H. M. 1984, ApJ, 285, 89
- Dwek & Werner (1981) Dwek, E. & Werner, M. W. 1981, ApJ, 248, 138
- Flanagan et al. (2004) Flanagan, K. A., Canizares, C. R., Dewey, D., Houck, J. C., Fredericks, A. C., Schattenburg, M. L., Markert, T. H., & Davis, D. S. 2004, ApJ, 605, 230
- Gaetz et al. (2000) Gaetz, T. J., Butt, Y. M., Edgar, R. J., Eriksen, K. A., Plucinsky, P. P., Schlegel, E. M., & Smith, R. K. 2000, ApJ, 534, L47
- Hayashi et al. (1994) Hayashi, I., Koyama, K., Ozaki, M., Miyata, E., Tsumeni, H., Hughes, J. P., & Petre, R. 1994, PASJ, 46, L121
- Henize (1956) Henize, K. G. 1956, ApJS, 2, 315
- Hines & et al. (2004) Hines, D. C. & et al. 2004, ApJS, 154, 290
- Makovoz & Marleau (2005) Makovoz, D. & Marleau, F. R. 2005, PASP, in press, astro-ph/0507007
- McKee (2001) McKee, C. F. 2001, in AIP Conf. Proc. 565: Young Supernova Remnants, 17–28
- Oliva et al. (1999) Oliva, E., Moorwood, A. F. M., Drapatz, S., Lutz, D., & Sturm, E. 1999, A&A, 343, 943
- Payne et al. (2004) Payne, J. L., Filipović, M. D., Reid, W., Jones, P. A., Staveley-Smith, L., & White, G. L. 2004, MNRAS, 355, 44
- Stanimirović et al. (2000) Stanimirović, S., Staveley-Smith, L., van der Hulst, J. M., Bontekoe, T. R., Kester, D. J. M., & Jones, P. A. 2000, MNRAS, 315, 791
- Todini & Ferrara (2001) Todini, P. & Ferrara, A. 2001, MNRAS, 325, 726
- Vink (2004) Vink, J. 2004, Nuclear Physics B Proceedings Supplements, 132, 21
- Westerlund (1991) Westerlund, B. E. 1991, in IAU Symp. 148: The Magellanic Clouds, 15