Imprint of Inhomogeneous Reionization on the Power Spectrum
of Galaxy Surveys at High Redshifts
Abstract
We consider the effects of inhomogeneous reionization on the distribution of galaxies at high redshifts. Modulation of the formation process of the ionizing sources by large scale density modes makes reionization inhomogeneous and introduces a spread to the reionization times of different regions with the same size. After sources photo-ionize and heat these regions to a temperature K at different times, their temperatures evolve as the ionized intergalactic medium (IGM) expands. The varying IGM temperature makes the minimum mass of galaxies spatially non-uniform with a fluctuation amplitude that increases towards small scales. These scale-dependent fluctuations modify the shape of the power spectrum of low-mass galaxies at high redshifts in a way that depends on the history of reionization. The resulting distortion of the primordial power spectrum is significantly larger than changes associated with uncertainties in the inflationary parameters, such as the spectral index of the scalar power spectrum or the running of the spectral index. Future surveys of high-redshift galaxies will offer a new probe of the thermal history of the IGM but might have a more limited scope in constraining inflation.
Subject headings:
cosmology: theory – galaxies: formation1. Introduction
The reionization of the cosmic neutral hydrogen, left over from the big bang, was an intrinsically inhomogeneous process (Barkana & Loeb, 2004; Furlanetto & Loeb, 2005). The basic cause of this inhomogeneity is modulation by large scale structure of the formation process of the ionizing sources. The scatter in the local matter density produces corresponding scatter in physical observables during the epoch of reionization. In particular, modulation of the formation of the first sources by large scale density modes will introduce scatter into the redshift at which reionization is completed in different regions due to the scatter in local matter density (Wyithe & Loeb, 2004). This implies that the redshift of reionization is not a single number that is universally applicable to all regions of the universe, but rather follows a distribution which strongly depends on the physical size of the region under consideration (Barkana & Loeb, 2004; Wyithe & Loeb, 2005a). By a fixed redshift, different regions of a given size expand and cool by different amounts since they were reheated by reionization at different times. Inhomogeneous reionization leaves scars on the IGM in the form of a scale-dependent distribution of temperatures and densities.
The fluctuations in the IGM temperature affect galaxy formation by increasing the minimum mass of a dark matter halo that would accrete gas from the photo-heated IGM (Haiman et al., 1996; Dijkstra et al., 2004). Since the temperature fluctuations are scale dependent, the variance of the distribution of galaxies will also be strongly scale dependent. This will strongly influence the power spectrum of fluctuations in the galaxy distribution and alter its shape relative to the underlying power spectrum of the dark matter. Previous treatments of the reheating feedback (Barkana & Loeb, 2000; Efstathiou, 1992) assumed that the photo-heating of the IGM and the corresponding suppression of galaxy formation was uniform. In this paper we explore the implications of the non-uniformity of this process.
Future observations of the high redshift galaxy power spectrum, , may be used to constrain cosmological parameters. Since the scale at which the dark matter power spectrum becomes non-linear is smaller at high redshift, the high-redshift galaxy surveys would be able to probe smaller scales (i.e. modes with a higher wavenumber ) than their low-redshift counterparts such as SDSS or 2dF. The combination of the small scale data along with low redshift galaxy surveys and cosmic microwave background (CMB) measurements, may significantly improve our ability to constrain inflationary parameters. This is particularly true for the spectral index , and the running of the spectral index , since the small scale observations increases the range of –modes over which these inflationary parameters can be constrained.
The Cosmic Inflation Probe (CIP) is a proposed mission to undertake such a high redshift galaxy redshift survey (Melnick et al., 2005). CIP is designed to be a space-based large area galaxy redshift survey between m and m, that would observe galaxies in H emission within the redshift interval to . In such a survey, the galaxy power spectrum could be determined to an exquisite precision of over the wavenumber interval of to comoving . Assuming linear bias these observations could potentially constrain the spectral index to better than . However, we will show in this paper that the corrections to the galaxy power spectrum imprinted by the scale dependent fluctuations of the IGM temperature after reionization are far greater than the existing uncertainties in the inflationary parameters.
The organization of the paper is as follows. In §2 we discuss the manner by which large scale modes would introduce scatter into the redshift of reionization, and how this will impact galaxy formation. In §3 we present numerical results for the imprint of fluctuations in the IGM temperature on the galaxy power spectrum. Finally, §4 summarizes our main conclusions. We adopt the standard CDM cosmological model consistent with the WMAP data (Spergel et al., 2003), with the parameters , , , , and . All distances and wavenumbers throughout the paper are in comoving coordinates.
2. Inhomogeneous Reionization
As discussed in §1, the process of reionization was inhomogeneous due to the modulation of structure formation by large scale density modes. The associated fluctuations in the redshift of reionization produced corresponding fluctuations in the temperature and density of the photo-ionized IGM. Since different regions were reionized at different times, they cool by different amounts and therefore obtain a distribution of temperatures at any redshift slice of the universe. We will assume that all reionizing sources had the same spectrum and therefore photo-heated the local IGM to the same temperature. It is the distribution of reionization redshifts, not the scatter in the photo-heated temperatures, that is assumed to produce the distribution in IGM temperatures in our formulation111Other sources of temperature fluctuations, such as spatial variations in the spectrum of the ionizing sources (resulting from variations in the relative contributions from quasars or stars, for example) would only strengthen our basic conclusion that the imprint of inhomogeneous reionization on is far greater than the uncertainty associated with the inflationary initial conditions. This temperature distribution produces scatter in physical observables in the IGM, such as the galaxy formation rate.
2.1. Fluctuations in the Redshift of Reionizaton
Any region of size in the universe has a probability distribution for its local matter density which will change the redshift at which the collapsed fraction of matter in the region exceeds some threshold and makes the region reionized (Barkana & Loeb, 2004). This threshold is determined by the astrophysics of the problem, such as the star formation efficiency, the radiation spectrum, the escape fraction of ionizing photons from galaxies, as well as the clumping factor of the high redshift IGM (Furlanetto et al., 2004a). However, given the redshift of reionization222This redshift corresponds to when an average () region will be ionized. We assume that voids () are ionized by nearby overdense regions at (so this is not the average but rather the completion redshift of reionization)., , Barkana & Loeb (2004) showed that fluctuations around this redshift are independent of these astrophysical complications. The large-scale polarization anisotropies of the CMB (Kogut et al., 2003) and the scale of the ionized regions around quasars at (Wyithe & Loeb, 2004; Mesinger & Haiman, 2004; Wyithe et al., 2005) indicate that the redshift of reionization is most likely between and . Long wavelength density fluctuations contribute to the background density and alter the rate of evolution within a region with respect to the background. This implies that the time at which the collapsed fraction of the perturbed region reaches a reionization threshold will be randomly shifted with respect to the time at which an unperturbed region reaches the threshold (Bardeen et al., 1986; Barkana & Loeb, 2004). The collapsed fraction in the modulated region can be equated to the collapsed fraction in an unperturbed region by shifting the redshift of the perturbed region by ,
| (1) |
where is the overdensity of the region under consideration of radius and is the collapse threshold at redshift . The mass variance, namely the root-mean-square fluctuation in mass of regions of size , is defined as
| (2) |
where is the Fourier Transform of the window function. We adopt a top-hat window function in real space of radius with the Fourier Transform
| (3) |
There is a minimum mass of dark matter halos into which the cosmic gas can collapse, dissipate, fragment and eventually form stars (White & Rees, 1978; Rees & Ostriker, 1977). In fact there are two independent minimum masses: (i) the Jeans mass, which delineates the mass scale when gravitational forces exceed baryonic pressure support; (ii) the cooling mass, below which the gas cooling time is longer than the halo dynamical time and fragmentation into stars is not possible. Depending on the thermal state of the IGM, either mass scale will determine the minimum galaxy mass. In the pre-reionization universe, where the IGM is extremely cold and the minimum mass is set by the requirement that the cooling time be less than the dynamic time. While the original reionizing sources can be formed through dissipation and fragmentation caused by H2 cooling, feedback effects may have photodissociated much of the H2 in the universe and required future dissipation and fragmentation to proceed by atomic hydrogen line cooling (Haiman et al., 1997). The minimum virial temperature for atomic Hydrogen cooling is K, this consideration sets the minimum virial radius, , in equation (1).
Once the IGM is reionized and photo-heated to a characteristic temperature of K, the Jeans mass will exceed the cooling mass. In fact, we will see in the next section that the Jeans mass is replaced by the filtering mass, which incorporates the entire IGM thermal history. Nevertheless, we will assume that the initial minimum scale for ionizing sources is given by the requirement that the halo can through atomic Hydrogen line transitions.
Equating the arguments in equation (1), we can solve for the fluctuation in the reionization redshift (Barkana & Loeb, 2004)
| (4) |
where is approximately constant at high-redshift. Since is a random variable drawn out of a Gaussian probability distribution with zero mean and variance , is also a random variable. The relation between and is a linear transformation, and so the distribution of is Gaussian, with a different variance. In this paper we will use Monte-Carlo sampling to calculate the distribution of physical quantities, such as reionization redshift, gas temperature and fluctuations in the galaxy number density. Throughout the paper we ensure that our mass density fluctuations are always physical () and uncollapsed () by discarding regions that violate either of these conditions. We also assume that voids, regions with , will be photo-ionized by neighboring overdense regions; and so all voids will be reionized at .
Figure 1 shows the standard deviation of the fluctuations in the redshift of reionization as a function of region size. As the size of a region increases the scatter in reionization redshift fluctuations decreases. On scale Mpc the fluctuations in the redshift of reionization become substantial.

2.2. High Redshift Galaxy Formation
The baryons traced the temperature of the CMB with until they thermally decoupled from it at (Loeb & Zaldarriaga, 2004), after which they cooled adiabatically with until the first galaxies formed. These galaxies produced photons above the Lyman limit ( eV) that ionized and photo-heated the IGM to a temperature set by the slope of their ionizing spectrum. If stars were the dominant source of reionization, then the IGM was heated to a temperature – K (with the precise value depending on the initial mass function of stars). After being reionized the gas cooled predominantly due to adiabatic cooling through its Hubble expansion, but at high redshift () the evolution of the gas temperature was also determined by Compton cooling off the CMB and photo-ionization heating (Hui & Haiman, 2003). In overdense regions, the gas eventually experienced adiabatic heating as it broke away from the Hubble flow and condensed under the local gravitational pull. This effect will modify our results only on the smallest scales. Even though filaments and pancakes may form at these high redshifts, the structures are typically not virialized. One (or two) dimensions may collapse early but other directions still expand and so the filamentary gas experiences both adiabatic heating and cooling (Hui & Gnedin, 1997). Numerical simulations of the intergalactic medium indicate that our approximate treatment holds for most of the gas mass (see e.g., Fig. 1 and top left panel of Fig. 2 in Gardner et al., 2003).
In our simplified treatment, we assume instantaneous reionization of hydrogen and ignore reionization of helium. Gradual photo-ionization of hydrogen would keep the IGM at a high temperature for a longer period of time before cooling processes begin to work. We nevertheless include recombinations of the ionized IGM and the heat input from subsequent photo-ionizations. If He I reionization occured at a similar redshift as H I, it will heat the IGM to a somewhat higher temperature; however, the temperature of the reionized IGM is uncertain by an even larger factor due to the unknown spectrum of the ionizing radiation. He II reionization is expected to heat the IGM at a lower redshift, – (Zheng et al. 2004; Theuns et al. 2002), for which the characteristic mass scale, 333The characteristic mass scale is implicitly defined through the relationship ., above which the abundance of dark matter halos is exponentially suppressed, is higher than the mass scale affected by the high IGM temperature. These circumstances reduce the influence of He II reionization on the galaxy power-spectrum at low redshifts.
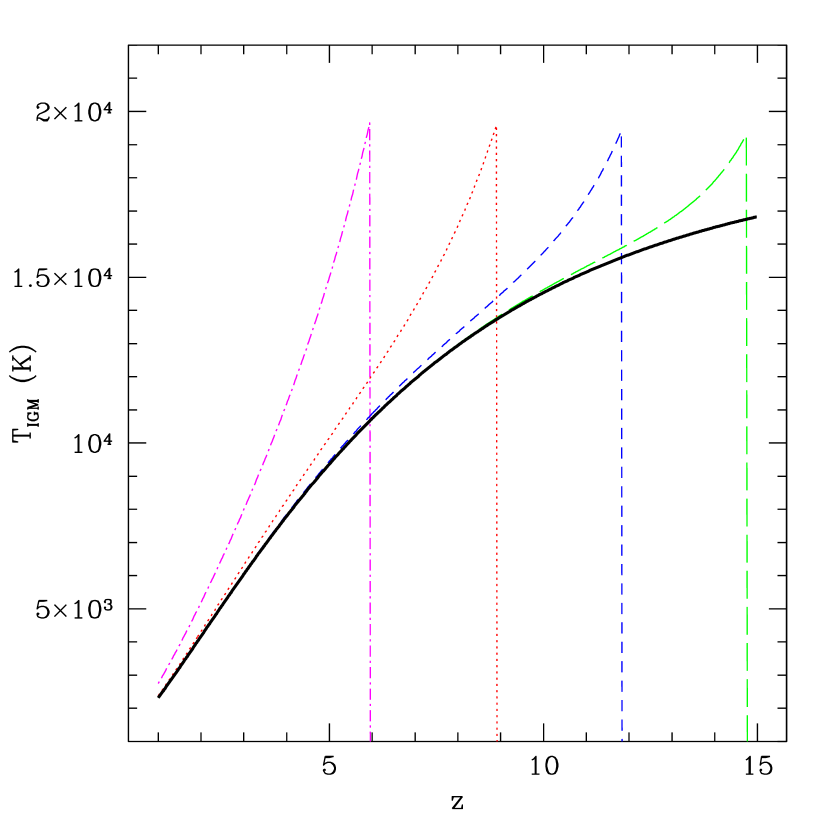
Figure 2 shows the redshift evolution of the IGM temperature for several reionization redshift: (purple, dot-dashed), (red, dotted), (blue, dashed), (green, long dashed) and the universal evolutionary track (black, solid). When reionization occurred early, the IGM temperature quickly approached a common evolutionary track; this effect is evident in Figure 2. At high redshifts the timescale for photo-heating and Compton cooling is shorter than the age of the universe, so the balance between these physical processes determines the common evolutionary track. If reionization occurred early enough, the IGM temperature will not be sensitive to fluctuation around .
Since reionization was inhomogeneous, there is a probability distribution of possible IGM temperatures for any region of scale in the universe. The actual IGM temperature of a region regulates the formation of galaxies in it. First, the gravitational force of the galaxy halo must be able to overcome the baryon pressure resisting collapse. These considerations determine the Jeans mass, namely the minimum halo mass into which the IGM gas may assemble. Second, the gas that collapses into a galaxy must be able to cool and dissipate in order to fragment and form stars, and so the cooling time of the gas must be shorter than the dynamical time of the halo. In the absence of molecules, this implies that the virial temperature of the host galaxy must be greater than K, so that atomic line cooling will be efficient.
The naive Jeans mass overestimates the effects of baryon pressure since the matter distribution cannot instantaneously adjust to a new thermal and hydrodynamical state of the gas (Gnedin & Hui, 1998). The adjustment process occurs on the dynamical timescale of the halo. Incorporating the associated delay results in a new effective scale, the filtering scale, which replaces the Jeans scale and can be written in -space as
| (5) |
where is the scale factor and is the growth factor of linear density perturbations. The baryonic power spectrum, , which is strongly influenced by gas dynamics on small scales is then related to the dark matter power spectrum through (Gnedin & Hui, 1998; Gnedin, 2000b)
| (6) |
The thermal state of the IGM impacts structure formation through the suppression of small scale baryonic power and the corresponding increase in the minimum galaxy mass. Prior to reionization the minimum mass was set by the cooling time requirement. In reionized regions of the universe the minimum mass is now set by the filter mass. Figure 3 shows the Jeans mass (solid, black) and the filtering mass (red, dotted) at for several values of .
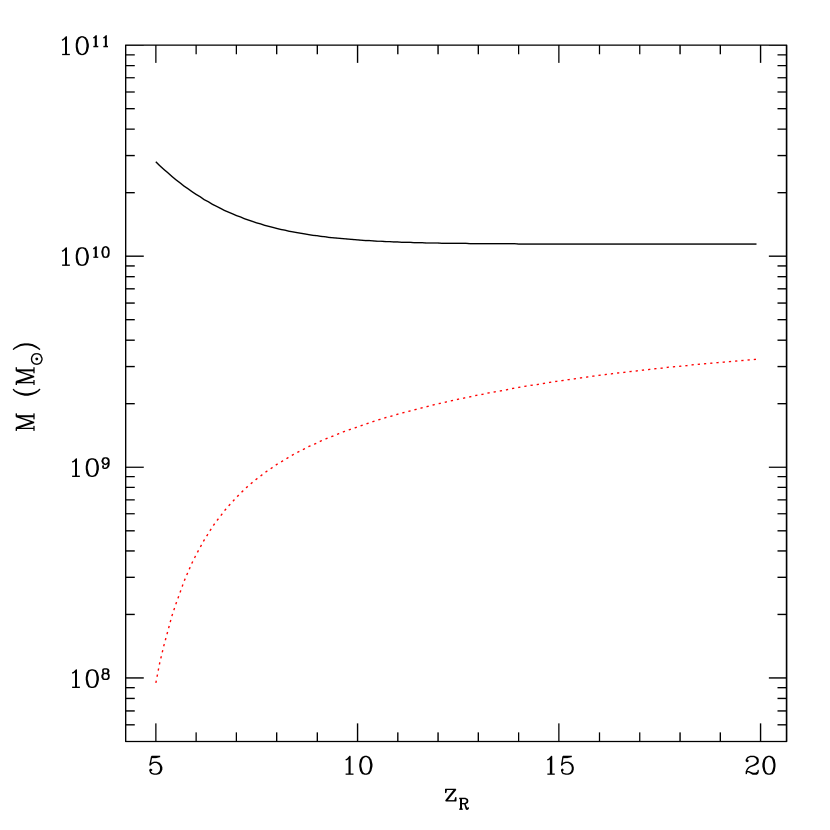
The Jeans mass initially decreases as the redshift of reionization increases. The wavenumber corresponding to the Jeans length,
| (7) |
increases for a fixed as the IGM temperature decreases due to adiabatic cooling for small . For large the IGM temperature approaches a universal temperature track and Jeans mass becomes a constant because the IGM temperature for a fixed is independent of . The behavior of the filtering mass is more complicated since the impact of the increased IGM temperature on the halo mass distribution is delayed. When is close to the filtering mass can be significantly smaller than the Jeans mass because of the afforementioned delay. This effect can be seen in Figure 3 for small . Eventually the altered IGM temperature is capable of affecting the halo mass distribution and the filtering mass rises with increasing . Since the gas temperature approaches a universal evolutionary track, the filtering mass curve becomes shallow at high . However, the filtering scale depends on the thermal history and an earlier reionization implies that the IGM had a high temperature ( K) for a longer time. This causes the filtering mass to monotonically increase with increasing .
Because the temperature of the IGM is inhomogeneous, its effect on galaxy formation is scale dependent and so it alters the shape of the power spectrum for the distribution of galaxies. We calculate this effect through Monte-Carlo simulations of the process. The fluctuations in the galaxy number density are defined as,
| (8) |
where is the universal average galaxy number density, ignoring both fluctuations in the redshift of reionization and modulation of the galaxy formation process due to the large scale density modes.
Using the Press-Schetcher (Press & Schechter, 1974) model we calculate the mass function of galaxies, the cosmic mean of the number density of galaxies between mass and formed at redshift ,
| (9) |
Then the mean number density of galaxies in the universe is
| (10) |
where is the halo minimum mass corresponding to the filter scale, defined in equation (5).
The ability of a halo to collapse and make a galaxy is altered by the overdensity of the large-scale region in which it is embbeded. The large-scale gravitational evolution of the region modulates the galaxy formation process by making the linear barrier easier to cross (Bardeen et al., 1986). Within a region of size with mass overdensity , the modified mass function of halos can be calculated using the excursion set formalism, also known as extended Press-Schetcher theory (Bond et al., 1991; Sheth & Lemson, 1999)
| ; | (11) | ||||
here is the Lagrangian volume of the region and is its linearly evolved Eulerian volume. Non-linear evolution of the Eulerian volume will cause the galaxy number density to dramatically increase on small scales (). We chose to ignore these non-linear evolutionary effects in order to clearly display the effect of fluctuations in the minimum halo mass, which is the focus of this paper.
The number density of galaxies formed in this region is obtained by integrating equation (11) with the lower mass limit set by the region’s specific mimimum mass,
| (12) |
The distribution function of the galaxy overdensity, defined in equation (8), can be calculated through the following Monte Carlo procedure.
-
1.
Randomly generate the local mass overdensity () by sampling the probability distribution function as a Gaussian with zero mean and with variance given by as defined in equation (2). If then proceed, otherwise resample the PDF.
-
2.
Calculate the fluctuation in the reionization redshift () using equation (4). If (the region is a void), then set , since neighboring overdense regions are expected to photo-ionize the voids.
-
3.
Assuming the region reionized a redshift and photo-heated to a temperature of K, calculate the IGM temperature in the region at the redshift of interest , after taking account of adiabatic cooling due to Hubble expansion, Compton cooling off the CMB and photo-heating due to the balance between recombinations and photo-ionizations of the fully-reionized hydrogen. Then calculate the filtering length and the corresponding minimum galaxy mass, , in the region.
-
4.
Use the extended Press-Schetcher formalism in equation (11), to estimate the number density of galaxies with masses above in the region. Identify the variance of this galaxy number density divided by the square of the mean as .
-
5.
Repeat for other region sizes .
The with statistical moments evaluated according to standard definitions (see Appendix A). The variance of the distribution can be related to a galaxy power spectrum,
| (13) |
which can be compared to the standard dark matter power spectrum in order to quantify the effects of the IGM temperature fluctuations.
3. Results
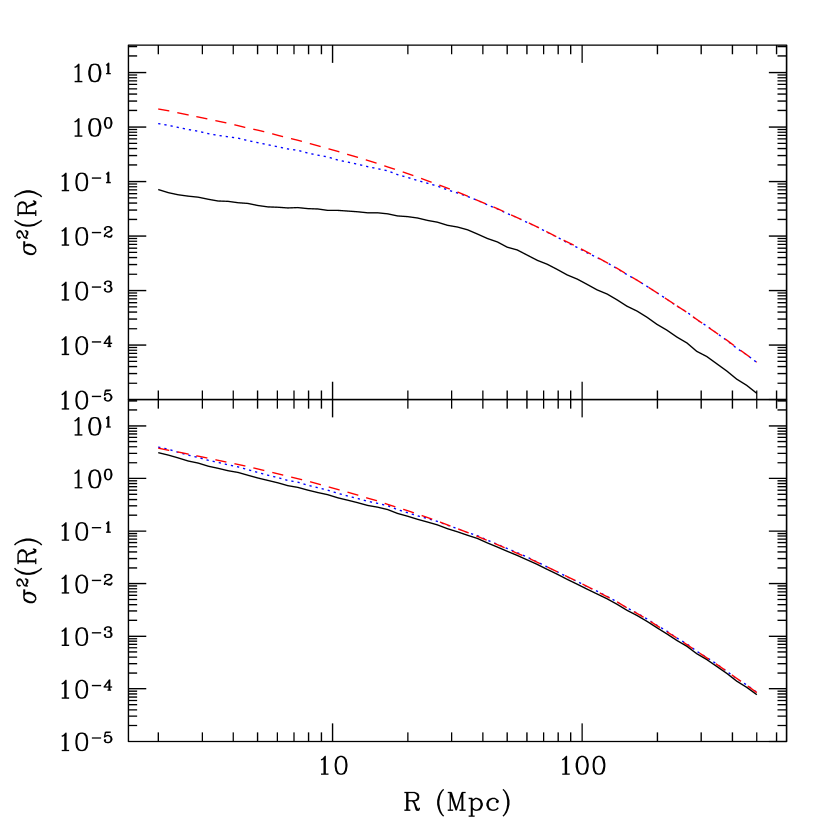
Based on the formalism described in the previous section we calculated the variance and skewness of the galaxy number overdensity. Figure 4 shows the mass variance in equation (13) of galaxies formed at for reionization redshifts of (top panel) and for (bottom panel). The solid black curves are the Monte-Carlo simulated mass variances including the effects of inhomogeneous reionization, while the red dashed curves are the linear dark matter mass variances produced by CMBFAST444http://www.cmbfast.org/ and adjusted for linear bias. The bias parameter is averaged over the mean mass function in equation (9),
| (14) |
where the Eulerian linear bias is given by (Mo & White, 1996)
| (15) |
for large mass halos this formula is accurate (Sheth et al., 2001). The linear bias is calculated by expanding the extended Press-Schetcher mass function, equation (11), to first order in . The mass averaged bias, equation (14), can be altered to account for the fluctuations in the minimum halo mass due to the local mass overdensity. The minimum halo mass can be linearized as
| (16) |
where , is the average minimum halo mass, then the mass averaged linear bias will have the extra term
| (17) | |||||
For the fluctuations in the minimum mass will be anti-correlated with the standard Lagrangian biasing effect since the minimum halo mass curve has a positive slope (see Fig. 3). Physically this means that an overdense region which reionized earlier than average, will have a larger minimum halo mass because the halo mass distribution has had a longer amount of time to reflect the photo-heated IGM gas pressure. If the effects of the fluctuation in the minimum halo mass will be weakly anti-correlated with the Eulerian linear bias. In the case of early reionization the IGM temperature approaches a universal evolutionary track. This makes the minimum halo mass curve shallow and reduces the effect of inhomogeneous reionization. This feature is visible in Figure 4; the mass variance is more suppressed than the mass variance on large scales where the linear bias is most applicable. The mass variance is suppressed by approximately on large scales, while the mass variance is suppressed by just less than a factor of 3. Additionally, the mass variance drastically changes its shape near Mpc. On this scale the fluctuations in the redshift of reionization begin to be substantial (see Fig. 1). These effects would become more prominent, especially in the case, if we decided to consider , since the slope of the curve would become steeper. Likewise the effects would be more modest if we chose . In Figure 4 we include the output of the Monte-Carlo code ignoring the effect of the scale dependent fluctuations in the minimum halo mass (blue, dotted curve). This comparison demonstrates that differences between the Monte-Carlo code curves and the biased dark matter mass variance are not dominated by numerical effects.
The effects of radiative feedback on galaxy formation were assumed to be restricted to the small scales on which individual galaxies could impact the evolution of their neighbors. We have found that the radiative feedback produced by the process of reionization changes even the large scale ( Mpc) amplitude of the galaxy mass variance (see Fig. 4). The ionizing sources are highly clustered (Furlanetto et al., 2004b; Wyithe & Loeb, 2005b), so the H II regions during reionization are much larger than the volume that an individual galaxy could ionize. It is the large bias of the ionizing sources which allows the radiative feedback effects to influence the large scale galaxy power spectrum.
The proposed Cosmic Inflation Probe (CIP) satellite (Melnick et al., 2005) aims to measure the galaxy power spectrum down to in order to constrain inflationary parameters. Currently the best constraints on and come from a joint analysis of WMAP data and SDSS Ly forest data (Seljak et al., 2005); the best single parameter confidence level constraints are and . Once the covariance between and is included, the constraints considerably worsen (see Figure 3 in Seljak et al., 2005). The prospective constraints from CIP are much finer, (Melnick et al., 2005).
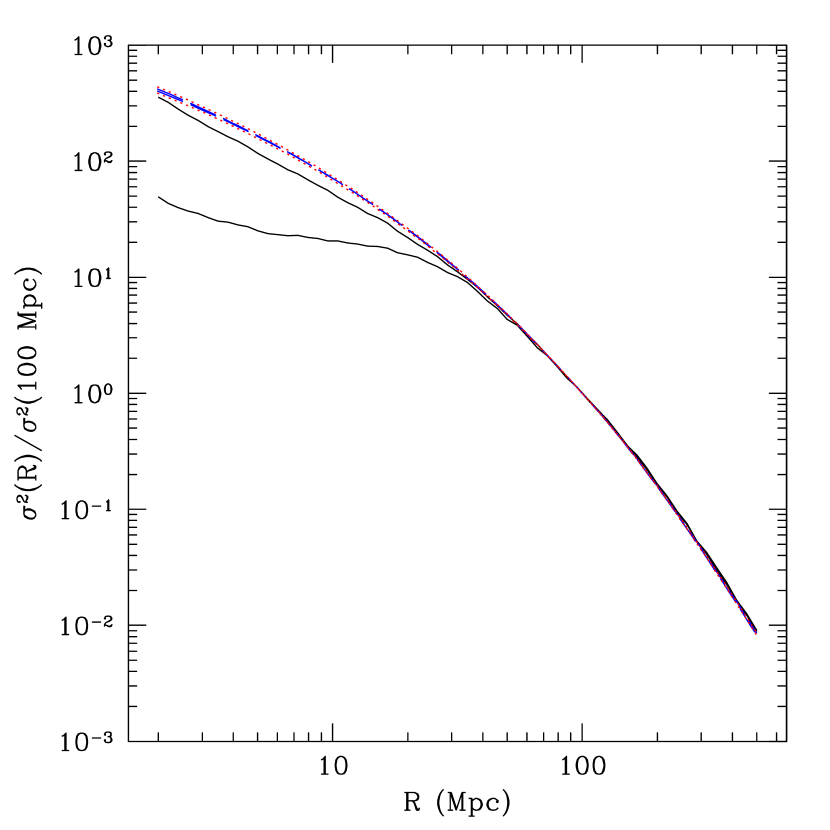
In Figure 5 we show , normalized to at , for and (solid, black curves) and the two limiting cases of the best constraints from Seljak et al. (2005); , (dotted, red curves) and , (dashed, blue curves). The effects of inhomogeneous reionization clearly dwarf the slight changes caused by varying the inflationary parameters. Therefore any program which seeks to constrain cosmological information from high redshift galaxy surveys must include the impact of inhomogeneous reionization on the shape of the galaxy power spectrum.
The imprint of reionization on the high redshift galaxy power spectrum is strong because we assumed that galaxies which reside in halos will be observed. If the survey flux limit corresponded to a much larger halo mass, the imprint of inhomogeneous reionization on the galaxy power spectrum would have been reduced555The target minimum halo mass for CIP is (Komatsu, 2005).. However, galaxies which are only a few times more massive than are still assembled through mergers of lower mass galaxies and their luminosity should be significantly affected by a depletion in the star formation rate of their building blocks of mass . Additionally, supernova feedback may deplete the progenitors of their baryonic gas, and then the inhibited gas accretion may significantly prevent any subsequent star formation in these halos (e.g. Dekel & Silk 1986). Since the effect of reionization could be larger by orders of magnitude than the allowed range of variations due to uncertain inflationary parameters, it may not be practical to confine a search to sufficiently massive halos where the inflationary variations dominate. The exact effect that photo-heating of the IGM will have on halos with masses above is difficult to estimate analytically. The analysis which leads to the filtering mass or similarly the Jeans mass, is based on linear theory. Although CIP’s minimum halo mass is significantly above the minimum halo mass predicted by the filtering scale, the inhomogeneous effects of reionization are substantially larger (see Fig. 5) than the effect of the tilt and running of the primordial power spectrum that CIP is designed to measure. It is possible that inhomogeneous reionization may bias CIP’s measurement of the linear galaxy power spectrum and the inflationary parameters. A comprehensive calculation of our effect requires a full hydrodynamical simulation of galaxy formation in a box large enough to account for the biasing by large scale density perturbations which cause inhomogeneous reionization (see Barkana & Loeb, 2004, for an overview of the effects of box size on simulations of reionization). The inclusion of a homogeneous UV ionizing background in simulations or semi-analytic models of galaxy formation will not lead to the proper bias nor will it include the crucial effect of inhomogeneous reionization which alters the shape of the galaxy power spectrum.
The distortion of the galaxy power spectrum may be used as a new probe of inhomogeneous reionization. Even if a wide field survey like CIP might not have the sensitivity to observe galaxies in halos as small as , the James Webb Space Telescope (JWST)666http://www.jwst.nasa.gov/ with nJ sensitivity most certainly will. A deep exposure (similar in concept but deeper than the Hubble Deep Field) of a field with dimensions of will observe galaxies between and . The large density of galaxies (assuming source confusion is not a significant problem when galaxies are sliced in redshift) should eliminate the Poisson sampling errors which typically prevent high redshift galaxy counts from placing strong constraints on cosmological parameters.
4. Discussion
The process of reionization is intrinsically inhomogeneous due to the modulation introduced by large scale structure on the formation of ionizing sources. Regions which are overdense form structure earlier than average and correspondingly reionize earlier than average. As the regions are photo-ionized they get photo-heated to a characteristic temperature of K, and subsequently cool. Regions that reionized earlier than average experienced suppressed galaxy formation for a longer amount of time. Consequently, the minimum mass of dark matter halos that can accomdate star formation, , is higher in such regions. This feedback of reionization on the minimum halo mass alters the galaxy power spectrum. Figure 5 summarizes the effects of inhomogeneous reionization on the distribution of galaxies at high redshifts.
The filtering scale differs from the Jeans scale since it involves an average over the thermal history. Immediately following the photo-heating of the IGM, the filtering scale lags behind the Jeans scale. The delay is displayed in Figure 3, where the filtering mass rises initially rapidly and later more gradually as the redshift of reionization increases, while the Jeans mass declines at first and then approaches a constant. If reionization occurred at , the overdense regions which reionize earlier would have a larger than average, reducing the number density of galaxies. This is anti-correlated with the well-known biasing effect of large scale density modes which produces more galaxies in overdense regions. If reionization occured at , the marginal increase in the minimum mass for overdense regions is more modest since the photo-heated IGM quickly approached a universal evolutionary track
The new effect we calculated is scale dependent, since the fluctuations in the redshift of reionization are larger on small scales (see Fig. 1). This consequently implies that the proper interpretation of the high redshift galaxy power spectrum will require a detailed understanding of reionization. Without adequate knowledge of the IGM temperature history, it may not be possible to constrain the inflationary parameters (through the spectral index and the running of the spectral index of scalar perturbations) to a high precision. Conversely, the shape of the galaxy power spectrum at high redshifts contains crucial information about the scale dependence of the thermal history of the IGM during and after the epoch of reionization. Previous attempts to measure the IGM temperature through its imprint on the small scale power spectrum of the Ly forest (see Zaldarriaga, 2002, and references within) are not easy to implement (Lai et al., 2005). Since the process of galaxy formation is inherently non-linear, the IGM temperature flucuations are amplified and become easier to detect. A deep exposure by JWST or a wide field galaxy survey like CIP may prove to be effective new probes of the epoch of reionization.
Appendix A Moments Estimators
In this work we Monte-Carlo several different physical quantities (mass overdensity, reionization redshift fluctuation, filtering length and galaxy overdensity) in order to determine the quantities’ probability distribution function (PDF). The PDFs can be completed described by the infinite set of their statistical moments. In this work we will only measure the lowest three moments. The first moment, the mean, is defined as
| (A1) |
the variance is defined as
| (A2) |
References
- Barkana & Loeb (2004) Barkana, R., & Loeb, A. 2004, ApJ, 609, 474
- Barkana & Loeb (2001) ——————. 2001, Phys. Rep., 349, 125
- Barkana & Loeb (2000) ——————. 2000, ApJ, 539, 20
- Bardeen et al. (1986) Bardeen, J. M., Bond, J. R., Kaiser, N., & Szalay, A. S. 1986, ApJ, 304, 15
- Bond et al. (1991) Bond, J. R., Cole, S., Efstathiou, G., & Kaiser, N. 1991, ApJ, 379, 440
- Dekel & Silk (1986) Dekel, A., & Silk, J. 1986, ApJ, 303, 39
- Dijkstra et al. (2004) Dijkstra, M., Haiman, Z., Rees, M. J., & Weinberg, D. H. 2004, ApJ, 601, 666
- Efstathiou (1992) Efstathiou, G. 1992, MNRAS, 256, 43P
- Furlanetto & Loeb (2005) Furlanetto, S. R. & Loeb, A. 2005, ApJin press [astro-ph/0409656]
- Furlanetto et al. (2004a) Furlanetto, S. R., Zaldarriaga, M. & Hernquist, L. 2004, ApJ, 613, 16
- Furlanetto et al. (2004b) ——————. 2004, ApJ, 613, 1
- Gardner et al. (2003) Gardner, J. P., et al. 2003, ApJ, 587, 1
- Gnedin (2000a) Gnedin, N. Y. 2000, ApJ, 542, 535
- Gnedin (2000b) ——————. 2000, ApJ, 535, 530
- Gnedin & Hui (1998) Gnedin, N. Y., & Hui, L. 1998, MNRAS, 296, 44
- Gunn & Gott (1972) Gunn, J. E. & Gott, J. R. II 1972, ApJ, 176, 1
- Haiman et al. (1996) Haiman, Z., Thoul, A. A., & Loeb, A. 1996, ApJ, 464, 523
- Haiman et al. (1997) Haiman, Z., Rees, M. J., & Loeb, A. 1997, ApJ, 476, 458; erratum 484, 985
- Hui & Gnedin (1997) Hui, L., & Gnedin, N. Y. 1997, MNRAS, 292, 27
- Hui & Haiman (2003) Hui, L. & Haiman, Z. 2003, ApJ, 596, 9
- Kogut et al. (2003) Kogut, A., et al. 2003, ApJS, 148, 161
- Lai et al. (2005) Lai, K., et al. 2005, in preparation.
- Loeb & Zaldarriaga (2004) Loeb, A. & Zaldarriaga, M 2004, Phys. Rev. Lett., 92, 211301
- Komatsu (2005) Komatsu, E. 2005, personal communication
- McDonald et al. (2001) McDonald, P. et al. 2001, ApJ, 562, 52
- Melnick et al. (2005) Melnick, G., et al. 2005 “Cosmic Inflation Probe (CIP): Study Report”, submitted to NASA at the completion of the Origins Probe concept studies
- Mesinger & Haiman (2004) Mesinger, A., & Haiman, Z. 2004, ApJ, 611, L69
- Mo & White (1996) Mo, H. J. & White, S. D. .M 1996, MNRAS, 282, 347
- Press & Schechter (1974) Press, W. H. & Schechter, P. 1974, ApJ, 187, 425
- Rees & Ostriker (1977) Rees, M. J. & Ostriker, J. P. 1977, MNRAS, 179, 541
- Seljak et al. (2005) Seljak, U., et al. 2005, Phys. Rev. D, 71, 103515
- Sheth & Lemson (1999) Sheth, R. K. & Lemson, G. 1999, MNRAS, 304, 767
- Sheth et al. (2001) Sheth, R. K., Mo, H. J., & Tormen, G. 2001, MNRAS, 323, 1
- Spergel et al. (2003) Spergel, D. N., et al. 2003, ApJS, 148, 175
- Theuns et al. (2002) Theuns, T., Bernardi, M., Frieman, J., Hewett, P., Schaye, J., Sheth, R. K., & Subbarao, M. 2002, ApJ, 574, L111
- White & Rees (1978) White, S. D. M. & Rees, M. 1978, MNRAS, 183, 341
- Wyithe & Loeb (2004) Wyithe, J. S. B. & Loeb, A. 2004, Nature, 432, 194
- Wyithe & Loeb (2005a) ——————. 2005, submitted to ApJ [astro-ph/0508604]
- Wyithe & Loeb (2005b) ——————. 2005, ApJ, 625, 1
- Wyithe et al. (2005) Wyithe, J. S. B., Loeb, A., & Carilli, C. 2005, ApJ, 628, 575
- Zaldarriaga (2002) Zaldarriaga, M., ApJ, 564, 153
- Zheng et al. (2004) Zheng, W., et al. 2004, ApJ, 605, 631