Constraining the Nature of the Galactic Center X-ray Source Population
Abstract
We searched for infrared counterparts to the cluster of X-ray point sources discovered by Chandra in the Galactic Center Region (GCR). While the sources could be white dwarfs, neutron stars, or black holes accreting from stellar companions, their X-ray properties are consistent with magnetic Cataclysmic Variables, or High Mass X-ray Binaries (HMXB) at low accretion-rates. A direct way to decide between these possibilities and hence between alternative formation scenarios is to measure or constrain the luminosity distribution of the companions. Using infrared (J, H, K, Br) imaging, we searched for counterparts corresponding to typical HMXB secondaries: spectral type B0V with K15 at the GCR. We found no significant excess of bright stars in Chandra error circles, indicating that HMXBs are not the dominant X-ray source population, and account for fewer than 10% of the hardest X-ray sources.
Subject headings:
Galaxy: center, X-rays: binaries1. Introduction
With the high spatial resolution of Chandra and ground-based infrared (IR) instrumentation, the Galactic Center, heavily obscured by dust, is now accessible to a wide range of astrophysical investigations. A series of Chandra observations of the GCR (10′ region around SgrA*), totaling 670 ksec, have recently been analyzed by Muno et al. (2003)(hereafter, M03), revealing 2357 point sources. The 2-8 keV X-ray luminosity ( erg s-1) and spectral index () of the majority of the sources are inconsistent with normal stars, active binaries, or young stellar objects, none of which are normally persistently luminous enough at 2.5 keV to produce the observed fluxes in the presence of the high absorption column (N). The only known sources expected to be detected given the absorption are compact objects accreting from binary companions. The luminosity range of the GCR sources covers magnetic CVs and non-Roche-lobe filling HMXBs accreting in a low mass-transfer regime, e.g. X Per, A0535+26 (Negueruela et al., 2000). Quiescent low mass X-ray binaries (LMXBs) with neutron star (NS) or black hole (BH) primaries are possible contributors but are generally too faint (BHs) or too soft (NSs). HMXBs are young objects (few My), while CVs are slow to form and long-lived. The two possibilities point to different evolutionary phases of the GCR.
If HMXBs comprise a significant fraction of the GCR sources, they must be the products of recent, massive-star formation. Frequent star-burst events in the GCR are expected on 20 My scales based upon the instability of large gas clouds orbiting within 200pc of the nucleus (Stark et al., 2004) and the presence of several young clusters of massive stars. The HMXB hypothesis was proposed and discussed in detail by Pfahl et al. (2002).
Grindlay (1985) suggested that the Galactic Bulge contains the debris of tidally-disrupted globular clusters. Were the GCR sources dominated by magnetic CVs, globular clusters would then contribute because CVs are over-produced per unit mass in globulars relative to the Galactic plane.
Morris (1993) proposed a third scenario in which compact stellar remnants form in the Galactic bulge and sink toward the center of the dense mass distribution via gravitational interactions. The presence of a super-massive black hole (BH) at the center accelerates the process, leading to a central density cusp. This scenario fits with the Muno et al. (2005) (M05) discovery of a centrally concentrated overabundance of X-ray transients, as well as the overall 1/ source distribution found by M03.
All three channels may be active now or have been in the past, so by measuring relative numbers of the various end-products, we hope to piece together the composition and history of the GCR. In this Letter we present preliminary results of our deep IR survey targeted at measuring the HMXB fraction. The occurrence of IR counterparts consistent with highly reddened massive stars and giants will constrain the relative abundance of HMXBs and CVs. This work is part of our Chandra Multi-wavelength Plane Survey (ChaMPlane: Grindlay et al. 2005) which is an effort to map the space density of all types of low-luminosity accretion sources in the Galaxy.
2. Observations
The GCR is heavily obscured with average AV25 so counterparts can only be detected with IR imaging. The stellar density is also very high so that reaching a sufficient limiting magnitude to make meaningful constraints on population models demands excellent image quality. In June 2004 we observed the inner 10′x10′ of the GCR with the PANIC imager on the 6.5m Magellan (Baade) telescope at Las Campanas, Chile. PANIC has a 2′x2′ field of view with 0.125′′ pixels. Under good seeing conditions (median FWHM 0.5′′), we obtained a mosaic of 25 pointings in J, H, Ks, and Br filters using a 5-point dither pattern with 3 exposures at each position. Sky emission was removed using off-source exposures, and the images were reduced and stacked in IRAF. Photometry was performed on the stacked images using SExtractor (Bertin & Arnouts, 1996). Astrometric and photometric calibration were performed using the 2MASS point-source catalog.
We used a version of X-ray point source catalog of M03, kindly provided by M. Muno, listing J2000 co-ordinates with net count rate, flux, and source significance determined in 3 energy bands S1 (0.3-1.2keV), S2 (1.2-2.5 keV), and H (2.5-8 keV). The intermediate S2 band provides some additional information, but for this Letter we restrict ourselves to discussion of GCR (H only) and foreground (S1) sources.
3. Experimental Design
We set out to identify all potential IR counterparts to the M03 X-ray sources and apply statistical tests to measure their numbers relative to random positional coincidence. Our scientific goals are to set stringent upper-limits on the number of counterparts and examine their photometric properties.
The availability of X-ray spectral information and multi-band IR photometry permits a clean separation of sources situated in the GCR from those in the foreground. The GCR sources are characterized by X-ray spectra completely cut off at low energies due to absorbing gas and dust. Of the sources in the M03 catalog, 80% are detected at 3 in the H band only, while any source detected in the S1 band must lie in the foreground. The spatial distributions of X-ray point sources and K-band stars follow similar radial profiles about the GCR. M03 demonstrated a surface density with 1/ dependence with angular offset from SgrA*. Similar results have been reported for stars from IR observations (e.g. Catchpole, Whitelock & Glass 1990).
There are 100 known Galactic HMXBs, of which 70% have Be star companions whose spectral types lie in the narrow range O9-B2 and peak at B0V (Negueruela, 1998). We adopt the luminosity and color of a B0V to represent “typical” HMXB values (=4, VK=0.83; Allen 2000). Note that many non-Be HMXBs are more luminous because they have super-giant companions. For the CV case, we adopt a K0V dwarf (MV=5.9,VK=1.96) at the brighter end of the normal range (Patterson, 1998). Adopting =25 and =8 kpc for the GCR, our target HMXB should have an apparent magnitude K=14.4 while the assumed CV would have K=21. We note the intermediate polar GK Per with bright sub-giant counterpart would have K19.
3.1. Photometric Completeness Curve
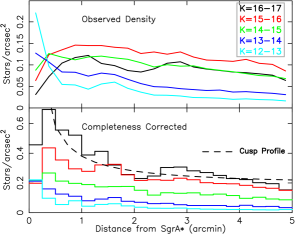
Due to severe crowding in the GCR, we infer the star density from our observations by correcting for incompleteness i.e. the loss of faint stars due to their brighter neighbors. Completeness curves for our PANIC photometry as functions of magnitude and distance from SgrA* were determined by simulation. For each of the 25 K-band stacked images, a random sample of stars was added using IRAF mkstar with a Gaussian PSF matched to the seeing. The photometry was repeated and the artificial stars identified and compared to their input magnitudes. A master catalog of input and recovered stars was then assembled, from which completeness curves could be extracted for any region of the 10′x10′ mosaic. The 50% completeness limit (fraction of stars recovered within 0.5 mag of their input magnitude) within the inner 1′ radius occurs at K=14.5 and over the rest of the mosaic at K=15.4. Curves for star density are presented in Figure 1 and completeness values for the full field reported in the final column of Table 1.
3.2. Peak-up Test
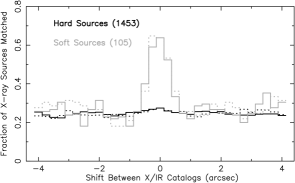
The IR and X-ray catalogs are repeatedly matched over a large grid of positional offsets using integer multiples of the PANIC pixel-size of 0.125′′. At each offset position, the number of X-ray sources with one or more stars lying in their error-circle is recorded in a series of magnitude bins. We used 95% confidence error-circles determined from the formula of Hong et al. (2005) which is dependent on net counts and distance from the Chandra aimpoint. For the GCR sources, error radii are 0.3′′-1′′. The presence of real counterparts is signaled by a peak at the offset co-ordinates corresponding to perfect alignment of the two catalogs, providing a boresight. To confirm that X-ray and IR catalogs are on the same astrometric frame we centroided the soft-source peak, finding a residual offset of RA=0.011(1)′′, Dec=0.092(1)′′ with FWHM=0.55′′.
The number of random matches () is calculated as the mean of all trials at shifts greater than 2′′, i.e. far away from correct alignment, and the standard deviation () of these values is used to characterize the uncertainty. We then take the (peak) number of matches (), and subtract the random level to obtain the excess-above-random (). We claim detection of a population of counterparts above that predicted to occur by chance if exceeds . The upper-limit on the total number of true counterparts was determined by monte-carlo simulation. At each iteration the X-ray catalog was offset by randomly generated shifts in X and Y such that the absolute shift was between 2′′ and 5′′. A randomly selected sample of X-ray sources were flagged as “true counterparts” and the catalogs matched as previously described. Since all of the X/IR matches were by definition random (due to the offsets) we were able to count the total number of matches in each magnitude bin, correcting for duplicates (sources flagged as simulated matches which also happened to have a random IR counterpart) such that = + - . Guided by the values of from the peakup test, we ran simulations with =5-40 with 100 iterations at each value. For each value of we recorded the largest value of reached in 90% of trials, and fitted the results with a straight line relationship. Thus the upper-limit on the number of true matches corresponds to the value of when = , these values are given in Table 1 as .
4. Constraints on IR/X-ray Counterparts
We performed the peak-up test first on the entire field, and then independently on a series of concentric annular regions centered on SgrA*. This allows us to limit the effects of crowding in the IR, and to follow the cusp distribution of hard X-ray sources.
For the full field we found no significant excess in the number of IR matches for hard X-ray sources, irrespective of magnitude, while for soft sources we found a highly significant (30) counterpart population dominated by bright (K11) stars. This result is illustrated visually by Figure 2 and in more detail in Table 1. There is a marginal signal () for hard sources versus the entire PANIC catalog, which could not be associated with any specific magnitude range.
| K1-K2 | Sig | C | U90 | Uc | ||||
|---|---|---|---|---|---|---|---|---|
| Hard Sources (1453) | ||||||||
| 12 | 399 | 353 | 15.8 | 46 | 2.9 | - | 87∗ | - |
| 17 | 86 | 77.9 | 8.1 | 8.1 | 1.0 | - | 20∗ | - |
| 16-17 | 72 | 57.7 | 7.2 | 14.3 | 2.0 | 0.3 | 54 | 10.7 |
| 15-16 | 84 | 83.0 | 9.3 | 1.0 | 0.1 | 0.5 | 27 | 7.3 |
| 14-15 | 83 | 67.5 | 8.3 | 15.5 | 1.9 | 0.7 | 37 | 5.4 |
| 13-14 | 37 | 35.7 | 6.1 | 1.3 | 0.2 | 0.8 | 10 | 3.0 |
| 12-13 | 30 | 22.6 | 4.5 | 7.4 | 1.6 | 0.9 | 13 | 2.3 |
| 11-12 | 11 | 8.6 | 2.4 | 2.4 | 1.0 | 1.0 | 11 | 1.4 |
| 10-11 | 6 | 5.3 | 1.9 | 0.7 | 0.4 | 1.0 | 6 | 0.6 |
| 9-10 | 2 | 2.2 | 1.3 | -0.2 | -0.2 | 1.0 | 2 | 0.2 |
| Soft Sources (105) | ||||||||
| 12 | 67 | 28.6 | 4.7 | 38.4 | 8.2 | - | 59∗ | - |
| 15-16 | 8 | 6.2 | 2.6 | 1.8 | 0.7 | 0.5 | 10 | 92 |
| 14-15 | 21 | 5.3 | 2.3 | 15.7 | 6.8 | 0.7 | 27 | 84 |
| 13-14 | 10 | 2.6 | 1.4 | 7.4 | 5.3 | 0.8 | 11 | 59 |
| 12-13 | 13 | 1.5 | 1.3 | 11.5 | 8.8 | 0.9 | 14 | 49 |
| 11-12 | 21 | 0.4 | 0.7 | 20.6 | 29.4 | 1.0 | 21 | 35 |
| 10-11 | 12 | 0.2 | 0.5 | 11.8 | 23.6 | 1.0 | 12 | 15 |
| 9-10 | 4 | 0.0 | 0.1 | 4.0 | 40 | 1.0 | 4 | 4 |
Note. — In the 10′x10′ PANIC survey area we consider: 184 K-band stars, 1453 hard X-ray sources, 105 soft X-ray sources. 2MASS point-source catalog used for K12. = Number of X-ray sources with one or more matches. = random matches, uncertainty in number of random matches. = number of "excess" matches above random level. Sig significance of excess. C Completeness fraction for K-band stars. U90= Completeness corrected upper-limit on the number of counterparts at 90% significance. Uc= Cumulative U90 brightward of K2 expressed as % of number of X-ray sources. *No completeness correction applied for unbounded mag ranges.
We therefore conclude the GCR counterpart population is dominated by stars fainter than our confusion limit, although some fraction of the hard matches are undoubtedly real. The 90% confidence upper limit for the full catalog indicates there are up to 87 hard counterparts although we cannot at this stage identify them from among the 399 total matches. By placing completeness-corrected upper-limits on the number of counterparts as a function of K magnitude, we can constrain the proportion of HMXBs, and hence place a lower-limit on the population of CVs and LMXBs. The final column of Table 1 gives the cumulative percentage obtained by adding the upper-limits for each magnitude range and dividing by the number of X-ray sources. We find that a maximum of 5.4% (at 90% confidence) of the sources could have counterparts brighter than K=15, given average GCR extinction. The presence of a significant HMXB population would appear between K=14-16, and the fact that we do detect soft-source counterparts for K=14-15 (at 6.8) demonstrates that we are not merely being defeated by crowding in this range.
For annular bins 0-1′, 1′-2′, 2′-3′, 3′-4′, 4′-5′, our results constrain the HMXB population as a function of distance from SgrA*. The effect of the nuclear cluster is apparent in the inner 1′, where a large number of massive stars raise the upper-limits such that K15 HMXB can potentially account for 9% of the 110 hard X-ray sources present (at 90% confidence). The limit is 5-8% for the remaining annuli. Overall the annular results are less constraining than the full field results due to the smaller sample sizes involved. A single annular bin (2′-3′) produced a peak at 3.8 significance, possibly corresponding to a drop in the confusion limit sufficient to allow counterparts to be isolated. Such an effect could be due to seeing, anomalous extinction or an unrelated star cluster.
We can account for 84% of the 105 soft sources down to K15, and essentially all to K16 where crowding dominates. The majority of soft sources will be dMe and other foreground coronal stars. For example at spectral type M0V our 50% completeness limit of K15.4 implies a distance of just 1kpc, indeed 86% of the S1 sources have counterparts from our optical ChaMPlane survey Zhao et al. (2003).
5. Photometry of Potential Counterparts
Color-magnitude diagrams (CMD) were constructed to compare the H–K vs K distribution for stars lying in X-ray error-circles with that of the field population. Extinction due to dust lying between us and the Galactic Center makes the GCR stars appear systematically redder than foreground stars, largely overcoming any degeneracy between intrinsic brightness and distance. In figure 3 we see the soft counterparts are mainly un-reddened stars, while the hard counterparts cluster around H–K1.6 with a large scatter. Intrinsic H–K colors do not exceed +0.3 for any stars (Allen 2000). Soft-source counterparts are also brighter than average field stars, the K-S probability that they are the same is 2.6. This result is consistent with the X-ray selection and peak-up test, the soft sources are shown to lie in the foreground, while the hard sources are dominated by random matches to stars in the GCR.
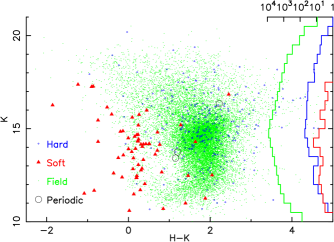
Matches were found for 3 out of the 8 periodic X-ray sources found by Muno et al. (2004) (7 in PANIC field, 5 observed in Ks, see Fig. 3). One of these (CXOGCR J174534.5-290201) is heavily reddened, while the others have slightly lower H–K values than the main concentration of stars in the CMD. The colors of the candidate stars do not agree with the predicted extinction from X-ray spectral fits of Muno et al. (2004). The X-ray derived NH of 1023cm-2 requires the stars to be extremely bright to explain the observed K magnitudes and predicts H–K colors 2 mag redder than what is observed. These observations may be reconciled if most of the X-ray-derived NH arises in the binary, in an accretion column or disk obscuring the X-ray source. A column of a few 1022cm-2 is typical for HMXB pulsars, but is insufficient to make up the difference. It is also possible that these matches are random and the real counterparts are much fainter. No match was found for the 7 bright transients detected by M05.
A preliminary search for Br emission objects among X-ray IR counterparts yielded 11 candidates with S/N5, of which 3 are foreground objects. Br–K is severely restricted by the small amplitude of the expected signal (-0.1 mag for EW(Br)10-20Å) and the effects of crowding.
6. Conclusions
The highly absorbed GCR X-ray sources appear to be dominated by a population of accreting binaries in which the mass-donor is less massive than in a typical HMXB. This conclusion follows from the lack of a significant excess of stars brighter than K15 in the error circles of hard X-ray sources, which is the apparent magnitude of a B0V star at the distance and mean Av of the GCR. By applying our peak-up test as a function of magnitude and distance from SgrA*, and correcting for completeness, we set 90% confidence upper limits on the number of hard X-ray sources that can have counterparts in a series of ranges between K=9-16. After accumulating these limits for all counterparts brighter than K=15, such stars can account for at most 79 out of 1453 hard X-ray sources, or 5.4%. Pushing one magnitude fainter to include Be HMXBs as late as B2, we find an upper-limit of 103 or 7.1%. Within 1′ of SgrA* these upper-limits become 9% and 15% due to the high density of very luminous stars in the nuclear cluster. We note that large variations in Av and/or star clustering could modify these numbers.
Our constraints imply non-HMXBs account for more than 90% of the M03 X-ray sources (at least beyond 1′) favoring the leading alternative hypothesis of magnetic CVs. High angular resolution spectroscopy will be essential to identify the true counterparts which likely exhibit B or He emission lines indicative of an accretion disk.
This work was funded in part by Chandra grant AR4-5003A and NSF grant AST-0098683. We thank the referee M. Muno for his insightful suggestions.
References
- Allen (2000) Allen’s Astrophysical Quantities, 4th edition, Cox, A., (Editor), Springer-Verlag, New York.
- Bertin & Arnouts (1996) Bertin, E., Arnouts, S., 1996, A&AS, 117, 393
- Catchpole, Whitelock & Glass (1990) Catchpole, R. M., Whitelock, P. A., & Glass, I. S., 1990, MNRAS, 247, 479
- Grindlay (1985) Grindlay, J., 1985, IAU Syp., 113, Dynamics of Star Clusters., ed. J. Goodman & P. Hut. (Dordrecht-Kluwer), 43
- Grindlay et al. (2005) Grindlay, J., et al., 2005, ApJ, in press
- Hong et al. (2005) Hong, J., et al., 2005, ApJ, in press.
- Muno et al. (2003) Muno, M. P., et al., 2003, ApJ, 589, 225
- Muno et al. (2004) Muno, M. P., et al., 2004, ApJ, 613, 1179
- Muno et al. (2005) Muno, M. P., et al., 2005, ApJ, 622, 113
- Morris (1993) Morris, M., 1993, ApJ, 408, 496
- Negueruela (1998) Negueruela, I., 1998, A&A, 338, 505
- Negueruela et al. (2000) Negueruela, I., et al. 2000, A&A, 356, 1003
- Patterson (1998) Patterson, J., 1998, PASP, 110, 1132
- Pfahl et al. (2002) Pfahl, E., Rappaport, S., Podsiadlowski, P., 2002, ApJ, 571, 37
- Stark et al. (2004) Stark, A. A., et al., 2004, ApJ, 614, 41
- Zhao et al. (2003) Zhao P., et al., 2003, BAAS., 7, 37.04