ESO-VLT and Spitzer spectroscopy of IRAS 053286827: a massive young stellar object in the Large Magellanic Cloud
Abstract
We present the first thermal-infrared spectra of an extra-galactic Young Stellar Object (YSO), IRAS 053286827 in the H ii region LHA 120-N 148 in the Large Magellanic Cloud. The observed and modelled spectral energy distribution reveals a massive YSO, M⊙, which is heavily-embedded and probably still accreting. The reduced dust content as a consequence of the lower metallicity of the LMC allows a unique view into this object, and together with a high C/O ratio may be responsible for the observed low abundance of water ice and relatively high abundances of methanol and CO2 ices.
keywords:
circumstellar matter – Stars: formation – Stars: pre-main sequence – ISM: individual objects: LHA 120-N 148 – Magellanic Clouds – infrared: stars1 Introduction
Massive stars play an important rôle in galactic evolution. They deposit chemically enriched matter, momentum and ionizing photons into the interstellar medium (ISM), and their demise as supernovae may trigger or quench star formation in their vicinity. Because of their rapid evolution it is difficult to study the formation of massive stars. Until the protostar has become hot enough to create an (ultra-compact) H ii region it remains hidden from view inside its dust cocoon (e.g., Walmsley 1995; Garay & Lizano 1999). Studying the formation of massive stars in nearby, metal-poor environments has the advantage of reduced attenuation by dust, as the dust-to-gas ratio is a function of the metal abundance. An important scientific reason for studying massive star formation at low metallicity is that it may be more representative of the early evolution of the Universe.
Surveys for extra-galactic pre-main sequence stars have so far concentrated on prominent H ii regions in the Magellanic Clouds. Optical and near-IR images reveal young stellar objects (YSOs) that have just emerged from their dust cocoon or are in the process of doing so (Rubio et al. 1998; Walborn et al. 1999; Brandner et al. 2001; Romaniello, Robberto & Panagia 2004). Embedded YSOs have been found by their dust emission at thermal-IR wavelengths or via maser emission at radio wavelengths (Whiteoak et al. 1983; Epchtein, Braz & Sèvre 1984; van Loon & Zijlstra 2001; Maercker & Burton 2005).
The mid-IR point source IRAS 053286827 is seen in the direction of the Large Magellanic Cloud (LMC), at RA and Dec (J2000). On the basis of its near-IR colours and MSX 8.28 m flux density it was selected as a target for our thermal-IR spectroscopic programme with the ESO-VLT and Spitzer Space Telescope of evolved stars in the Magellanic Clouds. Here we present evidence for it to be a massive YSO instead. We present and analyse the spectra and the spectral energy distribution, the first detailed investigation of an extra-galactic YSO.
2 Observations
2.1 Spitzer Space Telescope spectroscopy
The InfraRed Spectrograph (IRS; Houck et al. 2004) on-board the Spitzer Space Telescope (Werner et al. 2004) was used on 15 February 2005 to take a low-resolution spectrum () of IRAS 053286827 between 5.2 and m, as part of Cycle 1 programme #3505. The star was acquired on the slit after peak-up in the red (22 m) on the target itself. The spectra were taken in staring mode, placing the target on different positions on the slit to facilitate removal of sky emission. The spectral segments received a total integration of 28, 28, 60 and 420 seconds for respectively SL Order 2 (5.2–8.7 m), SL Order 1 (7.4–14.5 m), LL Order 2 (14.0–21.3 m) and LL Order 1 (19.5–38.0 m). The spectral segments were combined by making corrections for pointing-induced throughput errors, normalizing to the best centered segment. The accuracy of the overall spectral shape is a few per cent. The reduction, extraction and calibration of the spectrum followed closely the procedures described in Sloan et al. (2004).
2.2 ESO-VLT 3–4 m spectroscopy
The ISAAC instrument on the European Southern Observatory (ESO) Very Large Telescope (VLT), Chile, was used on 7 December 2003 to obtain a long-slit spectrum between 2.85 and 4.15 m. The resolving power of was set by the seeing rather than the slit width.
The thermal-IR technique of chopping and nodding was used, with a throw of and jittering by small amounts, to remove the background. The spectra were extracted using an optimal extraction algorithm. An internal Xe+Ar lamp was used for wavelength calibration The relative spectral response was calibrated by dividing by the spectrum of the B-type standard star HIP 020020. This removed most of the telluric absorption lines but introduced artificial emission features due to the photospheric lines of HIP 020020. The spectrum of IRAS 053286827 was therefore multiplied by a hot blackbody continuum with Gausian-shaped absorption lines of Br 4.052, Pf 3.741, Pf 3.297, Pf 3.039 and Pf 2.873 m scaled to match those in HIP 020020.
2.3 Photometry
photometry of IRAS 053286827 obtained at the South African Astronomical Observatory (SAAO) was published by van Loon (2000). imaging photometry was obtained by us (PRW) at Mount Stromlo and Siding Springs Observatory (MSSSO) using the ANU 2.3m telescope with CASPIR (McGregor 1994; Wood, Habing & McGregor 1998). photometry is available from the 2-Micron All-Sky Survey (2MASS; Cohen, Wheaton & Megeath 2003). Additional L′-band photometry is derived from our ISAAC spectroscopy acquisition images.
An 8.28 m flux density is taken from version 2.3 of the Mid-course Space eXperiment (MSX) Point Source Catalogue (Egan & Price 1996; Egan, Van Dyk & Price 2001). We collected scans from the IRAS data server (http://www.astro.rug.nl/IRAS-Server/) to measure 12 and 25 m flux densities, using the Groningen Image Processing SYstem (GIPSY) software with the scanaid tool.
The IRS red peak-up image provided photometry at 22 m (between 18.5 and 26 m). The individual, shifted integrations were combined to remove bad pixels, and aperture photometry was obtained assuming a calibration of 1.16 data numbers Jy-1 for a 4-pixel aperture radius.
All the available photometry is listed in Table 1. No colour corrections were applied to the photometry.
| Band | System | mag | date | |||
|---|---|---|---|---|---|---|
| J | 2MASS | 1.235 | 0.162 | 16.65 | 0.20 | 06 02 2002 |
| J | CASPIR | 1.3 | 0.12 | 16.05 | 0.10 | 27 01 2005 |
| J | CASPIR | 1.3 | 0.12 | 16.53 | 0.12 | 13 03 2005 |
| H | SAAO | 1.65 | 0.15 | 14.02 | 0.05 | 11 12 1997 |
| H | 2MASS | 1.662 | 0.251 | 14.24 | 0.06 | 06 02 2002 |
| H | CASPIR | 1.7 | 0.12 | 14.04 | 0.03 | 27 01 2005 |
| H | CASPIR | 1.7 | 0.12 | 14.21 | 0.03 | 13 03 2005 |
| Ks | 2MASS | 2.159 | 0.262 | 11.98 | 0.03 | 06 02 2002 |
| K | SAAO | 2.2 | 0.19 | 11.90 | 0.02 | 11 12 1997 |
| K | CASPIR | 2.22 | 0.2 | 11.93 | 0.02 | 19 11 1999 |
| K | CASPIR | 2.22 | 0.2 | 11.78 | 0.01 | 16 02 2000 |
| K | CASPIR | 2.22 | 0.2 | 11.72 | 0.01 | 27 01 2005 |
| K | CASPIR | 2.22 | 0.2 | 11.81 | 0.01 | 13 03 2005 |
| L | SAAO | 3.5 | 0.27 | 9.13 | 0.07 | 11 12 1997 |
| L | CASPIR | 3.59 | 0.07 | 8.89 | 0.04 | 27 01 2005 |
| L | CASPIR | 3.59 | 0.07 | 8.99 | 0.05 | 13 03 2005 |
| L′ | ESO | 3.78 | 0.29 | 8.65 | 0.10 | 07 12 2003 |
| A | MSX | 8.28 | 2.0 | 0.257 | 0.012 | |
| 12 | IRAS | 12 | 3.5 | 0.4 | 0.05 | |
| red | IRS | 22 | 3.7 | 0.83 | 0.08 | 15 02 2005 |
| 25 | IRAS | 25 | 5.6 | 1.0 | 0.15 |
3 Results
3.1 The environment of IRAS 053286827
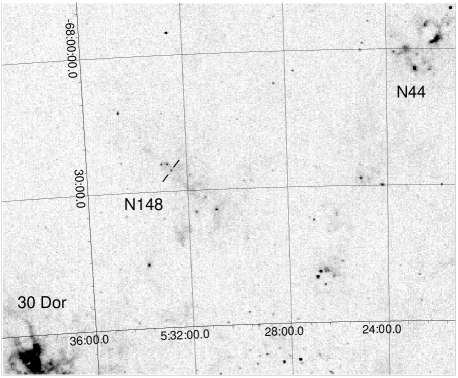
IRAS 053286827 is seen against N 148 A, the north-eastern part of the H ii region LHA 120-N 148 (Fig. 1). Compared to 30 Doradus, located almost a degree to the south-east, and the H ii region LHA 120-N 44, to the north-west, N 148 is not very bright but it does extend almost half a degree in diameter. Optical images are suggestive of the presence of a large dark cloud immediately to the north. N 148 A seems to be disjoint from the rest of N 148 (Fig. 2). There is no evidence for severe interstellar reddening of stars in the nebula.
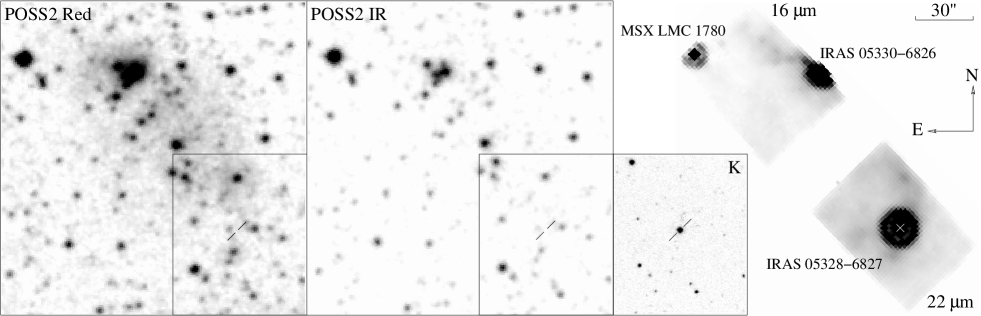
IRAS 053286827 is a bright object in the -band and in the IRS red peak-up image at 22 m (shown in Fig. 2 in vertical alignment with, and at an identical spatial scale as the optical and -band images). The blue peak-up image at 16 m (shown in Fig. 2 in its true position relative to the red peak-up image) happened to catch the two other bright mid-IR sources in this region, IRAS 053306826 and MSX LMC 1780 (both are easily visible in Fig. 1). The nature of MSX LMC 1780 is unclear, but IRAS 053306826 coincides with an anonymous cluster of stars embedded within the H nebulosity. The mid-IR emission might arise from circumstellar material of cluster pre-main sequence stars or from diffuse dust that is heated up by the young stars.
Neither 12CO1-0 (Israel et al. 1993) nor radio emission (Marx, Dickey & Mebold 1997) is detected from IRAS 053286827. The lack of radio emission (at a level of 6 mJy at 1.4 GHz or 3 mJy at 2.4 GHz) rules out the possibility that IRAS 053286827 is an ultra-compact H ii region (cf. Zijlstra 1990) unless it is optically thick at those wavelengths. Interestingly, very weak CO and radio emission at 1.4 GHz is detected from IRAS 053306826 .
3.2 Modelling the spectral energy distribution
The spectral energy distribution (SED) was reproduced with the dust radiative transfer model dusty (Ivezić, Nenkova & Elitzur 1999), as a first attempt at deriving quantitative information about this YSO. The fit is shown along with the observed SED in Fig. 3.
We placed a blackbody with an effective temperature of 30,000 K in the centre of a spherically symmetric dust cloud. For a distance to the LMC of 50 kpc the integrated SED yields a bolometric luminosity of 40,000 L⊙. This would correspond to a late-O type, 20 M⊙ zero-age main-sequence star (Hanson, Howarth & Conti 1997). Although the model does not fit the SED in perfect detail, the bolometric luminosity is recovered with about 10 per cent accuracy.
For the radial profile of the density in the dust cloud we adopted a single power law of the form . Such a flat profile is consistent with an accreting YSO (Osorio, Lizano & D’Alessio 1999) or with a flattened geometry much alike that of a disc (e.g., Whitney et al. 2003). The dust cloud extends from an inner radius of a few hundred AU, at which the dust temperature reaches 800 K, to an outer radius of about one parsec. The model fit uses oxygen-rich cold silicates (Ossenkopf, Henning & Mathis 1992) with a uniform grain size of 0.07 m, and requires an extinction of mag.
An improved fit of a spherically symmetric model to the SED cannot be achieved without invoking a two-component model, with a warm inner dust shell and a cold outer envelope. However, the geometry in massive YSOs is almost certainly not spherically symmetric. The present data are unable to constrain detailed models.

3.3 Spectral analysis: ionization, ices and dust
The 2.9–4.1 m VLT/ISAAC spectrum and 5.2–36 m Spitzer/IRS spectrum are displayed in Fig. 4. We define ad hoc continua (dotted lines) and compute the optical depths with respect to this pseudo-continuum (Fig. 5). Although this has little meaning for the dust features it facilitates computing column densities for the molecular ices.
The absence of any atomic emission lines (Fig. 4) makes it unlikely that an advanced ionized region is present. We estimate upper limits to individual hydrogen and helium emission line fluxes of W m-2, which corresponds to a luminosity of W (=1.5 L⊙) or s-1. In a Case B scenario, in which all lines except Ly are optically thin, the strongest line in the 2.9–4.1 m region is expected to be Br. The Br:Br intensity ratio is (Storey & Hummer 1995) and by scaling we obtain an upper limit of W to the Br luminosity. This is a typical value for detected Br in galactic massive YSOs but it is not unusual for it to be weaker (Ishii et al. 2001).
The heavily smoothed VLT/ISAAC spectrum (Fig. 5) shows absorption by H2O (water) ice around 3.1 m. There is also evidence for absorption by CH3OH (methanol) ice at 3.4 and 3.5 m. The 3.4 m absorption in galactic YSOs often peaks at 3.47 m, but a peak around 3.40 m as seen in IRAS 053286827 is predicted if relatively little H2O and H2CO (formaldehyde) ice is present (Schutte et al. 1996). Related features might be detected at 3.85 and 3.95 m (Dartois et al. 1999). The optical depth ratio at 3.1 and 3.47 m is with an order of magnitude smaller than observed in galactic YSOs (Brooke, Sellgren & Geballe 1999).
There is clear evidence for absorption at 15.2 m due to CO2 ice (Fig. 5); both the position and shape are identical to that seen in the galactic massive YSO W 33 A (Boogert et al. 2004). CO2 ice is expected in a low-mass embedded YSO (Bergin et al. 2005), but it is often relatively weak in massive YSOs (Watson et al. 2004) unless significant processing has occurred (Gibb et al. 2004).
The integrated optical depths (wavenumber ) of the ice features are converted into column densities by division through by the integrated absorbance values from Hudgins et al. (1993). We thus obtain H2O cm-2, and relative abundances of approximately H2O:CH3OH:CO2=2:3:1. Although these abundances come with considerable uncertainty, CH3OH seems to be more abundant than CO2 and H2O is clearly under-abundant. The galactic massive YSOs W 33 A and AFGL 7009 S also have an exceptionally high CH3OH abundance, but only marginally higher than the CO2 abundance and a few times below that of H2O (Dartois et al. 1999). IRAS 053286827 may thus present an extreme case of processing of the ice mantles on the dust grains (cf. Gibb et al. 2004).
We speculate that the low metallicity in the LMC may lead to a less tenuous dust environment surrounding YSOs, allowing interstellar photons to penetrate deeper and to be scattered around within the extended envelope. The photons can then affect the ice coatings on the grain surfaces. The lower oxygen abundance and possibly higher C/O ratio in the ISM of the LMC may also have an effect on the chemical balance in YSOs.
The observed opacity ratio of the 18 and 10 m silicate components exceeds any that could be reproduced using the optical constants available to us. This ratio is known to be high at the low temperatures encountered in the ISM and star forming regions, as compared to the warm circumstellar envelopes of evolved stars (Ossenkopf et al. 1992; Suh 1999). It goes beyond the present analysis to design a grain with matching optical properties.


4 Conclusions
We have discovered a massive Young Stellar Object, IRAS 053286827, in the LMC H ii region LHA 120-N 148. We present spectra at 2.9–4.1 m obtained with the ESO-VLT and at 5.2–36 m obtained with the Spitzer Space Telescope: the first thermal-IR spectra of an extra-galactic YSO. This opens the way to studying the early stages of massive star formation under unique environmental conditions (e.g., at low metallicity) not encountered in the Milky Way.
IRAS 053286827 is a luminous ( L⊙), massive (20 M⊙) YSO embedded in an optically thick dust cloud. Its SED is reminiscent of Class I or flat-spectrum sources, and shows absorption features of silicate dust and ices. There is no sign yet of an emerging H ii region.
At the lower metallicity in the LMC, compared to star forming regions in the Milky Way (by about a factor 4, Koornneef 1982), the lower dust content has two effects: (i) it becomes easier for the observer to detect the inner, accreting part of the cloud core, and (ii) interstellar radiation can penetrate deeper into the cloud and affect the ice mantles on the dust grains. Together with a higher carbon:oxygen ratio this might be responsible for the observed low H2O ice abundance and high CH3OH abundance.
Acknowledgments
We thank the referee for her/his very helpful suggestions. JO and MM acknowledge support from PPARC. PRW has received funding for this work from the Australian Research Council. The research presented here is based on data collected at the European Southern Observatory (72.D-0351) and Spitzer Space Telescope (GO 3505), and has made use of the 2MASS and MSX databases and of Simbad.
References
- [] Bergin E.A., Melnick G.J., Gerakines P.A., Neufeld D.A., Whittet D.C.B. 2005, ApJ 627, L33
- [] Boogert A.C.A., Pontoppidan K.M., Lahuis F., et al. 2004, ApJS 154, 359
- [] Brandner W., Grebel E.K., Barbá R.H., Walborn N.R., Moneti A. 2001, AJ 122, 858
- [] Brooke T.Y., Sellgren K., Geballe T.R. 1999, ApJ 517, 883
- [] Cohen M., Wheaton Wm.A., Megeath S.T. 2003, AJ 126, 1090
- [] Dartois E., Schutte W., Geballe T.R., Demyk K., Ehrenfreund P., d’Hendecourt L. 1999, A&A 342, L32
- [] Egan M.P., Price S.D. 1996, AJ 112, 2862
- [] Egan M.P., Van Dyk S.D., Price S.D. 2001, AJ 122, 1844
- [] Epchtein N., Braz M.A., Sèvre F. 1984, A&A 140, 67
- [] Garay G., Lizano S. 1999, PASP 111, 1049
- [] Gibb E.L., Whittet D.C.B., Boogert A.C.A., Tielens A.G.G.M. 2004, ApJS 151, 35
- [] Hanson M.M., Howarth I.D., Conti P.S. 1997, ApJ 489, 698
- [] Houck J.R., Roellig T.L., van Cleve J., et al. 2004, ApJS 154, 18
- [] Hudgins D.M., Sandford S.A., Allamandola L.J., Tielens A.G.G.M. 1993, ApJS 86, 713
- [] Ishii M., Nagata T., Sato S., Yao Y., Jiang Z., Nakaya H. 2001, AJ 121, 3191
- [] Israel F.P., Johansson L.E.B., Lequeux J., et al. 1993, A&A 276, 25
- [] Ivezić Ž., Nenkova M., Elitzur M. 1999, User manual for dusty. University of Kentucky Internal Report
- [] Koornneef J. 1982, A&A 107, 247
- [] Maercker M., Burton M.G. 2005, A&A 438, 663
- [] Marx M., Dickey J.M., Mebold U. 1997, A&AS 126, 325
- [] McGregor P.J. 1994, PASP 106, 508
- [] Osorio M., Lizano S., D’Alessio P. 1999, ApJ 525, 808
- [] Ossenkopf V., Henning Th., Mathis J.S. 1992, A&A 261, 567
- [] Romaniello M., Robberto M., Panagia N. 2004, ApJ 608, 220
- [] Rubio M., Barbá R.H., Walborn N.R., Probst R.G., García J., Roth M.R. 1998, AJ 116, 1708
- [] Schutte W.A., Gerakines P.A., Geballe T.R., van Dishoeck E.F., Greenberg J.M. 1996, A&A 309, 633
- [] Sloan G.C., Charmandaris V., Fajardo-Acosta S.B., et al. 2004, ApJ 614, L77
- [] Storey P.J., Hummer D.G. 1995, MNRAS 272, 41
- [] Suh K.-W. 1999, MNRAS 304, 389
- [] van Loon J.Th. 2000, A&A 354, 125
- [] van Loon J.Th., Zijlstra A.A. 2001, ApJ 547, L61
- [] Walborn N.R., Barbá R.H., Brandner W., Rubio M., Grebel E.K., Probst R.G. 1999, AJ 117, 225
- [] Walmsley C.M. 1995, Rev. Mex. Ast. Ap. Conf. Ser. 1, 137
- [] Watson D.M., Kemper F., Calvet N., et al. 2004, ApJS 154, 391
- [] Werner M.W., Roellig T.L., Low F.J., et al. 2004, ApJS 154, 1
- [] Whiteoak J.B., Wellington K.J., Jauncey D.L., Gardner F.F., Forster J.R., Caswell J.L., Batchelor R.A. 1983, MNRAS 205, 275
- [] Whitney B.A., Wood K., Bjorkman J.E., Wolff M.J. 2003, ApJ 591, 1049
- [] Wood P.R., Habing H.J., McGregor P.J. 1998, A&A 336, 925
- [] Zijlstra A.A. 1990, A&A 234, 387