1–7
New Keck Observations of Lithium in Very Metal-poor Stars
Abstract
Lithium abundances have been determined in more than 100 metal-poor halo stars both in the field and in clusters. From these data we find trends of Li with both temperature and metallicity and a real dispersion in Li abundances in the Spite Li plateau. We attribute this dispersion primarily to Li depletion (presumably due to extra mixing induced by stellar rotation) and to Galactic chemical evolution. We derive a primordial Li of 2.44 0.18 for A(Li)p = log N(Li/H) + 12.00. This agrees with the Li abundances predicted by the results. For stars cooler than the Li plateau we have evidence that Li depletion sets in at hotter temperatures for the higher metallicity stars than for the low-metal stars. This is the opposite sense of predictions from stellar models. The smooth transition of the Li content from the Li plateau stars to the cool stars adds weight to the inference of Li depletion in the plateau stars.
keywords:
stars: abundances, stars: atmospheres, stars: kinematics, stars: late-type, subdwarfs, globular clusters, cosmology: observations1 Introduction
Since the first publication by [Spite & Spite (1982)] about the apparent constancy of lithium (Li) in low-metallicity stars and the implication that the Li was produced in the Big Bang, there has been an avalanche of research papers on this topic. Here we present high-resolution spectroscopic observations of Li in over 100 metal-poor halo dwarf and turn-off stars made with the Keck I telescope and HIRES ([Vogt et al. 1994]). There are three inter-twined projects related to the determination of the value of primordial Li and Li depletion in old halo stars. One data set of 38 stars is focussed on the determination of Li in very low metallicity stars ([Novicki 2005]). Another is the study of Li in 55 halo dwarfs on extreme orbits which contains a large subset of stars cooler than 5700 K to examine Li depletion ([Boesgaard, Stephens & Deliyannis 2005]). The third is an investigation of Li in 16 similar turn-off stars in four globular clusters: M5, M13, M71 and M92 ([Boesgaard et al. 2000] and in preparation).
2 Observational Data
All of the observations are echelle spectra from HIRES with a spectral resolution of 45,000. The set of the “very-low-metallicity” stars have ratios of signal-to-noise per pixel (S/N) of 100 to 535, with a median of 245. For the dataset of 55 stars on “extreme orbits” the S/N ranges from 70 to 700 with a median of 140. The 16 stars in the globular clusters are all near = 18 so multi-hour exposures were needed to achieve S/N ratios of only 40 to 60 with a median of 53.
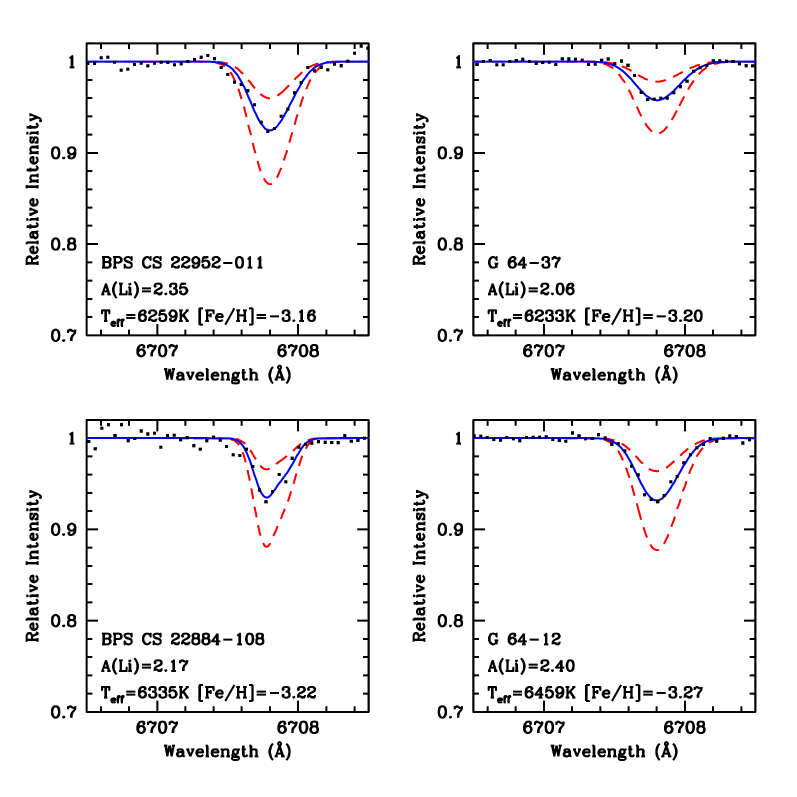
In Figure 1 we show spectrum synthesis fits for Li for some of the stars in the “very-low-metallicity” and the “extreme-orbits” data sets. The stellar parameters were determined from multiple photometric indices for the “very-low-metallicity” set (see [Novicki 2005]) and spectroscopically for the “extreme-orbits” set (see [Stephens & Boesgaard (2002)]). Model atmospheres were interpolated in the Kurucz grid ([Kurucz 1993]) for use in the synthesis which was done with MOOG ([Sneden 1973]; http://verdi.as.utexas.edu/moog.html).
3 Primordial Lithium
3.1 Trends of Li abundance with effective temperature
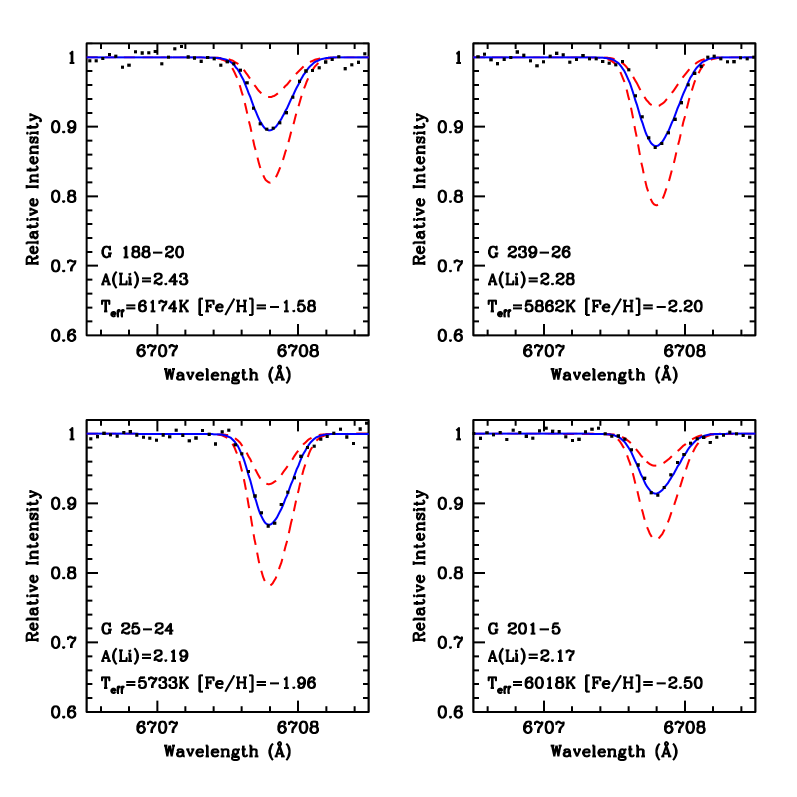
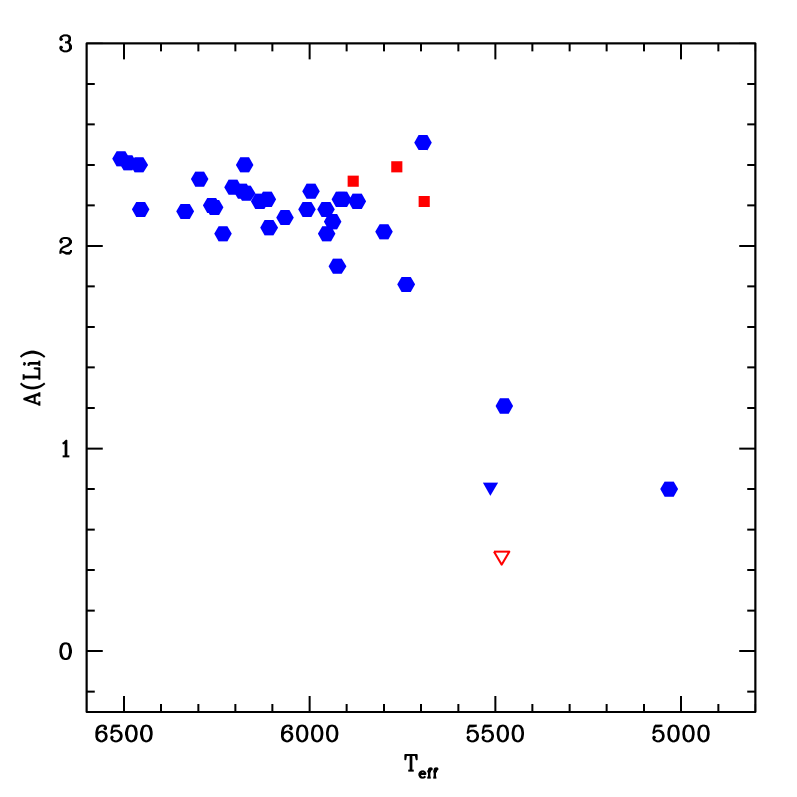
The distribution with respect to temperature of the abundance analysis for A(Li) = log N(Li/H) + 12.00 is shown for the two data sets in Figure 2. The higher metallicity and lower log g stars are indicated by different symbols from the bulk of the stars with low [Fe/H] and high gravities (i.e. halo dwarfs). In both samples there is a slight trend for more Li in stars with Teff 5700 K. The Li abundance declines more steeply with temperature for the cooler stars (Teff 5700 K). The right panel of Figure 2 shows a smooth curve from the hottest to the coolest stars, rather than an abrupt change at the cool end of the plateau. As will be discussed more in 5, the decline in Li, which sets in at about 5700 K, occurs at hotter temperatures for the more metal-rich stars; the open symbols (higher metallicity) in the right panel of Figure 2 are shifted toward higher temperatures relative to the filled symbols.
3.2 Trends of Li abundance with Fe and other elements
The sample of “extreme-orbits” stars contains 14 which are on the Li plateau. A rather complete chemical profile has been determined for those 55 stars in [Stephens & Boesgaard (2002)], including Li, Na, Mg, Ca, Ti, Si, Cr, Fe, Ni, Y and Ba. For the 14 low-metallicity ([Fe/H] 1.5) stars with Teff 5700 K we find trends of increasing Fe-peak abundances with increasing A(Li). Examples of [Fe/H] and [Cr/H] are found in Figure 3. The slopes of the relationships are both 0.18 0.04. For the -elements, [Mg/H], [Ca/H], and [Ti/H], the slopes with A(Li) are slightly steeper at 0.22 0.05, 0.20 0.04, and 0.20 0.04, respectively. The slopes are steeper presumably due to the increasing [/Fe] with decreasing [Fe/H]. The neutron-capture element, [Ba/H], also shows a trend with A(Li), but with a shallower slope of 0.13 0.03. For more details see [Boesgaard, Stephens & Deliyannis 2005].
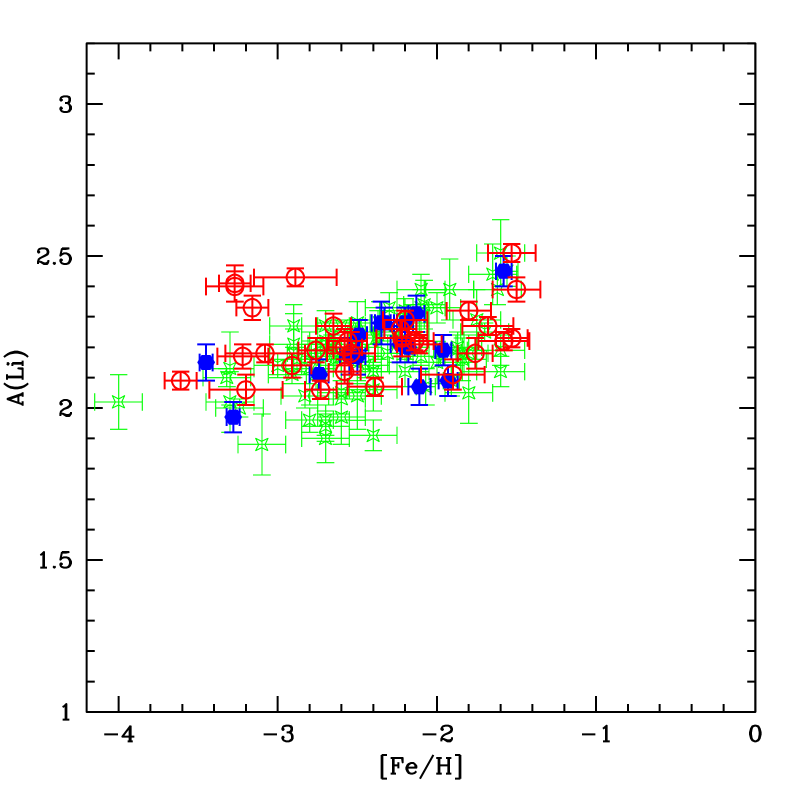
The larger sample of Li plateau stars that also includes our very-low-metallicity sample and data from the literature (scaled to match ours) shows a trend with [Fe/H]. See the left panel of Figure 4.


3.3 From observed Li to primordial Li
Our observations, coupled with those in the literature, show dependencies of A(Li) on both temperature (Figure 2) and [Fe/H] (Figure 3 and 4-left). We have done a bivariate fit to account for the trends with temperature and metallicity simultaneously for 116 stars: A(Li) = 0.1451 (0.0009) [Fe/H] + 0.0315 (0.0002) Teff/100 K.
The errors in the bivariate fit are not truly gaussian. The difference between the observed data and the prediction from the bivariate fit show some points at the high end of the distribution that are not well matched by the best-fitting gaussian. We conclude that there is intrinsic dispersion in the data and that there has been some Li depletion from mixing below the convection zone. The level of such depletion has been evaluated at 0.2-0.4 dex by [Pinsonneault et al. 2002]. We have made corrections for this depletion (+0.3 dex) and Galactic chemical evolution (0.11 dex) and other small contributors, following [Ryan et al. (2002)]. We deduce: A(Li)p = 2.44 0.18. Coc et al.(2004) have found that the predictions from the Wilkinson Microwave Anisotropy Probe () with standard Big Bang nucleosynthesis result in a value of A(Li)p = 2.62 0.05. Within the errors our result agrees with the predictions for A(Li)p from .
4 Li in Turn-off Stars in Globular Clusters
We have selected stars near the turn-off in four globular clusters which have as close to the same temperature as possible to study the Li content in these old stellar populations. Within a given cluster the stars observed have the same temperature, the same luminosity, the same mass, the same age, and the same composition. The observations are summarized in Table 1. All the turn-off stars have temperatures of 5800 - 5900 K.
| Cluster | # Stars | S/N | ||
|---|---|---|---|---|
| M 92 | 2.52 | 4 | 18.0 | 40 |
| M 13 | 1.76 | 4 | 17.9 | 60 |
| M 5 | 1.25 | 3 | 18.0 | 57 |
| M 71 | 0.80 | 5 | 17.7 | 55 |
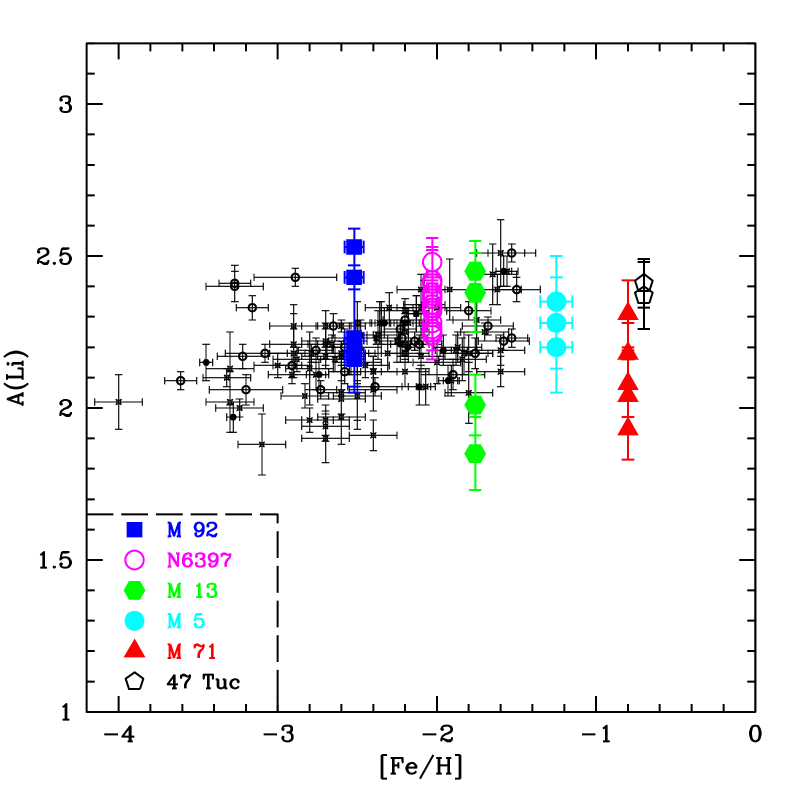
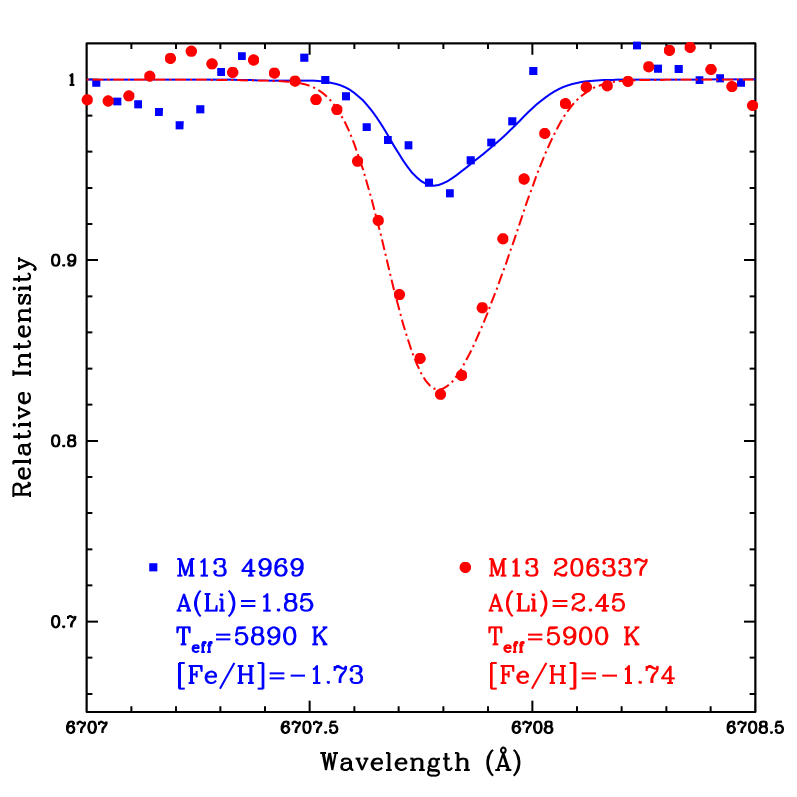
There is a range in A(Li) in these 16 stars from 1.85 to 2.53 dex, or almost a factor of 5. Observations of turn-off stars in NGC 6397 by [Bonifacio et al. (2002)] and in 47 Tuc by [Pasquini & Molaro (1997)] do not show such a large spread. The range in M13 alone is a factor of 4. We show the Li spectrum synthesis fits for two of the M13 stars in Figure 5. The Li line strengths and Li abundances in these two otherwise identical stars are clearly different. Even in M71 at [Fe/H] = 0.80, the spread is a factor of 2.5.
In Figure 4 (right) we show the Li results for the halo field stars and the globular cluster stars. It is possible that the spread revealed in the cluster stars results from depletion due to rotationally-induced mixing; the spread could be larger in the cluster stars because the range in initial angular momenta could be greater in the cluster-forming environment than in the field. All the stars have spun-down and are now slow rotators, but those that were initially rotating more rapidly would be the ones that are more Li-depleted now.
5 Li Depletion in Cool Halo Dwarfs
The right panel in Figure 2 shows some 22 stars cooler than 5800 K with log g 3.7 and with detectable Li. When we subdivide these stars into three groups with similar Fe abundances, we see three distinct, but similar, patterns of depletion. The left panel of Figure 6 show the trends of A(Li) with temperature for the three groups, and shows the least squares fits through those points (one fit for the higher metallicity stars, 2 for the two lower ones.) (One star at [5254,1.46] was excluded from the fit for the middle group; if its [Fe/H], at 1.47 0.05, were smaller by 0.11 dex, it would be part of the lowest metallicity group.) It can be seen that the decline in Li sets in at higher temperatures for the higher metallicity stars, the mid-range metallicity stars start at lower temperatures, followed by the lowest metallicity at the coolest temperatures. The right panel shows the the theoretical predictions from the Yale “standard” models ([Ryan & Deliyannis 1998]). Those predictions are in the opposite sense of the observations; they predict more Li depletion, not less, in the most metal-poor stars, and they predict a steeper decline than is observed.


6 Conclusions
We find evidence for a dispersion in the Spite Li plateau. This appears to result both from Li depletion due to rotationally-induced mixing and from a small increase in Li due to Galactic chemical evolution. Our value for primordial Li, A(Li)p, is 2.44 0.18 after taking into account various effects on the observed Li; this agrees with the predictions from the results of of 2.62 0.05. For the globular cluster turn-off stars our Li abundances show a spread at a given temperature and metallicity of up to a factor of 4. This spread could be due to different degrees of Li depletion in these stars, which possibly results from rotationally-induced mixing and a range in initial angular momentum in otherwise similar cluster stars. The original rapid rotators would have lost more Li than the slow rotators although all are rotating slowly now.
We have measured Li depletion in cool metal-poor stars and find it to be a function of metallicity at a given temperature. There is a range of a factor of 4 at 5400 K, for example. The steep decline in Li begins at higher temperatures for stars with higher values of [Fe/H] than for those with lower [Fe/H]. The theoretical predictions are in the opposite sense of the observations and predict more severe depletion.
Acknowledgements.
This work has been supported by NSF grants to AMB: AST0097945 and AST0097955.References
- [Boesgaard, Stephens & Deliyannis 2005] Boesgaard, A.M., Stephens, A. & Deliyannis, C.P. 2005, ApJ, in press
- [Boesgaard et al. 2000] Boesgaard, A.M., Stephens, A., King, J.R. & Deliyannis, C.P 2000, Proc. SPIE, 4005, 274
- [Bonifacio et al. (2002)] Bonifacio, P., Pasquini, L., Spite, F., Bragaglia, A., Carretta, E. & 14 other authors 2002, A&A, 390, 91
- [Coc et al. 2004] Coc, A., Vangioni-Flam, E., Descouvement, P., Adahchour, A. & Angulo, C. 2004, ApJ, 600, 544
- [Kurucz 1993] Kurucz, R. 1993, CD-ROM 1, Atomic Data for Opacity Calculations (Cambridge: SAO)
- [Novicki 2005] Novicki, M.C. 2005, PhD thesis, University of Hawaii.
- [Pasquini & Molaro (1997)] Pasquini, L. & Molaro, P., 1997 A&A, 322, 109
- [Pinsonneault et al. 2002] Pinsonneault, M.H., Steigman, G., Walker, T.P. & Narayanan, V.K. 2002, ApJS, 78, 179
- [Ryan & Deliyannis 1998] Ryan, S.G. & Deliyannis, C.P. 1998, ApJ, 500, 398
- [Ryan et al. (2002)] Ryan, S.G., Gregory, S.G., Kolb, U., Beers, T.C. & Kajino, T. 2002, ApJ, 571, 501
- [Sneden 1973] Sneden, C. 1973, PhD thesis, University of Texas at Austin.
- [Spergel et al. 2003] Spergel, D.N. et al., 2003 ApJS, 148, 175
- [Spite & Spite (1982)] Spite, F. & Spite, M., 1982 A&A, 141, 56
- [Stephens & Boesgaard (2002)] Stephens, A. & Boesgaard, A.M. 2002, ApJ, 123, 1647
- [Vogt et al. 1994] Vogt, S.S. et al. 1994, Proc. SPIE, 2198, 362