11email: zvezda@ll.iac.es 22institutetext: University of Central Florida, Dept. of Physics, P.O. Box 162385, Orlando, FL 32816-2385, USA 33institutetext: LAEFF-INTA, P.O. Box 50727, E-28080, Madrid, Spain 44institutetext: Proyecto Gran Telescopio Canarias, Instituto de Astrofísica de Canarias 55institutetext: Consejo Superior de Investigaciones Científicas, Spain 66institutetext: Centre for Astrophysics Research, University of Hertfordshire, College Lane, Hatfield, Hertfordshiere AL10 9AB, United Kingdom 77institutetext: Main Astronomical Observatory of Academy of Sciences of Ukraine, Golosiiv Woods, Kyiv-127, 03680, Ukraine 88institutetext: Institute for Astronomy, University of Hawai’i, 2680 Woodlawn Drive, Honolulu, HI 96822, USA
S Ori J053825.4024241:
A Classical T Tauri-like object at the substellar boundary
We present a spectrophotometric analysis of S Ori J053825.4024241, a candidate member close to the substellar boundary of the young (1–8 Myr), nearby (360 pc) Orionis star cluster. Our optical and near-infrared photometry and low-resolution spectroscopy indicate that S Ori J053825.4024241 is a likely cluster member with a mass estimated from evolutionary models at 0.06 M⊙, which makes the object a probable brown dwarf. The radial velocity of S Ori J053825.4024241 is similar to the cluster systemic velocity. This target, which we have classified as an M 6.01.0 low-gravity object, shows excess emission in the near-infrared and anomalously strong photometric variability for its type (from the blue to the band), suggesting the presence of a surrounding disc. The optical spectroscopic observations show a continuum excess at short wavelengths and a persistent and resolved H emission (pseudo-equivalent width of 250 Å) in addition to the presence of other forbidden and permitted emission lines, which we interpret as indicating accretion from the disc and possibly mass loss. We conclude that despite the low mass of S Ori J053825.4024241, this object exhibits some of the properties typical of active classical T Tauri stars.
Key Words.:
stars: low mass, brown dwarfs — stars: individuals (S Ori J053825.4024241) — accretion, accretion discs — stars: variables: others — open clusters and associations: individuals ( Orionis)1 Introduction
T Tauri stars are the bridge between new-born embedded protostars and zero age main sequence stars. The most widely accepted scenario proposed to explain all their features is the magnetospheric accretion of mass infalling from a surrounding circumstellar disc. Bertout, Basri & Bouvier (1988), Appenzeller & Mundt (1989) and Königl (1991) have reviewed the properties of T Tauri stars and their discs. The existence of a T Tauri-like phase in brown dwarfs, objects below the hydrogen-burning mass limit (0.072 M⊙ for solar metallicity) has been suggested in the past few years. See, for example, Muzerolle et al. (2003), Barrado y Navascués & Martín (2003), Natta et al. (2004), or the most recent papers by Mohanty, Jayawardhana & Basri (2005) and Furlan et al. (2005) and references therein.
S Ori J053825.4$-$024241 was firstly identified as a photometric substellar candidate of the young Orionis cluster (Béjar, Zapatero Osorio & Rebolo 2004). Hence, it is probably 1–8 Myr old and is located at a distance of about 360 pc (see Béjar et al. 2001 for further details on the cluster properties). S Ori J053825.4024241 exhibits considerable excess emission in the -band, whereas the colour appears to be slightly bluer than the colour of other cluster members of similar magnitude. Caballero et al. (2004) found S Ori J053825.4024241 to be one of the most photometric variable sources of its spectral type, with variations as high as 0.36 mag in the band over a few hours.
In this paper we present optical spectroscopy that confirms the membership of S Ori J053825.4024241 in Orionis at the borderline between stars and brown dwarfs. Both photometric and spectroscopic data suggest that this object is undergoing active mass accretion. The presence of circumstellar discs around low-mass stars and brown dwarfs in the Orionis cluster has been inferred by several authors (e.g., Oliveira, Jeffries & van Loon 2004 and Scholz & Eislöffel 2004). However, the particular peculiarities of S Ori J053825.4024241 deserve intensive study.
2 Observations and analysis
2.1 Optical spectroscopy
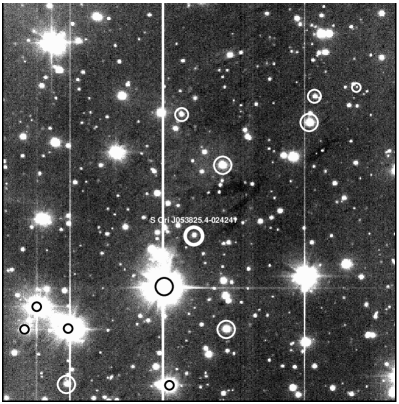
We have obtained low-resolution spectra of S Ori J053825.4024241 using the 2.56 m Nordic Optical Telescope (NOT, Observatorio del Roque los Muchachos, Spain) and the 10 m Keck I Telescope (W. M. Keck Observatory, Hawai’i). The finder chart of this object is depicted in Fig. 1, and Table 1 provides the log of the spectroscopic observations. Raw data were reduced using tasks within the iraf environment. Reduction steps included bias subtraction, flat-fielding, optimal extraction, wavelength calibration, and correction for instrumental response and telluric contribution.
| NOT | Keck | |
| Date | 2003 Dec 26 | 2004 Jan 23 |
| MJD | 52999.93 | 53027.31 |
| No. of spectra | 3 | 2 |
| Exposure time | 3 900 s | 1200 390 s |
| Telescope | NOT | Keck I |
| Instrument | alfosc | lris |
| Detector | E2V 2k 2k 42–40 | Tektronics 2k 2k |
| Grism | #5 | #4 |
| Blocking filter | GG475 | GG495 |
| coverage | 5300–9600 Å | 5600–8100 Å |
| Pixel size | 0.19 arcsec | 0.213 arcsec |
| Slit width | 1.3 arcsec | 1.0 arcsec |
| Dispersion | 3.1 Å pixel-1 | 1.25 Å pixel-1 |
| Resolution | 12 Å | 4.5 Å |
| Name | a | pEW (H) | PC1 | PC2 | PC3 | PC4 | Spectral type |
|---|---|---|---|---|---|---|---|
| (mag) | (Å) | ||||||
| S Ori J053825.4024241 | 16.86 0.06 | 230 70 | 1.2 0.6 | 1.85 0.17 | 1.36 0.13 | 1.7 0.3 | M6.0 1.0 |
| S Ori J053954.3023719 | 17.03 0.04 | 5 1 | 1.8 0.2 | 2.0 0.2 | 1.34 0.18 | 1.64 0.12 | M6.0 1.0 |
| S Ori J053838.6024157 | 16.52 0.07 | 6 1 | 1.39 0.14 | 1.75 0.18 | 1.3 0.3 | 1.6 0.2 | M5.5 1.0 |
| S Ori J053826.1024041 | 16.87 0.06 | [2,+2]b | 1.4 0.4 | 2.2 0.5 | 1.19 0.18 | 1.5 0.3 | M5.0 2.0c |
-
a
From Béjar et al. (2004).
-
b
pEW(H) = 4 2 Å (from Barrado y Navascués et al. 2003).
-
c
M6.0 spectral type matches better to the spectroscopic cluster sequence. It is an M8-type binary dwarf according to Barrado y Navascués et al. (2003).
We used the Andalucía Faint Object Spectrograph and Camera (alfosc) instrument attached to the Cassegrain focus of the NOT to obtain a spectrum of S Ori J053825.4024241 (R 600). See Table 1 for details on the observations and the instrumental configuration. We note the strong fringing redwards of 7600 Å, and the low number of photons bluewards of 6000 Å. Observations were hampered by poor weather conditions (cirrus and high relative humidity).
We also obtained spectra of three additional Orionis candidate members of similar brightness on the same night ( 17 mag, namely S Ori J053954.3$-$023719, S Ori J053838.6$-$024157 and S Ori J053826.1$-$024041). These were found in the photometric searches of Béjar et al. (2004) and Caballero et al. (2004). These authors reported on the short-scale variable nature of S Ori J053826.1024041. Barrado y Navascués et al. (2003) classified S Ori J053826.1024041 as an M8-dwarf member of the cluster. Exposure times were 3 900 s for S Ori J053825.4024241, and 1000 s for each of the other three objects. Figure 2 shows the NOT spectra, which were corrected for telluric lines by observing featureless stars.
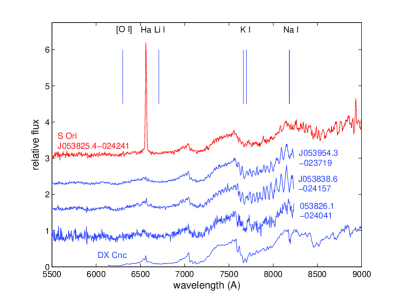
Spectral types were derived by measuring the pseudocontinuum indices (PC) of Martín, Rebolo & Zapatero Osorio (1996) and by direct comparison to well-known late-type spectroscopic standard stars. We provide our measurements in Table 2. We note that the PC1 index is affected by the broad H emission of S Ori J053825.4024241, and that the PC4 index suffers from the strong fringing of our data. PC2 and PC3 remain, however, as reliable indicators of the spectral type. In case of strong veiling due to a blue continuum excess, the PC indices may provide spectral types that are slightly earlier than the real ones. The polynomial fitting to the PC index–spectral type relations given in Martín et al. (1996) yields spectral types between M5 and M6 for the four objects in our work. In particular, we have determined that the spectral type of S Ori J053825.4024241, the main target of our paper, is M6 with an uncertainty of one subtype.
As seen from Fig. 2, the most prominent spectral feature of S Ori J053825.4024241 is H, which is seen in strong emission. We measured a pseudoequivalent width (pEW, equivalent width with respect to the observed continuum) of 23070 Å on the NOT spectrum, which makes S Ori J053825.4024241 one of the largest H emitters among Orionis late-type members. The other three objects do not display such intense H lines (see Table 2). The forbidden line of [O i] 6300.3 is also detected in emission with a moderate strength in the NOT spectrum of S Ori J053825.4024241. Regarding absorption features, all Orionis objects show rather weak K i 7664.9,7699.0 and Na i 8183.3,8148.8 lines as compared to field dwarfs of similar types (see Fig. 2). Although the doublets are blended at the low resolution of the NOT data, they should appear with pEWs of 20 Å and 6 Å in M6 V-type spectra, respectively. However, we can only impose upper limits that are significantly smaller. This is indicative of low-gravity atmospheres (Martín et al. 1996; Luhman et al. 1997) or of the presence of a strong continuum excess, both supporting the young age of the objects and their membership of the Orionis cluster. We note that our pEWs of the Na i 8183.3,8148.8 doublet are in agreement with the measurements of Kenyon et al. (2005) obtained for various M5–6-type Orionis members. Another excellent indicator of youth is the presence of Li i 6707.8 absorption. The low resolution and moderate signal-to-noise ratio of the NOT spectra do not allow a clear detection of this feature. Table 3 provides our measurements of S Ori J053825.4024241.
| Line | pEW (Å) |
|---|---|
| O i 6300.3 | 2.5 1.0 |
| H 6562.8 | 230 70 |
| Li i 6707.8 | 0.7 |
| K i 7664.9a | 2.0 |
| K i 7699.0a | 2.0 |
| Na i 8183.3a | 2.0 |
| Na i 8184.8a | 2.0 |
-
a
Line measurements affected by fringing.
To check the stability of the H emission of S Ori J053825.4024241, we collected two optical spectra with a higher resolution (1700) of 1200 s and 390 s about one month later than the NOT data (see Table 1). The Low Resolution Imaging Spectrograph (lris) was used at the Keck I Telescope. The Keck spectra were wavelength-calibrated using emission sky lines (Osterbrock et al. 1996), which were observed along with the target. The root-mean-square of the polynomial fit to the calibration is typically 0.28 Å. The data were not corrected for instrumental response or terrestrial contribution because no flux standard star was observed owing to very poor weather conditions. Of the two spectra, the first exposure shows better signal-to-noise ratio. This spectrum is depicted in Figure 3. The second spectrum is of very poor quality. However, H is clearly detected in strong emission, as it is in the first spectrum. The Keck data confirm the persistent emission of S Ori J053825.4024241. The profile of the observed H emission is shown in Figure 4. We have plotted relative fluxes as a function of the velocity shift from line center and scaled to the peak H flux of the object. H appears rather symmetric and broad. It is resolved as compared to telluric emission lines at similar wavelengths.
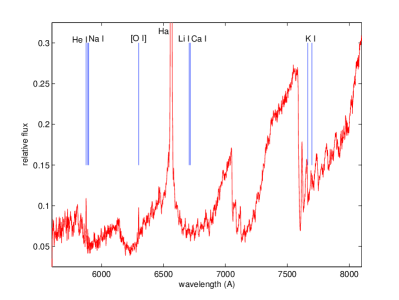
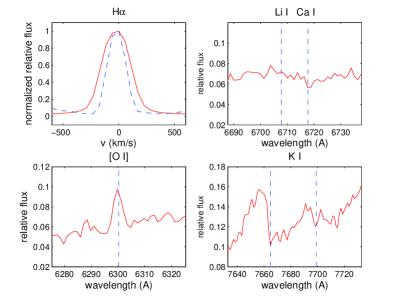
Besides H, we have also detected emission from He i (D3) 5875.8 and [O i] 6300.3 (Fig. 4). No significant variations are seen between the two consecutive Keck spectra. Pseudo-equivalent widths measured from the best-quality Keck spectrum are given in Table 4. As inferred from the strength of the emission lines (Tables 3 and 4), the activity level of S Ori J053825.4024241 remains approximately constant between the two epochs of observation. We also provide in Table 4 the pEWs of several Na i, K i, Li i and Ca i lines. Note that the K i doublet is severely affected by telluric absorption. We remark that only upper limits can be set for Li i 6707.8 (Fig. 3) and the Na i 5890.0,5895.9 doublet. The Na i and K i lines (Fig. 3) are detected much weaker than expected for high-gravity dwarfs of similar spectral type.
The heliocentric radial velocity of S Ori J053825.4024241 was computed via Fourier cross-correlation of the object best Keck spectrum with the field standard star V1298 Aql (vB 10, M8 V, = 35.3 1.5 km s-1, Tinney & Reid 1998). This template star was also observed with the Keck Telescope and similar instrumentation on a previous run. We took special care in cross-correlating spectral windows (6620–6840 Å, and 7000–7260 Å) that are not affected by telluric absorptions and that contain many photospheric lines (particularly TiO). Additionally, we considered parts of the spectrum free of emission lines. We derived = +32 13 km s-1 for S Ori J053825.4024241, which is in full agreement within the error bars with the mean heliocentric radial velocity of Orionis members (Walter et al. 1998; Zapatero Osorio et al. 2002a). Velocities were also computed for each emission line of the spectrum by measuring line centroids. Observed velocities were corrected for the rotation of the Earth, the motion of the Earth about the Earth–Moon barycentre, and the orbit of the barycentre about the Sun to yield heliocentric radial velocities, which are listed in Table 4. We note that the forbidden emission due to O i appears blue-shifted in velocity.
| Line | pEW (Å) | (km s-1) |
|---|---|---|
| He i 5875.8 | 3.5 1.0 | 29 13a |
| Na i 5890.0 | 0.1 | – |
| Na i 5895.9 | 0.1 | – |
| O i 6300.3 | 2.1 0.5 | 7 13a |
| H 6562.8 | 260 30 | 23 13a |
| N ii 6583.5 | [0.2, 0.2] | – |
| Li i 6707.8 | 0.3 | – |
| Ca i 6717.7 | 0.5 0.1 | 32 13b |
| K i 7699.0 | 0.5 0.1 | 32 13b |
-
a
Velocity obtained from the line centroid.
-
b
Velocity obtained from the cross-correlation technique.
2.2 Optical photometry
We have also conducted multiwavelength optical and near-infrared broad-band observations of S Ori J053825.4024241 using the , , and filters and in white light. These data, which we have added to previous measurements available in the literature (2MASS photometry, Béjar et al. 2004, and Caballero et al. 2004, 2005), have been employed to monitor photometric variability on different timescales. Broad-band photometry has been obtained using the following telescopes: the 0.8 m IAC-80, the 1 m Optical Ground Station (OGS) and the 1.52 m Telescopio Carlos Sánchez (TCS) at the Teide Observatory, the 2.5 m Isaac Newton Telescope (INT) at Roque de los Muchachos Observatory, the 3.5 m Calar Alto Telescope at Calar Alto Observatory, and the 8 m Very Large Telescope UT1 (Antu) at Paranal Observatory. In Table 5 we provide the log of the observations. Listed are the Modified Julian Date of the beginning of the observations, total number of exposures and integration time per exposure, temporal coverage per observing date, and filter and instrument used.
Raw frames were reduced within iraf using standard techniques in the optical and near-infrared wavelengths. We have conducted a careful differential photometric analysis of all the data in the same manner as in Caballero et al. (2004). We refer to this paper for a description of the analysis.
| Observing date | Start | Exposure | t | Telescope | Instrument | Filter | Reference |
|---|---|---|---|---|---|---|---|
| MJD | time (s) | (h) | |||||
| 1998 Jan 22 | 50835.929 | 1 1800 | 1 | IAC-80 | ccd | Béjar et al. (2004) | |
| 1998 Jan 22 | 50835.983 | 1 1800 | 1 | IAC-80 | ccd | Béjar et al. (2004) | |
| 1999 Jan 22 | 51201.047 | 1 720 | 1 | TCS | cain-2 | this paper | |
| 1999 Jan 24 | 51202.870 | 1 720 | 1 | TCS | cain-2 | Béjar et al. (2004) | |
| 2000 Dec 30 | 51909.075 | 5 1500 | 1.4 | INT | wfc | Caballero et al. (2004) | |
| 2000 Dec 31 | 51909.901 | 10 1500 | 4.7 | INT | wfc | Caballero et al. (2004) | |
| 2001 Jan 01 | 51911.055 | 6 1500 | 5.2 | INT | wfc | Caballero et al. (2004) | |
| 2001 Dec 10 | 52254.295 | 1 1920 | 1 | Antu | isaac | Caballero et al. (2005) | |
| 2003 Jan 12 | 52647.414 | 12 1200 | 4.2 | INT | wfc | Caballero et al. (2004) | |
| 2003 Oct 19 | 52932.023 | 1 3600 | 1 | 3.5 m CA | o2k | Caballero et al. (2005) | |
| 2003 Oct 22 | 52935.201 | 1 600 | 1 | 3.5 m CA | o2k | Caballero et al. (2005) | |
| 2003 Dec 22 | 52995.596 | 3 600 | 1 | TCS | cain-2 | this paper | |
| 2003 Dec 22 | 52996.086 | 1 1200 | 1 | TCS | cain-2 | this paper | |
| 2003 Dec 26 | 53000.092 | 3 120 | 1 | IAC-80 | ccd | this paper | |
| 2003 Dec 28 | 53002.080 | 6 600 | 1 | IAC-80 | ccd | this paper | |
| 2004 Jan 11 | 53016.116 | 10 300 | 1 | OGS | esaccd | a | this paper |
| 2004 Jan 14 | 53019.061 | 20 300 | 1.9 | OGS | esaccd | a | this paper |
| 2004 Jan 24 | 53028.859 | 13 600 | 2.2 | IAC-80 | ccd | this paper | |
| 2004 Jan 25 | 53029.843 | 14 600 | 2.7 | IAC-80 | ccd | this paper | |
| 2004 Jan 30 | 53034.879 | 3 1200 | 1 | IAC-80 | ccd | this paper | |
| 2004 Jan 30 | 53034.854 | 46 300 | 4.0 | OGS | esaccd | a | this paper |
| 2004 Jan 31 | 53035.887 | 30 300 | 2.7 | OGS | esaccd | a | this paper |
| 2004 Feb 1 | 53036.833 | 45 300 | 6.3 | OGS | esaccd | a | this paper |
| 2004 Feb 2 | 53037.875 | 26 300 | 4.6 | OGS | esaccd | a | this paper |
| 2004 Feb 3 | 53038.948 | 6 600 | 1 | IAC-80 | ccd | this paper |
-
a
: Optical images taken with no filter.
2.2.1 -band differential photometry
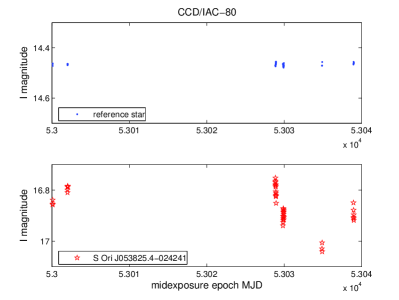
Using the Thomson 1024 1024 ccd camera (0.4325 arcsec pixel-1) at the IAC-80 telescope, we have carried out time-series differential -band photometry in a region of 6.5 6.5 arcmin2 around S Ori J053825.4024241. Our target was monitored during six nights. On two of these nights, it was followed for more than two hours. A total of 45 images have been used to build the IAC-80 -band light curve of the object, which is shown in Fig. 5. The minimum variation amplitude detectable is 0.025 mag. The seeing ranged from 1.2 to 2.0 arcsec during the observations. The combined final image is depicted in Figure 1. The photometric calibration of these data has been taken from Béjar et al. (2004).
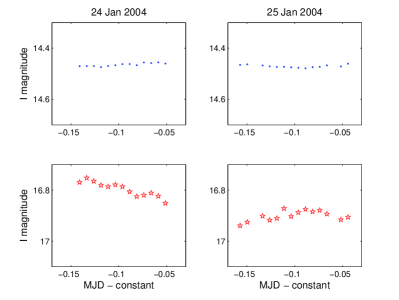
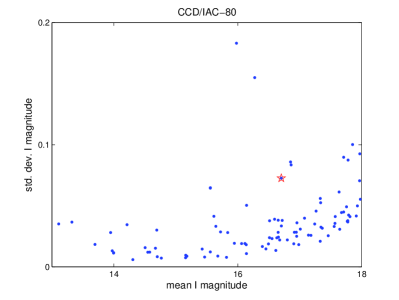
Figure 5 portrays the -band light curve of S Ori J053825.4024241 and of one reference star. Error bars are of the same size as the symbols in the plots. The data with the longest temporal coverage are enlarged in Figure 6. We have plotted the standard deviation of the light curves of 97 sources in the field of view as a function of -band magnitude in Figure 7. S Ori J053825.4024241 stands out from the trend defined by the great majority of the sources111The most variable objects in this diagram are two sources that are probably background large-amplitude eclipsing binaries that do not belong to the cluster according to their magnitudes. One of these binaries shows a light curve with primary and secondary minima of similar amplitude ( 0.6 mag) and a period of 5.5 h (coordinates J2000: 05 38 19.50 –02 41 22.5).. S Ori J053825.4024241 shows -band variations of 0.05 and 0.25 mag in timescales of hours and days, respectively. We note the marked brightness decrease around MJD = 53035, which lasted for about one week.
2.2.2 White light differential photometry
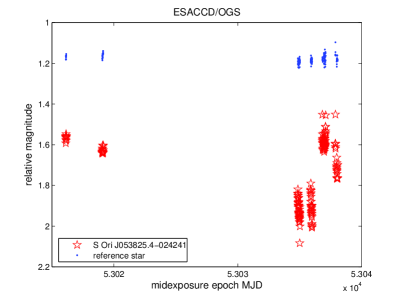
We have used the OGS telescope to photometrically monitor a large area (0.5 deg2) of the Orionis cluster. The mosaic detector of the esaccd camera comprises four E2V Technologies CCD42-40 devices (2048 2048 pixels, 0.62 arcsec pixel-1), which provides a total field of view of about 0.5 deg2 in a single spot. We collected data from January 2004 through to the beginning of February 2004 on six different nights. Here we will focus on the analysis of S Ori J053825.4024241.
We note that no filter was used when collecting the OGS data. This is indicated by (for “white light”) in the filter column of Table 5. Nevertheless, the detector is sensitive to optical wavelengths. We have computed the effective wavelength of the OGS observations for the case of S Ori J053825.4024241 by convolving the transmission function of the telescope, the response of the E2V CCDs and the spectral energy distribution of an M6-type dwarf (a significant fraction of the energy is released at red wavelengths). Our computations yield an effective wavelength of 7800 Å, which is intermediate between the Johnson (6410 Å) and bands (8500 Å) used at the IAC-80 telescope.
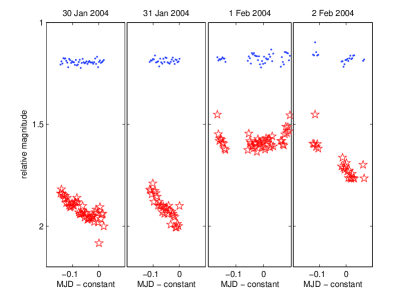
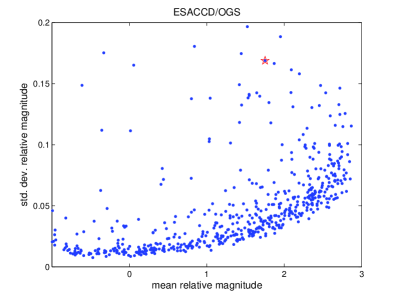
A total of 173 OGS images have been used to construct the light curve of our target. We have not attempted to correct the light curve for colour-dependent differential airmass extinction, as no particular trend is observed between various sources and S Ori J053825.4024241 from night to night. The minimum variation amplitude detectable from the OGS data is 0.020 mag. Figures 8, 9 and 10 show the complete OGS light curve of S Ori J053825.4024241, the details of four observing nights, and the standard deviation of the light curves as a function of magnitude, respectively. S Ori J053825.4024241 shows a marked variation amplitude at wavelengths shorter than 8000 Å: 0.2 mag on timescales of hours, and 0.5 mag from night to night. The brightness decrease at around MJD = 53035 is also observed in the OGS data.
2.3 Near-infrared photometry
We have obtained further near-infrared data ( and bands) at different epochs. All observations are summarized in Table 5. The instruments used were the NICMOS-3 256 256 cain-2 camera (1.00 arcsec pixel-1) at the TCS telescope, omega-2000 at the 3.5 m CAHA telescope and isaac at the UT1 Antu. The -band photometry obtained with the TCS in Jan 1999 was published in Béjar et al. (2004). The remaining near-infrared photometry of Table 5 is unpublished and presented in this paper for the first time (see Table 6). All near-infrared photometry has been referred to the 2MASS photometric system (S Ori J053825.4024241 was detected by 2MASS at MJD = 51116.323). We have carried out - and -band differential photometry of S Ori J053825.4024241 with respect to a certain number of reference stars within a radius of 20 arcmin from our target. The minimum variation amplitudes that can be detected are 0.03 mag in and 0.06 mag in . Our target has been observed in only once by 2MASS. Further discussion on the near-infrared variability of S Ori J053825.4024241 will be given in Section 3.5.
3 Discussion
3.1 Mass estimate
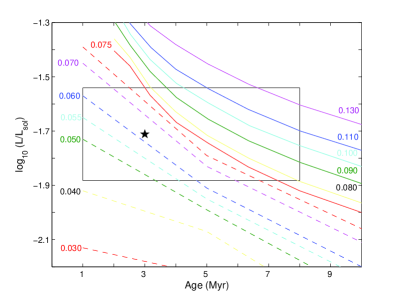
Stauffer, Schultz & Kirkpatrick (1998) and Martín et al. (1998) determined that the substellar mass limit lies at spectral type M6 in the Pleiades cluster (120 Myr). State-of-the-art evolutionary models predict that objects at the substellar boundary evolve at a roughly constant effective temperature (within 200 K) between a few million years and the age of the Pleiades to cool down very fast afterwards. Thus, it has been suggested that the star–brown dwarf boundary occurs at M5–6 in Orionis. The spectral type of S Ori J053825.4024241 is M 6, i.e. close to the cluster substellar limit. To constrain its mass with greater precision we compare the object luminosity to theoretical predictions. The luminosity of S Ori J053825.4024241 is derived from its -band average magnitude ( = 14.18 0.06) because, as we discuss in Section 3.5, this object shows the lowest photometric variability at these wavelengths. In addition, there is no obvious excess emission at in our data. To transform this colour magnitude into bolometric magnitude, we have used the bolometric correction vs. spectral type relation of Golimowski et al. (2004) and a distance of 360 70 pc to the Orionis cluster, deriving 9.0 0.4. The large error bar associated with this measurement is due to our poor knowledge of the cluster distance.
We show in Fig. 11 the luminosity evolution of objects with masses between 0.03 and 0.13 M⊙ as provided by the Lyon models (Baraffe et al. 1998, 2003; Chabrier et al. 2000). The most likely location of S Ori J053825.4024241 in this diagram is indicated by a star symbol at the age of 3 Myr, the most probable age of the cluster. The box around this location accounts for the uncertainty in the luminosity determination and the possible age interval (1–8 Myr) of the Orionis cluster. From Fig. 11, the mass of S Ori J053825.4024241 is estimated at 0.06 M⊙, indicating that this object is probably substellar.
3.2 H emission
With a pEW of about 250 Å, S Ori J053825.4024241 is one of the strongest H emitters in the Orionis cluster. The H strength of our target is about five times larger than that of the most active low-mass stars of the cluster, while only two substellar objects, S Ori 55 and 71, show higher H emission (Zapatero Osorio et al. 2002b; Barrado y Navascués et al. 2002). The marked persistence of the H line of S Ori J053825.4024241, which is always seen in substantial emission in our data, suggests that its origin is not due to a transient event. As mentioned in Section 2.1, S Ori J053825.4024241 shows broad H wings (Fig. 3). After correction for the contribution of the instrumental profile, the real H fwhm turns out to be 230 km s-1 (or 220 km s-1 if we consider the pedestal of the line at the 10% level of the peak flux). Such large velocity appears to be close to the break-up limit of S Ori J053825.4024241, so the H broadening is probably not caused by intrinsic rotation. We interpret the persistent broad H emission as due to hot mass infall or mass ejection (e.g., White & Basri 2003).
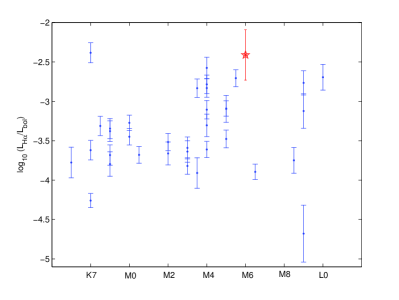
To compare the relative strength of the H emission of S Ori J053825.4024241 with those of other low-mass Orionis members, we have evaluated the ratio of our target. This quantity is independent of the surface area and represents the fraction of the total energy output in H. The bolometric luminosity was calculated using the given in Section 3.1 and the solar bolometric magnitude of 4.74. We followed Hodgkin et al. (1995) for obtaining from the width of the line, the colour and the -band magnitude. The colour is taken from Béjar et al. (2004), who provide quasi-simultaneous photometry in the two bands. We have estimated to be 21.0 0.5 mag by adopting the –spectral type relationship of Kirkpatrick et al. (1994). The NOT and Keck H measurements yield similar values within the error bar, i.e. 2.4 0.3 (222If the object were brighter in than expected, e.g. = 20.0 0.5, could be as high as 2.0 0.3.). The error bar takes into account photometric uncertainties and the error in the distance to the cluster. Figure 12 shows as a function of spectral type for cluster members. Except for our target, data have been gathered from Zapatero Osorio et al. (2002a, 2002b) and Barrado y Navascués et al. (2002). S Ori J053825.4024241 exhibits quite intense emission, which is comparable to that of active stellar accretors.
3.3 Other emission lines and radial velocity
The “photospheric” radial velocity of S Ori J053825.4024241 ( = 32 13 km s-1) is consistent with membership of the Orionis cluster. The cluster systemic velocity is in the range 27 to 38 km s-1 (Bohannan & Garmany 1978; Garmany, Conti & Massey 1980; Morrell & Levato 1991). Zapatero Osorio et al. (2002a) and Kenyon et al. (2005) found mean heliocentric velocities of 37 6 and 31.2 0.2 km s-1, respectively, for low-mass members of the cluster.
Emission lines, if originating outside the photosphere, may show a different velocity. The measurements of H and He i 5876 are in agreement with the “photospheric” velocity of S Ori J053825.4024241 within the 1 uncertainty. However, [O i] 6300 shows a moderate blue-shifted velocity of about 2. This may indicate the presence of low density gas outflow (mass loss, wind), which is a process commonly found in Classical T Tauri stars with jets. The red component of this emission line might be hidden by an opaque disc (Appenzeller, Jankovics & Östreicher 1984; Edwards et al. 1987). It has also been suggested (Corcoran & Ray 1997) that low velocity forbidden line emission (like the one we have measured in S Ori J053825.4024241) could be due to disc wind.
3.4 Lithium and optical veiling
Lithium at 6707.8 Å is not detected in any of our spectroscopic data. From the observed spectra, we can impose upper limits on the line pEW of 0.7 Å (NOT) and 0.3 Å (Keck). Because of the very young age of Orionis, it is expected that all cluster stars and brown dwarfs have depleted none of their initial lithium abundance.
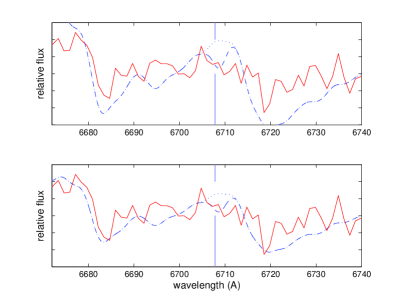
We have computed a few synthetic spectra around lithium using the code of Pavlenko, Zapatero Osorio & Rebolo (2000), and = 2900 K, = 4.0 and solar metallicity, which are the expected photospheric parameters of an M6-type dwarf in Orionis. The theoretical spectra have been degraded to match the resolution of 4 Å. Computations have been carried out considering two different lithium abundances (log = 3.0, i.e. no depletion, and complete depletion), and the presence of veiling. S Ori J053825.4024241 shows a very strong H emission suggestive of intense accretion; furthermore, the colour and the titanium oxide bands of this object appear bluer and weaker, respectively, than expected for M6 dwarfs, possibly indicating the presence of some blue continuum excess. For our computations, we have adopted a flat energy distribution in the wavelength interval 6672–6740 Å for the flux continuum excess. Our results are depicted in Fig. 13, where the top panel shows the comparison between the observed Keck spectrum of S Ori J053825.4024241 and the “unveiled” synthetic spectra, and the bottom panel displays S Ori J053825.4024241 and the “veiled” computations. It is apparent from the figure that the TiO features of S Ori J053825.4024241 are better reproduced by the spectral synthesis including some veling. An amount of = 0.5, where , reasonably matches the observations. The lithium absorption feature is detectable in the unveiled, lithium-rich, 4 Å-resolution theoretical spectrum (pEW 0.3 Å), whereas it becomes rather weak in the veiled spectrum. Therefore, the non-detection of lithium in our data is still consistent with complete preservation. Higher-resolution spectra are needed to study lithium in S Ori J053825.4024241.
3.5 Photometric variability and the Classical T Tauri scenario
Based on our optical data, we conclude that S Ori J053825.4024241 presents the largest variability among very low-mass stars and brown dwarfs so far identified in the Orionis cluster The amplitude of the variations in the -band (8500 Å) are 0.05 mag in timescales of hours and 0.25 mag on timescales of days. The variability is even larger at shorter wavelengths. These conclusions strongly support the Classical T Tauri (CTT) picture. As noted by Appenzeller & Mundt (1989), all carefully monitored CTT stars have turned out to be variables. We have searched for a periodic signal in the IAC80 and OGS data of S Ori J053825.4024241 by calculating the power spectrum as described in Caballero et al. (2004). We have found no significant peaks in the periodograms.
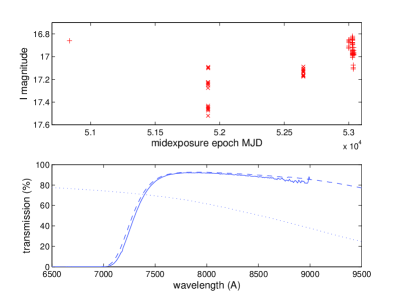
To study the long-term optical photometric variability of S Ori J053825.4024241 we have compared our data to previously published data obtained at different epochs and using similar instrumentation. These data and the new photometry presented here span a total of 6 years of observations. The -band filters used at the IAC-80 and INT are very similar as inferred from their transmission curves shown in the bottom panel of Figure 14. For direct comparison, all data have been referred to the same photometric calibration as in Béjar et al. (2004). The comparison of the light curves of the reference stars in common between the IAC-80 and INT datasets yields a dispersion of 0.025 mag. The complete set of -band observations is depicted in the top panel of Figure 14. S Ori J053825.4024241 also presents long-term photometric varibility in the optical with an amplitude of 0.7 mag. This is larger than the short-term variation amplitude. Further data are needed to investigate whether the optical light curve of S Ori J053825.4024241 consists of a long, very large amplitude variation on to which variations of smaller amplitudes and shorter timescales are superimposed (see Scholz & Eislöffel 2004). We provide in Table 6 the intervals of the photometric magnitudes that we have measured in the optical and near-infrared.
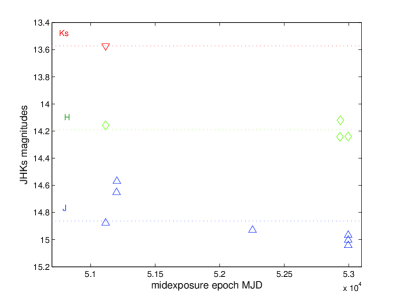
Figure 15 shows all near-infrared photometry of S Ori J053825.4024241 available to date as a function of the epoch of the observations. The -band photometry appears to be rather stable within 1 the uncertainty. At , our target shows a large scatter, suggesting variability. The amplitude of the variations is about 0.5 mag, which compares with the optical variability. The photometric variability of CTT stars decreases towards longer wavelengths because the origin of the variations probably lie in hot and/or cold photospheric spots covering a significant percentage of the object surface. It is also believed that part of the variability is due to occultations by inhomogeneities of the inner disc regions, which show less dependence on wavelength. This picture might be applicable to S Ori J053825.4024241 to explain its peculiar optical and near-infrared light-curves. We note that S Ori J053825.4024241 presents a clear flux excess at 2.2 m (Béjar et al. 2004; Caballero et al. 2004), which may be associated with the presence of a surrounding disc.
| Filter | Magnitude | Source |
|---|---|---|
| 20.9 | USNO-B1 | |
| 18.66 0.05 | Béjar et al. (2004) | |
| 16.82–17.52 | this paper | |
| 14.57–15.04 | this paper | |
| 14.18 0.06 | this paper | |
| 13.57 0.03 | 2MASS |
-
a
A single measurement.
Interestingly, S Ori J053825.4024241 is detected in the USNO-B1 blue plates (Monet et al. 2003), from which we have obtained the blue photographic magnitude. This magnitude has been converted into the standard magnitude by applying the conversion equation of Zombeck (1990). We provide our measurement in Table 6. From the magnitude and the typical colours of M5–7 dwarfs, it is also apparent that S Ori J053825.4024241 presents a flux excess at blue wavelengths. This result is consistent with the presence of veiling as discussed in the previous section. We note that on some occasions, when the accretion activity is large, S Ori J053825.4024241 may show up bluer in the optical than other cluster members of similar types. This might explain why this object was not selected as a cluster member candidate from previous surveys in the region.
4 Summary and conclusions
We have obtained low-resolution optical spectroscopy ( 600) in the wavelength interval 5300–9600 Å of four low-mass candidate members of the Orionis cluster (360 70 pc, 1–8 Myr). These objects were selected from the photometric surveys by Béjar et al. (2004) and Caballero et al. (2004). We have determined spectral types between M5 and M6 for these sources, which are consistent with our expectations for true cluster members. Furthermore, all of them show spectroscopic features typical of low-gravity atmospheres, supporting their membership of the cluster.
One object, namely S Ori J053825.4024241 (M 6.01.0), was known to be variable in the band (Caballero et al. 2004) and to show slightly bluer and redder colours than other Orionis members of similar magnitude (Béjar et al. 2004). From our low-resolution spectroscopic data, S Ori J053825.4024241 presents a strong H emission (one of the largest among known low-mass cluster members), which, in addition to the near-infrared flux excess, suggests that this object is undergoing accretion processes from a surrounding disc.
To confirm the possible T Tauri nature of S Ori J053825.4024241, we have obtained follow-up higher resolution spectra ( 1700) in the wavelength interval 5600–8100 Å and have photometrically monitored the object in the , and bands and in white light. S Ori J053825.4024241 shows persistent, strong H emission. In addition, other forbidden and permitted emission lines have been detected, e.g. Oi 6300.3 and He i 5875.8. The pseudo-equivalent widths of all these emission lines are consistent with the measurements of known stellar accretors. Furthermore, H is found to be broadened with widths typical of T Tauri stars, which indicates the presence of gas infall at high velocities. From the comparison of our spectroscopic data to theoretical spectra, we infer that some continuum flux excess is present at short wavelengths. We quantify this “veiling” to be around 0.5 in the Li i 6707.8 region. S Ori J053825.4024241 has a radial velocity consistent with membership of the Orionis cluster.
S Ori J053825.4024241 is confirmed to be an irregular variable object. Variations, which do not show any obvious modulation pattern, are significant (0.05–0.7 mag) from blue wavelengths up to the band. Variability is found at all timescales. Our -band photometry appears rather stable in time, suggesting little variability at wavelengths greater than 1.2 m. Both the photometric and spectroscopic properties of S Ori J053825.4024241 are consistent with the T Tauri scenario. Assuming that S Ori J053825.4024241 is a member of the Orionis cluster, we have estimated its mass at 0.06 M⊙ after comparison with state-of-the-art evolutionary models. Based on our data, we conclude that S Ori J053825.4024241 is probably a brown dwarf undergoing processes similar to those of T Tauri stars.
Acknowledgements.
We would like to thank Terry Mahoney for revising the English of the manuscript and the anonymous referee for comments and suggestions that improved the article. JAC thanks to staff at the Observatorio del Teide for performing the Observaciones de Tiempo de Servicio and to David Barrado y Navascués, Gabriel Bihain, Jorge Sanz Forcada and María del Mar Sierra for helpful comments. Partial financial support was provided by the Spanish Ministerio de Ciencia y Tecnología, project AYA2001-1657 of the Plan Nacional de Astronomía y Astrofísica, and Ministerio de Educación y Ciencia, projects AYA2001-1657 and AYA2003-05355. YP’s studies are partially supported by Royal Society and Leverhulme Trust grants. Research presented herein was partially funded by NSF research grant AST 02-05862. Acknowledgements of the use of telescopes, instruments, catalogues and software can be found in the electronic version. ONLY IN THE ELECTRONIC VERSION: The Telescopio IAC-80 and the Telescopio Carlos Sánchez are operated on the island of Tenerife by the Instituto de Astrofísica de Canarias in the Spanish Observatorio del Teide of the Instituto de Astrofísica de Canarias. Based on observations made with the European Space Agency Orbital Ground Station telescope operated on the island of Tenerife by the Instituto de Astrofísica de Canarias in the Spanish Observatorio del Teide of the Instituto de Astrof sica de Canarias. Based on observations made with the Nordic Optical Telescope, operated on the island of La Palma jointly by Denmark, Finland, Iceland, Norway, and Sweden, in the Spanish Observatorio del Roque de los Muchachos of the Instituto de Astrofísica de Canarias. The data presented here have been taken using ALFOSC, which is owned by the Instituto de Astrofísica de Andalucía (IAA) and operated at the Nordic Optical Telescope under agreement between IAA and the NBIfAFG of the Astronomical Observatory of Copenhagen. Some of the data presented herein were obtained at the W. M. Keck Observatory, which is operated as a scientific partnership among the California Institute of Technology, the University of California and the National Aeronautics and Space Administration. The Observatory was made possible by the generous financial support of the W. M. Keck Foundation. The authors wish to recognize and acknowledge the very significant cultural rôle and reverence that the summit of Mauna Kea has always had within the indigenous Hawaiian community. We were most fortunate to have had the opportunity to conduct observations from this mountain. This research has made use of the SIMBAD database, operated at CDS, Strasbourg, France. This publication makes use of data products from the Two Micron All Sky Survey, which is a joint project of the University of Massachusetts and the Infrared Processing and Analysis Center/California Institute of Technology, funded by the National Aeronautics and Space Administration and the National Science Foundation. The Guide Star Catalogue-II is a joint project of the Space Telescope Science Institute and the Osservatorio Astronomico di Torino. Space Telescope Science Institute is operated by the Association of Universities for Research in Astronomy, for the National Aeronautics and Space Administration under contract NAS5-26555. The participation of the Osservatorio Astronomico di Torino is supported by the Italian Council for Research in Astronomy. Additional support is provided by European Southern Observatory, Space Telescope European Coordinating Facility, the International GEMINI project and the European Space Agency Astrophysics Division. iraf is distributed by National Optical Astronomy Observatories, which are operated by the Association of Universities for Research in Astronomy, Inc., under cooperative agreement with the National Science Foundation.References
- (1) Appenzeller, I. Jankovics, I., & Östreicher, R. 1984, A&A, 141, 108
- (2) Appenzeller, I. & Mundt, R. 1989, A&ARv, 1, 291
- (3) Baraffe, I., Chabrier, G., Allard, F., & Hauschildt, P. H. 1998, A&A, 337, 403
- (4) Baraffe, I., Chabrier, G., Barman, T., Allard, F., & Hauschildt, P. H. 2003, A&A, 402, 701
- (5) Barrado y Navascués, D., Zapatero Osorio, M. R., Martín, E. L., Béjar, V. J. S., Rebolo, R. & Mundt, R. 2002, A&A, 393, L85
- (6) Barrado y Navascués, D. & Martín, E. L. 2003, AJ, 126, 2997
- (7) Barrado y Navascués D., Béjar, V. J. S., Mundt, R., Martín, E. L., Rebolo, R., Zapatero Osorio, M. R. & Bailer-Jones, C. A. L. 2003, A&A, 404, 171
- (8) Béjar, V. J. S., Martín, E. L., Zapatero Osorio, M. R., Rebolo, R., 2004, Barrado y Navascués, D., Bailer-Jones, C. A. L., Mundt, R., Baraffe, I., Chabrier, C. & Allard, F. 2001, ApJ, 556, 830
- (9) Béjar, V. J. S., Zapatero Osorio, M. R., Rebolo, R. 2004, AN, 325, 705
- (10) Bertout, C., Basri, G. & Bouvier, J. 1988, ApJ, 330, 350
- (11) Bohannan, B. & Garmany, C. D. 1978, ApJ, 223, 908
- (12) Caballero, J. A., Béjar, V. J. S., Rebolo, R. & Zapatero Osorio, M. R. 2004, A&A, 424, 857
- (13) Caballero, J. A. on behalf of the jovian Collaboration, IAC/TNG Workshop on Ultralow-mass star formation and evolution, La Palma, 2005 June 28 – July 1. Eds. E. Martín & A. Magazzù, in press.
- (14) Chabrier, G., Baraffe, I., Allard, F. & Hauschildt, P. 2000, 542, 464
- (15) Corcoran, M., & Ray, T. P. 1997, A&A, 321, 189
- (16) Edwards, S. E., Cabrit, S., Strom, S. E., Heyer, I., Strom, K. M., &Anderson, E. 1987, ApJ, 321, 473
- (17) Furlan, E., Calvet, N., D’Alessio, P., Hartmann, L., Forrest, W. J., Watson, D. M., Luhman, K. L., Uchida, K. I., Green, J. D., Sargent, B. et al. 2005, ApJ, 621, L129
- (18) Garmany, C. D., Conti, P. S. & Massey, P. 1980, ApJ, 242, 1063
- (19) Golimowski, D. A., Leggett, S. K., Marley, M. S., Fan, X., Geballe, T. R., Knapp, G. R., Vrba, F. J., Henden, A. A., Luginbuhl, C. B., Gütter, H. H. et al. 2004, AJ, 127, 3516
- (20) Hodgkin, S. T., Jameson, R. F. & Steele, I. A. 1995, MNRAS, 274, 869
- (21) Kenyon, M. J., Jeffries, R. D., Naylor, T., Oliveira, J. M. & Maxted, P. F. L. 2005, MNRAS, 356, 89
- (22) Kirkpatrick, J. D., McGraw, J. T., Hess, T. R., Liebert, J. & McCarthy, D. W., Jr. 1994, ApJS, 94, 749
- (23) Königl, A. 1991, ApJ, 370, L39
- (24) Luhman, K. L., Liebert, J., Rieke, G. H. 1997, ApJ, 489, L165
- (25) Martín, E. L., Rebolo, R., Zapatero Osorio, M. R. 1996, ApJ, 469, 706
- (26) Martín, E. L., Basri, G., Gallegos, J. E., Rebolo, R., Zapatero Osorio, M. R., Béjar, V. J. S. 1998, ApJ, 499, L61
- (27) Mohanty, S., Jayawardhana, R. & Basri, G. 2005, ApJ, 626, 498
- (28) Monet, D. G., Levine, S. E., Casian, B., Ables, H. D., Bird, A. R., Dahn, C. C., Guetter, H. H., Harris, H. C., Henden, A. A., Leggett, S. K. et al. 2003, AJ, 125, 984
- (29) Morrell, N. & Levato, H. 1991, ApJS, 75, 965
- (30) Muzerolle, J., Hillenbrand, L., Calvet, N. Briceño, C. & Hartmann, L. 2003, ApJ, 592, 266
- (31) Natta, A., Testi, L., Muzerolle, J., Randich, S., Comerón,F., & Persi, P. 2004, A&A, 424, 603
- (32) Oliveira, J. M., Jeffries, J. D. & van Loon, J. Th. 2004, MNRAS, 347, 1327
- (33) Osterbrock, D. E., Fulbright, J. P., Martel, A. R., Keane, M. J., Trager, S. C., & Basri, G. 1996, PASP, 108, 277
- (34) Pavlenko, Ya., Zapatero Osorio, M. R. & Rebolo, R. 2000, A&A, 354, 229
- (35) Scholz, A. & Eislöffel, J. 2004, A&A, 419, 249
- (36) Stauffer, J. R., Schultz, G., & Kirkpatrick, J. D. 1998, ApJ, 499, L199
- (37) Tinney, C. G., & Reid, I. N. 1998, MNRAS, 301, 1031
- (38) Walter, F. M., Wolk, S. J., & Sherry, W. 1998, ASP Conf. Ser., 154, CD–1793
- (39) White, R. J. & Basri, G. 2003, ApJ, 582, 1109
- (40) Zapatero Osorio, M. R., Béjar, V. J. S., Pavlenko, Ya., Rebolo, R., Allende Prieto, C., Martín, E. L. & García López, R. J. 2002a, A&A, 384, 937
- (41) Zapatero Osorio, M. R., Béjar, V. J. S., Martín, E. L., Barrado y Navascués, D. & Rebolo, R. 2002b, ApJ, 569, L99
- (42) Zombeck, M. V. 1990, Handbook of Astronomy and Astrophysics, Second Edition (Cambridge, UK: Cambridge University Press)