The Evolved Stellar Content of NGC 147, NGC 185, and NGC 205
Abstract
Broad-band near-infrared images are used to probe the photometric properties of the brightest asymptotic giant branch (AGB) stars within 2 arcminutes of the centers of the dwarf elliptical galaxies NGC 147, NGC 185, and NGC 205. Sequences originating from oxygen-rich M giants and C stars are clearly distinguished on the and color-magnitude diagrams (CMDs). Based on the peak brightness and color of the M giant sequences, ages of 1 Gyr and 0.1 Gyr are predicted for the most recent significant star forming events in NGC 185 and NGC 205, respectively. The bolometric luminosity function (LF) of M giants in NGC 205 is flatter than in NGC 185, in agreement with studies at wavelengths shortward of m. The most luminous AGB stars in NGC 147 are well mixed with fainter stars throughout the area surveyed in this galaxy, and the peak brightness of the M giant sequence indicates that the most recent significant star-forming activity occured Gyr in the past.
The C star contents of the three galaxies are compared in two ways. First, the notion of a specific frequency measurement for C stars, in which C star counts per unit magnitude are normalised to a common integrated band brightness using published surface photometry, is introduced. The specific frequency of C stars outside of the areas of most recent star formation is found to agree in all three galaxies. Second, comparisons are made using the integrated brightness from C stars, which is normalised to the integrated light from M giants and the integrated light from all stars. The fractional contribution made by C stars to the total AGB light in the band is found to be highest in NGC 147 and lowest in the central regions of NGC 205, which is qualitatively consistent with model predictions. The fractional contribution that C stars make to the total band light is found to be constant both within and between galaxies, with C stars contributing 2% of the total band light. It is concluded that, when averaged over timescales of a few Gyr, these galaxies have turned similar fractions of gas and dust, normalised according to total galaxy mass, into stars. It is argued that the material for star formation likely originated in well-regulated reservoirs, and it is demonstrated that the mass of gas needed to fuel star formation during intermediate epochs could have been supplied by winds from evolved stars. Finally, multi-epoch data are used to investigate the incidence of long period variables (LPVs) in NGC 185 and NGC 205. While tight constraints can not be placed on the LPV content of NGC 205, roughly 70% of the stars with MK between –7.5 and –8.0 in the central regions of NGC 185 appear to be LPVs with amplitudes similar to those of LPVs in the LMC.
1 INTRODUCTION
Spiral galaxies are accompanied by satellites that have a range of structural characteristics. The brightest companions of some spiral galaxies tend to be disks, while in other cases the brightest companions are spheroids. This diversity in companion properties is clearly evident among the closest large spiral galaxies. The brightest satellites of the Milky-Way are the disk-dominated LMC and SMC, both of which show moderate levels of star formation at the present day. For comparison, the brightest companions of the next nearest large spiral galaxy, M31, tend to be gas-poor spheroids, including the compact elliptical galaxy M32 and the dwarf ellipticals (dEs) NGC 147, NGC 185, and NGC 205. 333While M31 also has gas-rich dwarf irregular companions (e.g. Evans et al. 2000; Courteau & van den Bergh 1999; Mateo 1998), only two (IC 1613 and IC 10) have integrated brightnesses that are comparable to those of M32 and the three dEs. These dwarf irregular galaxies are at very large galacto-centric distances ( kpc), and IC 1613 may not even be bound to M31 (e.g. Courteau & van den Bergh 1999; Mateo 1998). The next closest large spiral galaxy - M81 - is accompanied by a mixture of disk and spheroid galaxies that have a broad range of star-forming properties, some of which are experiencing elevated levels of star formation due to tidal interactions (e.g. Yun, Ho, & Lo 1994). Despite the differences among the most easily studied high surface brightness satellites, M81, M31, and the Milky-Way are all accompanied by an entourage of dwarf spheroidal (dSph) galaxies that show broadly similar characteristics (Karachentev et al. 2001).
Initial conditions, such as the fractional dark matter content, could affect morphology (e.g. Ferrara & Tolstoy 2000; Carraro et al. 2001), and so are a possible cause of the range in structural properties seen among the satellite systems. Studies of dE’s in the Virgo cluster (Geha, Guhathakurta, & van der Marel 2002) and the Local Group (e.g. Held et al. 1992) find M/L ratios that are suggestive of no significant dark matter contribution, at least within the visible portions of these systems. For comparison, Local Group dSphs appear to have high M/L ratios that are suggestive of a large dark matter halo (e.g. Irwin & Hatzidimitriou 1995; Kleyna et al. 2002). As for dwarf irregular galaxies, Cote, Carignan, & Freeman (2000) find that the M/L ratios of these objects in the Sculptor and Centaurus groups span a range of values, implying a dispersion in dark matter contents.
Environment can also influence morphology; for example, it has been suggested that galaxy-galaxy encounters in dense environments and tidal interactions with larger systems may transform disk systems into spheroids (e.g. Moore, Lake, & Katz 1998; Mayer et al. 2001). In extreme cases tidal interactions will completely disrupt some satellites, with only the dense central regions surviving to the present day and the stars that once belonged to the disrupted system being distributed along debris trails (e.g. Bekki & Chiba 2004; Mizutani, Chiba, & Sakamoto 2003; Bekki & Freeman 2003). It has been suggested that M32 may have evolved in such as manner, starting as a disk galaxy that was transformed by interactions with M31; Graham (2002) argues that signatures of the disk remain to the present day.
The stellar contents of satellites provide a fossil record that can be mined to reveal their histories and gauge the impact that any interactions with larger companions have had on their evolution. NGC 147, NGC 185, and NGC 205 are important targets as they are similar to more distant dE galaxies (e.g. Zinnecker & Cannon 1986), and have a wide range of projected distances from M31, raising the possiblity that the effects of environment might be de-coupled from any intrinsic properties of the galaxies. For example, a correlation between the number of stars that formed during the past few Gyr and distance from M31 might indicate that interactions with M31 played a key role in spurring star formation in these galaxies, and might even have provided the gas and dust necessary to stoke star formation. On the other hand, a discovery of similar star forming histories, despite the differences in environment, would favour the notion that the evolution of these galaxies is dominated by intrinsic properties.
Given their importance as the nearest dEs, it is not surprising that the three M31 dE companions have been the target of a number of investigations. NGC 147 has been found to contain a modest population of relatively bright AGB stars, that are the brightest members of a population that accounts for only a small fraction of the total band light (Davidge 1994). The absence of main sequence turn-off stars with M indicates that the most recent large scale star-forming activity occured at least 1 Gyr in the past (Han et al. 1997). NGC 147 contains C stars (e.g. Nowotny et al. 2003). Battinelli & Demers (2004a) find that the C stars are uniformly mixed throughout the main body of the galaxy, and may be slightly fainter on average in the band than their counterparts in other Local Group galaxies. There is a large population of older stars, and the color of the RGB indicates that [Fe/H] is between –0.9 and –1.2, with a dispersion about the mean value and possible radial gradients in both metallicity and age (Mould, Kristian, & Da Costa 1983; Davidge 1994; Han et al. 1997). A spread in metallicity indicates that NGC 147 has experienced chemical enrichment. Nevertheless, HI has yet to be detected in NGC 147 (Young & Lo 1997), and the upper limit computed for the ISM mass is markedly lower than is expected if material ejected from evolved stars has been retained by the galaxy, suggesting that the ISM has been depleted (Sage, Welch, & Mitchell 1998).
NGC 185 contains stars that span a broader range of ages than in NGC 147 (Lee, Freedman, & Madore 1993; Martinez-Delgado & Aparicio 1998; Martinez-Delgado, Aparicio, & Gallart 1999). The youngest stars have an age near 400 Myr (Butler & Martinez-Delgado 2005) and are concentrated in the central parsec2; outside of this area there are stars with ages of at least 1 Gyr, which in turn are more centrally concentrated than even older populations (Martinez-Delgado et al. 1999). Kang et al. (2005) surveyed the AGB content of the central regions of NGC 185 at near-infrared wavelengths, and found 73 C stars. The mean MI of C stars in NGC 185 is comparable to that in NGC 147, although the C stars in NGC 185 are more centrally concentrated than in NGC 147 (Battinelli & Demers 2004b; Nowotny et al. 2003). The mean metallicity of the RGB is [Fe/H] = –1.2, with a dispersion of dex (Lee et al. 1993). The ISM in NGC 185 is concentrated near the present-day star-forming region, although the atomic and molecular components are not spatially coincident (Welch, Mitchell, & Yi 1996; Young 2001). The morphology and kinematic properties of the ISM are consistent with it originating from stars internal to NGC 185 (Young & Lo 1997; Martinez-Delgado et al. 1999).
NGC 205 is the brightest of the three dE companions of M31. There is a centrally concentrated population of young blue stars that have ages in the range Myr (Cappellari et al. 1999), and a solar metallicity AGB component that is uniformly mixed throughout the central 1 arcmin (Davidge 1992). Lee (1996) concludes that the AGB-tip in NGC 205 is mag brighter in than in NGC 185, and that the AGB luminosity functions (LFs) of these galaxies also differ, in the sense that the LF of NGC 205 is the flatter of the two. However, the C stars in NGC 205 have an average MI that is similar to what is seen in NGC 147 and NGC 185 (Demers, Battinelli, & Letarte 2003). The color of the RGB suggests that [Fe/H] = –0.9 with a dispersion of dex (Mould, Kristian, & Da Costa 1984). As with NGC 147, the total ISM mass of NGC 205 is less than expected if the mass lost from stars has been retained (Welch, Sage, & Mitchell 1998).
NGC 205 is the closest dE to M31; hence, it might be anticipated that M31 has had a greater impact on the evolution of NGC 205 than on the evolution of either NGC 147 or NGC 185. In fact, the orbits of NGC 205, M32, and M31 indicate that there may have been past interactions (Cepa & Beckman 1988), and there are a number of other clues that support this notion. First, the star-forming history of NGC 205 inferred from AGB stars is correlated with the orbit about M31, in that the AGB content shows evidence for multiple episodes of star formation during the past Gyr, with the most recent occuring within the past 0.1 Gyr (Davidge 2003). Second, the gas and stars in NGC 205 form distinct dynamical systems (Young & Lo 1997; Welch et al. 1998), as might be expected if the molecular clouds have been tidally affected by interactions with M31. Third, the isophotal properties of NGC 205 and the presence of stellar debris trails in the vicinity of M31 are indicative of interactions (e.g. Ibata et al. 2001, Choi, Guhathakurta, & Johnston 2002, and McConnachie et al. 2004). Finally, there is an HI cloud 25 arcmin southwest of NGC 205 that may contain material that has been stripped from the galaxy (Thilker et al. 2004).
The majority of stellar content studies of NGC 147, NGC 185, and NGC 205 have used data that sample the visible and red portions of the spectrum. This wavelength region is of critical importance for probing young, blue stars and the hotter red giants that belong to moderately young and very metal-poor old populations. However, the visible portion of the spectrum is not ideal for studies of the reddest stars, such as those evolving near the AGB-tip, as the brightnesses of these objects at visible wavelengths are affected by line blanketing. This causes the AGB to form a horizontal or even descending sequence on CMDs constructed from visible wavelength data, thereby complicating efforts to detect stars near the AGB-tip. Not only does the observed brightness of AGB-tip stars at visible wavelengths not reflect the true luminosity of these objects, but the contrast between AGB-tip stars and bluer objects is diminished, such that AGB-tip stars may occur in a brightness regime where confusion with more numerous objects, such as RGB stars, becomes an issue.
The problems caused by line blanketing are much reduced in the near-infrared, where the AGB forms a near-vertical sequence on CMDs (e.g. Davidge 2003). The contrast with respect to bluer stars is enhanced, and the brightness of the AGB-tip is easier to measure than at visible wavelengths. Finally, C stars can also be selected using broad-band near-infrared colors (Davidge 2003, Hughes & Wood 1990). Near-infrared color is a criterion that differs from the narrow-band filter technique that is traditionally used to identify C stars in the red part of the spectrum (e.g. Richer, Crabtree, & Pritchet 1984), and so a comparison of C star properties based on near-infrared color and narrow-band imaging is of interest.
In the present study, images are used to investigate the bright AGB contents of NGC 147, NGC 185, and NGC 205. The data were obtained during the same night and with the same instrument, and thus are well-suited for comparing the relative stellar contents of these systems. The core data for NGC 185 and NGC 205 are supplemented with band observations obtained with the same instrument during a previous observing run, which are used to investigate the frequency and amplitude distribution of variable stars.
The distances and reddenings adopted in this study are listed in Table 1. The distances are based on the band RGB-tip brightnesses measured by McConnachie et al. (2005), while the reddenings are from the maps constructed by Schlegel, Finkbeiner, & Davis (1998). The distances from the center of M31 in kpc, RM31, assuming the RGB-tip distance for M31 computed by McConnachie et al. (2005), are listed in the last column of Table 1. Of the three dEs, NGC 185 is the most distant from M31.
The paper is structured as follows. Details of the observations and the procedures used to process the data are presented in §2, while the photometric measurements are discussed in §3. The general characteristics of the color-magnitude diagrams (CMDs) and LFs are discussed in §4, while galaxy-to-galaxy comparisons of the properties of M giants and C stars are the subject of §5. The properties of LPVs in NGC 185 and NGC 205 are examined in §6. A discussion and summary of the results follows in §7.
2 OBSERVATIONS & REDUCTIONS
Near-infrared images of the central regions of NGC 147, NGC 185, and NGC 205 were recorded with the CFHTIR imager on the night of UT November 21/22 2002. The CFHTIR detector is a HgCdTe array, with an image scale of 0.21 arcsec pixel-1 when mounted at the Cassegrain focus of the 3.6 metre Canada-France-Hawaii Telescope. The data were recorded through and filters as a series of relatively short (20 – 60 sec) exposures to prevent saturating the background sky and the brightest stars in each field. The total integration time is 12 minutes filter-1 galaxy-1.
A separate set of observations were recorded of NGC 185 and NGC 205 with the CFHTIR during an observing run in June 2001, and these data are used in §6 to investigate the variability of bright AGB stars in these galaxies. The NGC 205 observations were discussed previously by Davidge (2003), and a complete description of those data can be found in that paper. The NGC 185 data were recorded on the night of UT June 5/6 2001. The total integration time is 8 minutes, and thin clouds were present when the data were recorded.
Data needed to construct calibration frames that can correct for artifacts introduced by the telescope, the instrument, and the sky were recorded on each night of the 2001 and 2002 observing runs. Flat field images of the dome were obtained at the beginning of each night, while the dark current was monitored at the end of each night. The flat-field pattern and dark count rate did not vary during each run, and so the nightly calibration exposures were combined to create master flat-field and dark frames. Areas of the sky with low stellar density were also observed at various times throughout each night, and these data were used to construct calibration images that monitor interference fringe patterns and the thermal emission from warm objects along the optical path.
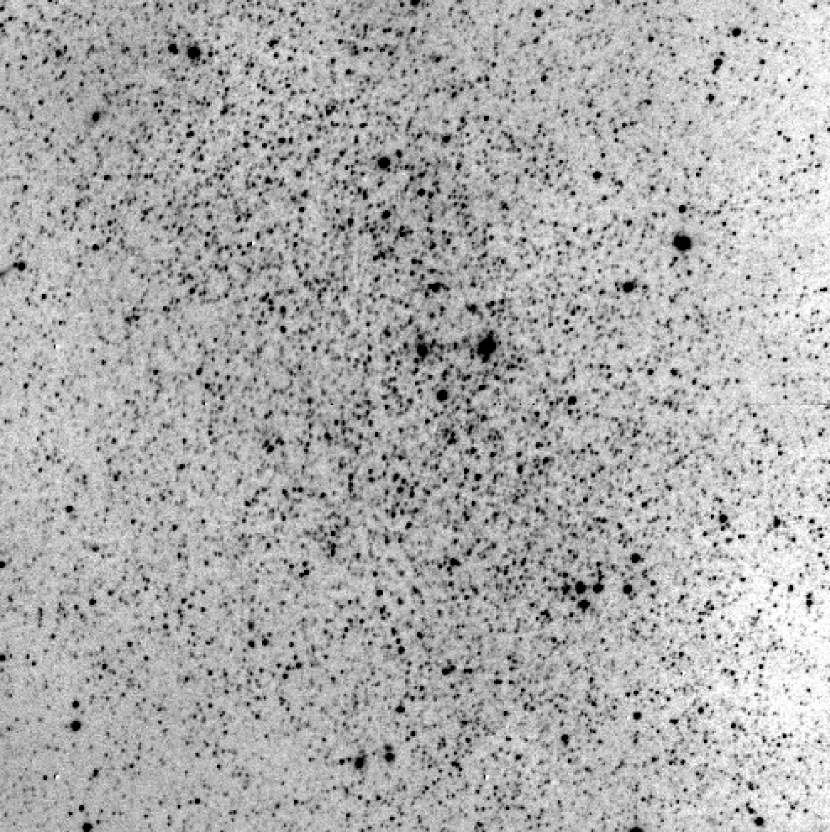
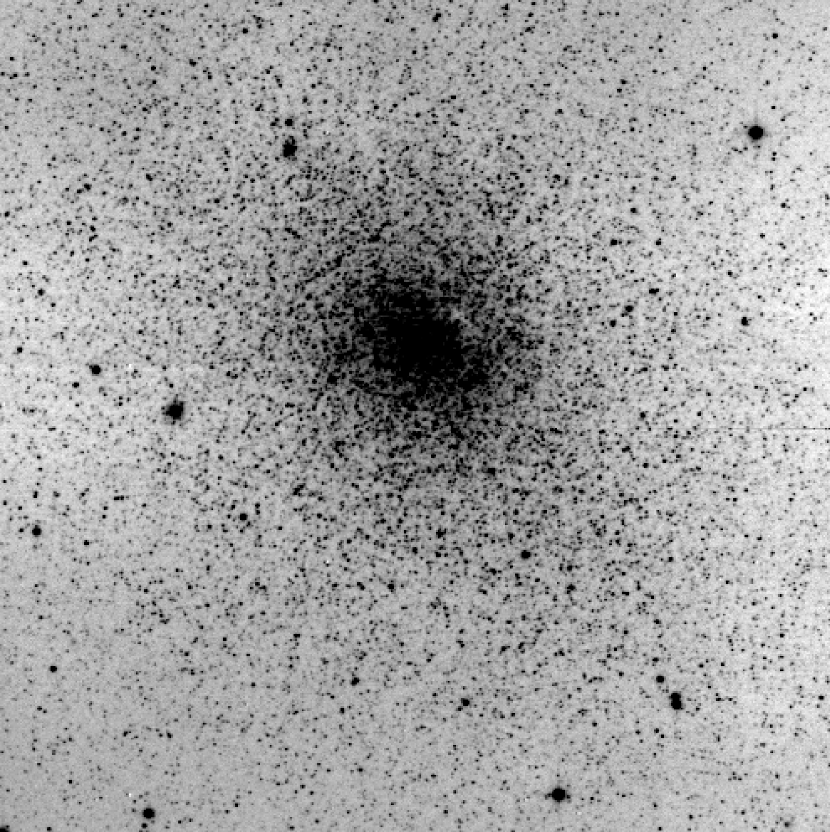
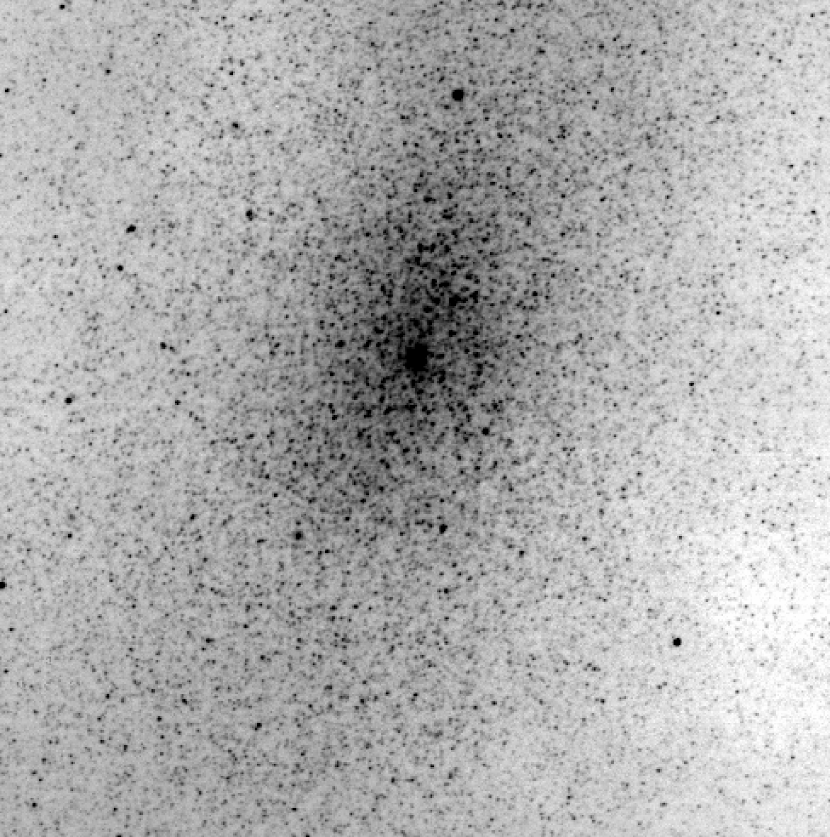
The data were reduced using a standard pipeline for near-infrared images. The basic steps in the processing sequence are: (1) the subtraction of a dark frame, (2) the division by a flat-field frame, (3) the subtraction of the DC sky level from each image, and (4) the subtraction of the appropriate interference fringe thermal emission calibration frame. The processed images for each field filter combination were aligned to correct for offsets introduced during acquisition, and then median combined. The final step was to remove those portions of the combined images that do not have the full exposure time. The final images of the galaxies are shown in Figures 1, 2, and 3. Single stars in the final images have FWHMs in the range 0.7 – 0.9 arcsec, depending on the galaxy.
3 PHOTOMETRIC MEASUREMENTS AND ARTIFICIAL STAR EXPERIMENTS
Stellar brightnesses were measured with the point spread function (PSF) fitting routine ALLSTAR (Stetson & Harris 1988). The co-ordinates, preliminary brightnesses, and PSFs that are used by ALLSTAR were obtained from routines in the DAOPHOT (Stetson 1987) photometry package. The PSFs for each image were constructed from at least 40 stars.
Standard stars from Hawarden et al. (2001) were observed during both the June 2001 and November 2002 runs, and these were used to define the photometric calibration. The consistency of the calibration was checked by comparing the brightnesses of stars with with measurements in the 2MASS Point Source Catalogue (Cutri et al. 2003). Sources within 1 arcmin of the centers of NGC 185 and NGC 205 were avoided when making these comparisons. The mean differences, in the sense CFHTIR – 2MASS are , and , where the quoted uncertainties are the standard deviations about the mean. The standard deviation is an upper limit to the actual dispersion due to photometric errors as some of the stars used in this comparison may be photometric variables. Nevertheless, it is clear that the photometric calibration is reliable to within a few hundredths of a magnitude.
Artificial star experiments were run to investigate sample completeness and the random uncertainties in the photometry due to crowding and photon noise. Both the degree of completeness and the errors in the photometry depend on the projected stellar density, in the sense that incompleteness sets in at progressively brighter levels, while the uncertainties in the photometry at a given magnitude become larger, as stellar density increases. To account for these effects in a basic way, the field imaged for each galaxy was divided into two equal area regions centered on the galaxy nucleus; the photometric properties of stars in the area that includes the center of each galaxy (the ‘inner’ region) are considered separately from those that are outside of this area (the ‘outer’ region). This division also permits gradients in stellar content to be investigated (§5).
The artificial stars were assigned colors that are representative of bright M giants and C stars, and were added in 0.5 magnitude increments in . Based on the CMDs that are discussed in §4, M giants were assumed to have and while C stars were assumed to have and . A total of sixty artificial stars of each type, evenly split between the inner and outer regions, were added to the images of each galaxy at each magnitude.
The standard deviations in the differences between the measured and actual values of , and for stars with , which is a brightness at which both M giants and C stars are seen in all three galaxies, are listed in Tables 2 (M giants) and 3 (C stars). The entries in Tables 2 and 3 indicate that the photometric errors predicted for the inner and outer regions of all three galaxies differ by only modest amounts. Moreover, the uncertainties in the NGC 205 measurements are larger than those for either NGC 147 and NGC 185, due to the higher stellar density in this galaxy. This complicates efforts to identify LPVs in NGC 205 (§6).
The relative uncertainties in brightnesses and colors in Tables 2 and 3 warrant discussion. The uncertainties in the colors of M giants in Table 2 are smaller than the uncertainties in the brightnesses. This is because the factors that affect brightness measurements, such as crowding, are to some extent panchromatic, and so at least partly cancel out when colors are computed. Indeed, the results in Table 2 illustrate why artificial star experiments should be run with stars having realistic colors; it is not correct to compute the uncertainties in colors simply by adding the uncertainties in the brightness measurements in quadrature, as systematic effects are not considered.
The situation appears to be different in Table 3, where the uncertainties in the colors of C stars tend to be larger than those in the measurements. However, the uncertainties in the colors of C stars are larger than the uncertainties in the colors of M giants because the former have redder colors, which makes them fainter in and at a given . As a result, the uncertainties in the and measurements are larger than those in , and so play a larger role in determining the uncertainties in the colors. Nevertheless, the uncertainties in the colors are still smaller than what would be computed simply by adding the uncertainties in the individual brightnesses in quadrature.
The artificial star experiments can also be used to assess the effects of blending, in which two or more stars fall within the same angular resolution element, and so appear as a single object. Given that the CFHTIR data sample the crowded central regions of these galaxies then all stars are likely blends, although in the vast majority of cases the bright stars that are the topic of this paper are blended with an object that is much fainter, so that the photometric measurements are essentially those of the brighter star. However, in the rare event that two AGB stars with comparable brightness fall in the same resolution element then the result will appear as a single source that is –2.5 log(2) magnitude brighter than the progenitors.
The histogram distribution of the difference between the actual and recovered band brightnesses of artificial stars representing M giants with , , is shown in Figure 4 for each galaxy. Obvious blends have positive values of , and so skew the distributions if they occur in large numbers. It is evident from Figure 4 that the distributions in the outer regions are symmetric about with no significant tail to positive values, suggesting that blending does not have a major impact on the photometric properties of stars with in these areas of the galaxies. While there are a handful of stars with in the inner regions, these account for only a modest fraction of the total number of objects, and the main body of data is still centered near K . The results shown in Figure 4 indicate that blending does not have a major impact on the photometric properties of stars with in these galaxies. The effects of blending will be even smaller when , but greater when .
4 COLOR-MAGNITUDE DIAGRAMS, LUMINOSITY FUNCTIONS, AND THE SELECTION OF C STARS
The , , and CMDs of the galaxies are shown in Figures 5, 6, and 7. The dominant feature in these CMDs is a plume that contains luminous oxygen-rich M giants that are evolving on the AGB. The AGB plume is almost vertical in the CMDs, and the sequence in the NGC 205 CMD is clearly broader than in the other galaxies. This is consistent with the artificial star experiments, which predict larger uncertainties in the photometric measurements of stars in NGC 205 at a given brightness (§3). The and CMDs show more structure than the CMDs, in the sense that the AGB broadens at the bright end, with a spray of stars extending to red colors.
The spray of bright objects to the right of the M giant sequence in the CMDs is due to C stars. In order to isolate a clean sample of C stars it is necessary to determine the color at which C stars dominate over M giants. Hughes & Wood (1991) investigated the near-infrared photometric properties of LPVs in the LMC, and concluded that stars with and are C stars. However, the majority of objects in the Hughes & Wood (1990) study have and , and the number of objects with is modest. In fact, significant numbers of spectrographically confirmed C stars in the LMC and SMC have colors as small as 0.6 (e.g. Demers, Dallaire, & Battinelli 2002). While the identification of such warm C stars from broad-band photometric data alone is problematic, Demers et al. (2002) find that the majority of C stars identified from narrow-band imaging and red broad-band photometry have , and advocate this as a criterion for near-infrared C star surveys. This color criterion is supported by other studies. Nikolaev & Weinberg (2000) identify a tongue of objects with that departs from the M giant sequence on the CMD of the LMC that is associated with C stars. Cioni & Habing (2005) identify a similar feature in the CMD of NGC 6822, which is also associated with a plateau in the color distribution when . Based on these results, it is assumed in the present study that stars with are C stars. The near-infrared two-color diagram for LMC LPVs constructed by Hughes & Wood (1990) indicates that this corresponds to .
A brightness limit for C stars can also be set. The C star features seen in the CMDs of the LMC (Nikolaev & Weinberg 2000) and NGC 6822 (Cioni & Habing 2005) have M. Consequently, M is adopted as the faint limit for C stars in the present study.
The color and brightness boundaries for identifying C stars are marked in Figures 6 and 7. The color boundary tracks the red edge of the M giant sequence in both the and CMDs, while a number of C stars are seen to the right of this boundary. It is worth noting that a C star sequence can be seen in the CMDs, although the C star sequence plunges rapidly downward towards red colors, and so is not as distinct as the C star sequences in the and CMDs. It is because the C star and M giant sequences are clearly separated on the and CMDs that these CMDs were adopted as the basis for the detailed analysis of AGB properties in the remainder of the paper.
The brightest stars in each CMD belong to the foreground disk, and these form a loose sequence with relatively blue colors. NGC 147 and NGC 185 are viewed at lower Galactic latitudes than NGC 205, and so it is not surprising that the CMDs of these galaxies contain a larger number of foreground stars than in NGC 205. In any event, contamination from foreground stars is likely not a major issue when investigating the bright AGB population of these galaxies. Indeed, the foreground star sequence tends to be bluer than the brightest M giants in all three galaxies, although there is some overlap, and the foreground and AGB sequences only merge near the faint end of the CMDs, where the errors in the photometry are large. As for the region of the CMDs containing C stars, there appears to be no obvious contamination from foreground stars.
While the number of foreground stars is modest, they may still skew efforts to study the brightest portions of the AGB. To assess the peak brightness of objects free of foreground star contamination, the LFs of M giants, computed from the CMDs and assuming that M giants have , were computed, and the results are compared in Figure 8. The LFs were corrected statistically for foreground star contamination by combining the number counts of objects with in the NGC 147 and NGC 185 fields, where the number of foreground stars is greatest, and then fitting a power-law to the counts as a function of magnitude. The power-law fit was then used to compute the number of foreground stars in each LF magnitude interval. A corresponding relation for NGC 205 was obtained by scaling the relation derived for NGC 147 and NGC 185 to match the number of bright foreground stars in NGC 205.
The LFs in Figure 8 have been normalized according to the number of stars with between 16.9 and 17.5 to facilitate galaxy-to-galaxy the comparisons. The LFs of M giants in NGC 185 and NGC 205 climb smoothly towards fainter magnitudes, with no obvious discontinuities. While the LFs of the outer regions of all three galaxies are in rough agreement, the inner regions of NGC 185 and NGC 205 clearly contain an excess number of stars with when compared with NGC 147, and this is due to differences in the peak AGB brightness. To quantify these differences, the peak brightness at which the number counts, corrected for foreground star contamination, differ from zero at the or higher level were computed, and the results are listed in the third column of Table 4. Important caveats are that the most evolved AGB stars (1) are undergoing rapid evolution, and so are relatively short-lived, and (2) can be photometric variables. Rapid evolution may cause the measured peak brightness to be underestimated, while there is a bias to identifying stars that are near the peak of their light curves as the brightest M giants, and this will act to overestimate the peak brightness. In addition, the peak brightnesses listed in Table 4 are for M giants, and in most regions there are brighter C stars; consequently, the measurements in Table 4 are not AGB-tip brightnesses.
5 COMPARING THE PROPERTIES OF M GIANTS AND C STARS
The and CMDs of the three galaxies, which form the basis for the subsequent analysis, are compared in Figures 9 and 10. The properties of M giants and C stars deduced from these data are discussed in the following sub-sections. The comparisons not only consider the overall appearance of the CMDs and LFs, but also examine the relative densities of M giants and C stars as a function of integrated near-infrared brightness.
5.1 M Giants
The M giant sequences on the CMDs show clear galaxy-to-galaxy differences. These differences are perhaps most apparent among the peak MK brightnesses, which are also listed in the last column of Table 4. The peak of the M giant sequence is brightest in the inner regions of NGC 205, and is faintest in NGC 147 and the outer regions of NGC 185.
The ages of the M giants can be estimated by making comparisons with isochrones. In Figures 9 and 10 the CFHTIR observations are compared with Z = 0.008 log(tyr) = 8.1, 9, and 10 isochrones from Girardi et al. (2002). Selecting a metallicity to compare with the observations is problematic, as there are no formal abundance estimates for the youngest stars in these galaxies. Nevertheless, Bica, Alloin, & Schmidt (1990) use population synthesis techniques to find that the majority of stars with ages Gyr in NGC 205 have [M/H] , while Butler & Martinez-Delgado (2005) find that the most metal-rich stars in this galaxy have [Fe/H] . Consequently, the Z = 0.008 models are adopted here to compare with the observations. The isochrones plotted in Figures 9 and 10 more-or-less bracket the range of M giant colors in each galaxy.
The M giants with the bluest colors are in the inner regions of NGC 205, and the isochrones suggest that these stars have an age log(t. For comparison, the brightest M giants in the inner regions of NGC 185 have an age log(t, while the youngest M giants in NGC 147, which appear not to be centrally concentrated, have an age log(t. Based on the peak M giant brightness, the outer regions of NGC 147 and NGC 185 have similar ages.
The range of ages in each galaxy can be compared by examing the color distributions of the M giants. The histogram distributions of colors for stars with MK between –7.6 and –7.2 in the inner and outer regions of each galaxy are shown in Figure 11. This brightness range was selected because (1) the artificial star experiments indicate that the sample is complete in each galaxy in this brightness interval, and (2) stars spanning the full range of ages will be present; while the photometric errors will be smaller for intrinsically brighter stars, only a more restricted range of ages, that excludes the oldest populations, will be present.
The artificial star experiments indicate that the random errors in the NGC 205 data in this brightness interval are larger than those in the other two galaxies, and this complicates efforts to compare the color distributions. To correct for this, the color distributions of NGC 147 and NGC 185 were convolved with a guassian to simulate their appearance as if they had the same random errors as in NGC 205. Another complication is that the galaxies have very different stellar densities. To compensate for this, the number of objects in each region have been scaled to match those expected from a system with M using the band surface brightness profile for each galaxy from the 2MASS Extended Source Catalogue (Jarrett et al. 2000). Figure 11 thus compares the ‘specific frequency’ of M giants per unit interval. The specific frequencies of M giants and C stars selected according to other brightness and color criteria are the subject of other comparisons in this paper.
The peak in the color distributions is due to M giants, and there is a red tail that extends past that is due to C stars. As is expected based on the comparison of the CMDs, there are marked differences between the color distributions of bright M giants in the inner regions of the three galaxies. NGC 185 and NGC 205 both contain a larger relative number density of stars with MK between –7.2 and –7.6 than in NGC 147. NGC 205 contains a population of blue stars not seen in either of the other galaxies, as expected if it contains the youngest M giants in the sample. The colors of Z=0.008 isochrones from Girardi et al. (2002) at M are shown near the top of each panel, and these indicate that NGC 185 and NGC 205 contain stars spanning a broad range of ages, with the youngest in NGC 205 having log(t.
The color distributions of stars in the outer regions of the galaxies are in much better agreement, although there is a blue population of giants in NGC 205 that is not seen in the outer regions of NGC 147 and NGC 185. The oldest M giants will have the reddest colors, and it is thus interesting that the specific frequencies of M giants in the outer regions of all three galaxies are in reasonable agreement when . In fact, the comparison in Figure 11 indicates that as one moves outside of the nuclear regions then there is improved galaxy-to-galaxy agreement among the relative densities of M giants with a given , suggesting greater similarities in the stellar contents. It is also worth noting that the relative densities of C stars in the lower panel of Figure 11 are in good agreement, and this point is investigated at greater length in §5.2 using a larger sample of C stars.
The bolometric luminosities of M giants provide another means of investigating the star-forming histories of these galaxies. band bolometric corrections, BCK, were computed from the relation between BCK and for Galactic and LMC AGB stars given by Bessell & Wood (1984), and these were then applied to the band brightnesses of stars with between 0.9 and 1.4. Bessell, Castelli, & Plez (1998) use synthetic spectra generated from model atmospheres to investigate the color sensitivity of BCK, and find that the empirical Bessell & Wood (1984) relation agrees with the models to within magnitude over a wide range of colors (e.g. Figure 20 of Bessell et al. 1998).
The bolometric LFs of M giants in the galaxies are compared in Figure 12. Foreground stars near the bright end of the M giant sequence were rejected based on their location on the CMD. The LFs for the outer regions in this figure have been scaled to match the number of stars that would be expected if the outer region had the same integrated brightness as the inner region, based on the band light profiles from the 2MASS Extended Source Catalogue (Jarrett et al. 2000).
The LFs of M giants in the inner and outer regions of NGC 147 are identical within their uncertainties, indicating that the M giant content of this galaxy is well mixed spatially, with no obvious centrally concentrated young population. The situation is very different in NGC 185 and NGC 205, where the LFs of M giants in the inner regions are flatter than in the outer regions, indicating that the inner regions of these galaxies contain a larger fraction of young AGB stars than the outer regions. There also may be a break in the LF of the inner region of NGC 205 between M and –6, which could be a signature of a discontinuity in the star-forming history. Such breaks in the star-forming history of NGC 205 might be expected if star formation is triggered by interactions with M31 (Davidge 2003).
The specific frequency of M giants is investigated further in Figure 13, where the bolometric LFs of the three galaxies have been scaled to match the counts expected in a system with M, based on the band surface brightness profile for each galaxy from the 2MASS Extended Source Catalogue (Jarrett et al. 2000). There is general agreement among the specific frequencies of M giants near the faint end; this is perhaps not unexpected since as one goes fainter then stars produced over a broader range of ages are sampled, with the result that stochastic noise introduced by recent star forming events is suppressed and the number counts more closely track mass.
Lee (1996) found that the bolometric LF of AGB stars in NGC 205 is flatter than that of NGC 185, and this is confirmed in Figure 13. The comparisons in Figure 13 also reveal similarities in stellar content at the bright end, as the specific frequencies of M giants in the outer regions of NGC 147 and NGC 185 at all brightnesses probed by these data are in excellent agreement. This agreement is consistent with the similarity in AGB peak brightness and the mean color of M giants in the outer regions of these galaxies, discussed earlier.
5.2 C Stars
The C star contents of the galaxies are compared in Figures 14 and 15, where the MK LFs of C stars, which are defined to be those objects with and M (§4), are shown. Following the procedure used for Figure 12, the outer region LFs in Figure 14 have been scaled to match the integrated brightness in the corresponding inner region so that radial trends in C star content can be investigated. The comparisons in Figure 14 suggest that the C stars in NGC 147 are uniformly distributed. On the other hand, the outer regions of NGC 185 and NGC 205 contain a higher number of C stars with M per unit band surface brightness than the inner regions. A similar trend can be seen in the mean MK values of C stars, which are shown in the second column of Table 5; the number of C stars upon which the means are based are listed in the third column of this table. The quoted uncertainties in the entries are standard errors of the mean. The ’s in the inner and outer regions of NGC 147 differ at slightly more than the level, whereas in NGC 185 and NGC 205 the difference between in the inner and outer regions is significant at the or higher level.
The values in the outer regions of NGC 147 and NGC 185 are in reasonable agreement, and so the specific frequency of C stars in the outer regions of these galaxies might also be expected to agree. The specific frequency of C stars per 0.5 band magnitude interval is investigated in Figure 15, where the number counts have been scaled to match those expected in a stellar system with M. Models predict that the brightest C stars will form in the youngest environments, and the comparisons in Figure 15 are consistent with this, as the number of C stars with M is higher in NGC 205 than in either NGC 185 and NGC 147. Whereas there are significant differences between the C star LFs in the upper panel of Figure 15, there is general agreement between the LFs of the outer regions in the lower panel of Figure 15, indicating that these galaxies have similar densities of C stars per unit band surface brightness outside of the nuclear regions.
The bolometric LFs of C stars have also been investigated. band bolometric corrections, BCK, were computed using the relation between BCK and for Galactic and LMC AGB stars from Bessell & Wood (1984), and the resulting bolometric LFs are compared in Figures 16 and 17. As in Figures 12 and 14, the outer region LFs in Figure 16 have been scaled to match the integrated band brightness in the inner regions to allow possible radial trends in each galaxy to be investigated. The specific frequency of C stars per bolometric magnitude is investigated in Figure 17 by normalizing the counts to those expected from a source with M.
There is excellent agreement between the inner and outer region LFs of NGC 147 in Figure 16, while there is clearly a difference between the LFs of the inner and outer regions of NGC 205. There is an obvious excess of C stars with M in the inner regions of NGC 205 with respect to the other galaxies, as expected if the inner region of NGC 205 contains a larger fraction of the youngest C stars than in the other galaxies. However, it is apparent from the lower panel of Figure 17 that there is good agreement between the outer region LFs. The comparison in the lower panel of Figure 17 indicates that the specific frequency of C stars with a given Mbol in the outer regions of these galaxies is remarkably similar, suggesting that these galaxies have evidently converted similar quantities of gas per unit integrated galaxy mass into stars during intermediate epochs.
The C star contents of these galaxies have also been compared using two statistics that use the integrated brightnesses of C stars. The first statistic relies on the fact that whereas luminous M giants are an ubiquitous signature of AGB evolution over a wide range of ages, the peak production of C stars is delayed until systems have ages near Gyr (e.g. Maraston 1998). Consequently, the ratio of light from C stars to that from bright M giants is a measure of the relative star forming histories during intermediate ( Gyr) and moderately recent ( Gyr) epochs.
The ratio of the total band light from C stars and M giants brighter than M, was computed for these galaxies, and the results are listed in the middle column of Table 5. The uncertainties in this quantity due to statistical flucuations in the numbers of stars is roughly . It is evident that varies within and between the galaxies, being lowest in the inner region of NGC 205, where the youngest stars in the three galaxies are located, and highest in NGC 147 and the outer region of NGC 185, where there is a lack of the very bright M giants seen in the nuclear regions of NGC 185 and NGC 205. Based on , it appears that the relative star-forming histories of the outer regions of NGC 147 and NGC 185 during intermediate and moderately recent epochs have been similar, in agreement with what would be inferred from previous comparisons.
The most recent episodes of star formation in galaxies like NGC 185 and NGC 205 likely involve only a modest fraction of the total galaxy mass, and so the integrated band light is expected to be dominated by much older populations. Consequently, the ratio of the total light from C stars to the total integrated light from a galaxy will provide insight into the star forming histories at intermediate and old epochs. To investigate such a dependence, the fraction of the total band light coming from C stars, , was computed using the surface brightness profile for each galaxy in the 2MASS Extended Source Catalogue, and the results are listed in the last column of Table 5. The estimated uncertainty in these entries, based on statistical flucuations in the number of C stars, is roughly .
It is evident from Table 5 that is roughly constant throughout these galaxies, with C stars contributing 2% of the total band light; the standard deviation about the mean value of is , in rough agreement with what is expected from the uncertainties in . The system-to-system agreement in the last column of Table 5 argues that the star-forming histories of NGC 147, NGC 185, and NGC 205 have likely been very similar when averaged over the time scales corresponding to peak C star production - i.e. over Gyrs.
6 STELLAR VARIABILITY IN NGC 185 & NGC 205
Based on studies of other systems, it can be anticipated that the majority of the brightest AGB stars in these galaxies will likely be LPVs. Indeed, the brightest AGB stars observed at any given time in a galaxy will almost certainly be LPVs near the peak of their light curves. NGC 185 and NGC 205 were both observed with the CFHTIR during an observing run in June 2001, and these data can be compared with the November 2002 observations to gain insight into variability among the brightest resolved stars.
Davidge & Rigaut (2004) used band observations of the brightest stars in M32 recorded on two epochs to investigate the nature of variable stars in that galaxy, and the procedures used in that study are employed here. The key parameter is the difference in magnitude between the two epochs, . The histogram distribution of contains information about the number of variables and the amplitude of their photometric variations.
The band brightnesses of stars in the June 2001 CFHTIR data were measured with the same procedures that were applied to the November 2002 data, and was computed by taking the difference between the two sets of brightnesses. The histogram distributions of for stars with MK between –7.5 and –8.0 in the inner regions of NGC 185 and NGC 205 are shown in Figure 18; the properties of variable stars in the outer regions of these galaxies were not investigated because of the small number of objects in the overlapping areas of the two datasets. The dotted lines in Figure 18 show the distributions that would be expected if there were no variable stars, based on the errors in the photometry determined from the artificial star experiments. The distribution in the inner regions of NGC 185 is markedly wider than the predicted photometric uncertainties, indicating that some fraction of the brightest AGB stars are variable. For comparison, the distribution for NGC 205 roughly matches the scatter due to random photometric errors. As demonstrated below, this does not mean that LPVs are abscent in NGC 205; however, the relatively large photometric errors obviously confound efforts to probe the LPV content of this galaxy.
Hughes & Wood (1990) investigated the light curves of luminous AGB variables in the LMC, and the photometric measurements presented in that study were used to construct a reference distribution for comparison with the NGC 185 and NGC 205 data. Following the procedure described by Davidge & Rigaut (2004), individual measurements from Hughes & Wood (1990) for LPVs observed in successive observing seasons were paired and was then computed for each pair; the pairing of points between successive seasons crudely replicates the time baseline between the two CFHTIR observing runs. Hughes & Wood (1990) group the LMC stars into large and small amplitude LPVs. However, the standard deviations in the values obtained from the entries in their Tables II and III are similar ( versus mag), and so the values for both groups of LPVs were combined to create a single reference distribution.
To simulate the effects of observational scatter, the reference distribution constructed from the LMC LPVs was convolved with a gaussian, the standard deviation of which matched the dispersion measured from the artificial star experiments. In addition, some fraction of bright AGB stars are not variable. To account for these objects, a population of non-variable sources, amounting to a fraction of the total number of stars, was modelled as a gaussian distribution with a standard deviation matching the scatter predicted from the artificial star experiments. Non-variable components spanning a range of values were added to the raw reference distributions to create a suite of reference distributions.
A best-fitting value of was found by comparing the observed and modelled distributions and finding the that minimizes the Kolomogorov-Smirnov Dmax statistic. The best-fitting models are compared with the observed distributions in Figure 18. The value of that gave the best match with the observations is listed in the upper left hand corner of each panel.
When applied to the NGC 185 data, the fitting procedure described above indicates that ( uncertainty). The agreement between the observed and modelled distribution in the upper panel of Figure 18 is not ideal. The poor agreement between the observed and modelled distributions when suggests that the LPVs in NGC 185 may have a smaller amplitude distribution than those in the LMC, although there is better agreement between the models and observations at positive values of . Models with will better match the NGC 185 distribution near , although at the expense of the fit at very negative values of . These problems notwithstanding, the value of computed for the inner regions of NGC 185 is consistent with what is seen in other galaxies, such as M32 (Davidge & Rigaut 2004) and NGC 5128 (Rejkuba et al. 2003).
The value of in NGC 205 is poorly constrained because of the large scatter in the photometric observations; the relatively large errors with respect to those seen in NGC 185 are a consequence of the greater distance and higher degree of crowding near the center of NGC 205. While the best fitting model has , other values of yield Dmax values that are not greatly different. Indeed, can not be ruled out at the significance level.
7 DISCUSSION & SUMMARY
Moderately deep and images have been used to study the brightest AGB stars near the centers of the Local Group dE galaxies NGC 147, NGC 185, and NGC 205. The data sample stars with M, and so are restricted to objects that are brighter than the RGB-tip. The main purpose of this investigation has been to compare the observational properties of the brightest oxygen-rich M giants and C stars in these galaxies, and the results are discussed below.
7.1 Comparisons with Previous Studies
The AGB contents of NGC 185 and NGC 205 have been investigated previously in the near-infrared. Davidge (2003) used CFHTIR data to investigate the bright AGB content near the center of NGC 205 and found 320 C stars, whereas in the present study 387 C stars have been identified. The difference in the number of C stars is because Davidge (2003) adopted a redder color to differentiate between M giants and C stars; consequently, fewer C stars were found. The difference in this color criterion also affects the C star LFs, as AGB stars with bluer colors will tend to have lower luminosities. As a result, the C star LFs of NGC 205 computed here tend to be flatter at the faint end than those constructed by Davidge (2003).
Kang et al. (2005) applied the techniques discussed by Davidge (2003) to identify C stars in near-infrared images of NGC 185. A total of 73 C stars with a mean brightness were identified. For comparison, 103 C stars have been identified in this galaxy in the present study. The difference in C star numbers is due to the color criterion used to identify C stars; Kang et al. (2005) adopt a redder color for distinguishing between M giants and C stars, and hence find fewer C stars.
The mean C star brightness measured in the current study is fainter than that measured by Kang et al. (2005), as the mean brightness of all C stars in the November 2002 dataset is , whereas Kang et al. (2005) find that . However, Kang et al. (2005) used a different distance modulus than that adopted here. Had Kang et al. (2005) also adopted the McConnachie et al. (2004) distance for NGC 185, then they would have found , in good agreement with what is computed here.
Kang et al. (2005) give the co-ordinates, brightnesses, and colors of C stars that were identified from their data, making it possible to conduct a star-by-star comparison of photometric properties. Using the November 2002 NGC 185 data, brightnesses and colors were obtained for 62 of the 73 C stars listed by Kang et al. (2005). The mean differences between the brightnesses and colors of the two sets of C star measurements are magnitudes, and magnitudes. The differences are in the sense Kang – Davidge, and the quoted uncertainies are the standard errors in the means.
There is considerable scatter in the measurements, and the standard deviation about the mean value is magnitudes. The majority of the C stars have , and a comparison with the entries in Table 3 indicate that the standard deviation in is at least three times that expected due to random photometric uncertainties alone. The large standard deviation in the measurements indicates that the majority of the C stars in NGC 185 are likely LPVs, as might be expected based on the comparisons in §6.
Comparisons can also be made with studies of the brightest AGB stars in these galaxies that are based on observations at wavelengths shortward of m. Consider the peak AGB luminosities. Davidge (1994) used and data to find that the AGB-tip in NGC 147 occurs near M, and this is in reasonable agreement with what is found from the CFHTIR data, where the most luminous star has M. Lee (1996) found that M in NGC 205 from and images, and noted that this is 0.7 mag brighter than in NGC 185. For comparison, the CFHTIR data indicate that M in NGC 205, and M in NGC 185. Lee (1996) found that the LF of oxygen-rich AGB stars in NGC 205 is flatter than that of oxygen-rich AGB stars in NGC 185, and this is in agreement with what is found from the CFHTIR data.
7.2 Comparing the Relative Frequencies of C Stars
The majority of previous studies of C stars in these galaxies have used broad- and narrow-band images recorded at wavelengths shortward of 1m. These studies tend to cover large areas, with the result that the C star contents are dominated by objects outside of the nuclear regions. While these studies show that the overall appearance of the band C star LFs of the three dEs are not greatly different, they also find a range in the ratio of C stars to M giants, C/M, that is suggestive of galaxy-to-galaxy differences in the relative density of C stars. Nowotny et al. (2003) find that C/M in NGC 185 is 58% that in NGC 147, and point out that this is contrary to what would be expected given that NGC 185 may be more metal-poor than NGC 147. For comparison, Battinelli & Demers (2004a,b) find that the C/M ratio in NGC 185 is 71% that in NGC 147, and derive absolute C/M ratios that are higher than in the Nowotny et al. (2003) study; in the case of NGC 185 the C/M ratio computed by Battinelli & Demers (2004b) is almost twice that measured by Nowotny et al. (2003). Perhaps most significantly, Demers et al. (2003) find that C/M in NGC 205 is 38% of that in NGC 147.
From a purely observational perspective, the C/M ratio is sensitive to the depth of the photometric measurements (e.g. Figure 14 of Brewer, Richer, & Crabtree 1995) and the method used to identify M giants (e.g. Battinelli & Demers 2005). Battinelli & Demers (2005) re-computed the C/M ratios of NGC 147, NGC 185, and NGC 205 in a homogeneous way using data from their earlier studies, and found that C/M in NGC 147, in NGC 185, and in NGC 205. While these new C/M ratios show better galaxy-to-galaxy agreement than those computed previously, they suggest the frequency of C stars, when normalized to the number of M giants, is not a constant in these galaxies.
Should the C star contents of the three dEs be similar if they have had similar star-forming histories? Models of the advanced stages of AGB evolution predict that the third dredge-up, which can bring an excess of C into the outer envelope of a star, occurs over a broader range of masses as metallicity decreases (e.g. Marigo, Girardi, & Bressan 1999); as a result, the number of C stars is expected to increase in systems with lower metallicities. There is empirical evidence to support this expectation, as it has long been known that the C star content of galaxies, as measured by the C/M ratio, depends on metallicity (e.g. Cook et al. 1986, Pritchet et al. 1987, and Battinelli & Demers 2005), in the sense that the relative number of C stars increases with decreasing metallicity. However, a complicating factor is that the impact of metallicity on the occurence of the third dredge-up is not the only factor that affects the C/M ratio, as the number of M giants also decreases as metallicity decreases.
The RGB sequences in NGC 147, NGC 185, and NGC 205 suggest that the old stars in these galaxies have metallicities that differ by at most a few tenths of a dex (§1). Adopting the [Fe/H] versus C/M relation in Figure 3 of Battinelli & Demers (2005), then a difference in 0.3 dex in [Fe/H] translates into a factor of 3 change in the C/M ratios. Given that at least part of this change in the C/M ratio is driven by a change in the number of M giants, then the C star densities in the three dE galaxies might be expected to differ by at most a factor of 3 if they have experienced similar star-forming histories.
The methods used here to compare C star contents rely on integrated quantities involving light from the entire galaxy and the AGB, and so are less sensitive to metallicity effects. That being said, the criterion that is employed here to identify C stars will likely select most of the objects that would be identified in broad and narrow-band photometric surveys at wavelengths shortward of m (Figure 7 of Demers et al. 2002). The statistic defined in this study to compare the relative C star densities that is most closely related to C/M is , which is the fraction of band light from the bright portions of the AGB that comes from C stars. The entries in Table 5 suggest that this statistic tracks the C/M ratio measurements made by Battinelli & Demers (2005) in the sense that is highest in NGC 147 and lowest in NGC 205.
Other methods have been defined here to measure the relative density of C stars, and these suggest that the three dE companions of M31 have similar C star densities outside of their nuclear regions. The fraction of the integrated band light that originates from C stars, f, has been computed, and there is only modest galaxy-to-galaxy dispersion in this quantity, which is comparable to that expected from measurement errors alone. The specific frequency of C stars, where published band surface brightness measurements are used to compute the relative numbers of C stars per brightness interval normalized to an integrated brightness M, indicates that there is excellent galaxy-to-galaxy agreement in the C star contents of these galaxies outside of their nuclear regions. Indeed, the comparisons in the lower panel of Figure 17 indicate that the specific frequencies of C stars in the main bodies of NGC 147, NGC 185, and NGC 205 agree to well within a factor of 2.
7.3 The Source of Star-Forming Material During Intermediate Epochs
The galaxy-to-galaxy agreement between the specific frequencies of C stars suggests that the star formation rates in the three galaxies, when normalized to the total galaxy masses, have been comparable over time scales of a few Gyr. This has implications for how star formation proceeds in these galaxies, and the source of the gas and dust from which stars form; that all three galaxies turned the same fractional amount of gas into stars during intermediate epochs suggests that (1) similar processes regulate star formation in these systems, and/or (2) the gas that fueled star formation originated in carefully regulated reservoirs.
The three dEs do not contain large reservoirs of star forming material at the present day (§1). However, modest amounts of material to fuel star formation can be supplied by low and intermediate mass stars during the advanced phases of their evolution, and this mechanism could provide a supply of star forming material that scales with galaxy mass. However, can mass loss from evolved low and intermediate mass stars provide enough gas to explain the mass of stars that evidently formed in the dEs during intermediate epochs? To answer this question we consider NGC 185 as an example, and start by estimating the mass of intermediate age stars in that galaxy.
A lower limit to the mass of intermediate age stars in NGC 185 is estimated in two ways. The first approach considers the mass of the young nucleus in NGC 185. The band surface brightness profile of NGC 185 (Jarrett et al. 2000) indicates that the central cusp has M. Butler & Martinez Delgado (2005) find that the cusp has an age year. The Leitherer et al. (1999) models with a Salpeter mass function predict that a simple stellar system with this age and integrated brightness has a mass M⊙. The presence of faint C stars indicates that there has been at least one other episode of star formation in the galaxy during intermediate epochs. Assuming that a similar amount of gas was turned into stars then the total mass of stars formed over the past few Gyr is at least Modot. Assuming a star forming efficiency of 10%, then the mass of gas required is at least M⊙.
A second lower limit to the size of the intermediate age population in NGC 185 can be estimated from the properties of the observed AGB stars. Stars evolving on the AGB make the maximum contribution to the integrated light from a moderately metal-poor simple stellar system when log(t) (Maraston 1998); hence, a lower limit to the mass of stars that formed during intermediate epochs can be obtained by assuming that the AGB stars have an age of 1 Gyr. With 4% of the light coming from AGB stars brighter than (Table 5), then the results shown in Figure 11 of Maraston (1998) predict that stars that formed during intermediate epochs in NGC 185 account for at least 2.5% of the total galaxy mass, assuming that the intermediate-age population has a mass-to-light ratio in the band that is 0.5 that of older populations (e.g. Leitherer et al. 1999). With an integrated brightness M (Jarrett et al. 2000) and an assumed band M/L ratio of , then NGC 185 has a total mass of . The mass of stars that formed during intermediate epochs is then at least . Assuming a 10% star-forming efficiency, then the mass of gas required to form these stars is at least , in fortuitous agreement with the lower limit computed in the previous paragraph.
The amount of mass that is injected into the ISM by evolved stars is very uncertain, and two estimates are considered here. Gallagher & Hunter (1981) conclude that star formation in NGC 185 is fueled by mass from evolved stars, and derive a mass return rate of year-1 for NGC 185. For comparison, assuming that the majority of gas from evolved stars is ejected into the ISM by planetary nebulae, Welch et al. (1996) compute a mass return rate of year-1 for NGC 185. Adopting these two estimates as upper and lower limits, then the amount of gas that will be returned into the ISM in NGC 185 by low and intermediate mass stars over 10 Gyr is . The upper limit of this range is a factor of lower than the minimum amount of gas needed to explain the mass of intermediate age stars computed above. However, given that Gallagher & Hunter (1981) estimate a factor of 2 uncertainty in their mass return rates then the hypothesis that the stars formed in these galaxies during intermediate epochs did so from gas returned to the ISM by evolved stars can not be rejected at present. Extremely deep imaging studies in the disk of the dEs that reach the main sequence turn-off will help establish the age of the intermediate age population and the relative mass of this component with respect to the main body of stars. This information will allow for a more rigorous test of the source of star-forming material.
7.4 Where Did Intermediate Age Stars in NGC 147, NGC 185, and NGC 205 Form?
In §5 it was demonstrated that the specific frequency of M giants and C stars outside of the central 1 arcmin of the three dEs are in good agreement; aside from the obvious central concentrations of moderately young stars near the centers of NGC 185 and NGC 205, the AGB contents of these galaxies appear to be smoothly distributed out to radii of at least a few arcminutes. There have been multiple episodes of nuclear star formation in NGC 205, and the time between star forming episodes is consistent with the orbital period around M31 (Davidge 2003). Consequently, it is reasonable to anticipate that tidal interactions trigger the collapse of gas into the central regions of this galaxy, where stars then form.
If star formation occurs near the centers of the dEs then the nuclear star clusters must be disrupted on time scales of Gyr, in order for the progenitors of the C stars to be distributed to larger radii. However, in order to be disrupted on this time scale then processes other than normal dynamical evolution must be in play. This can be demonstrated using NGC 185 as an example. The majority of the youngest stars and star-forming material in NGC 185 are located in a region that is roughly parsecs across. The velocity dispersion in this part of the galaxy is km/sec (Held et al. 1992), and so the crossing time in the star-forming region is years. If the young cluster contains stars then Equation 8-1 of Binney & Tremaine (1987) indicates that the relaxation time is years. If clusters typically survive for relaxation times (e.g. Kim, Morris, & Lee 1999), then the evaporation time for the central cluster is years. Thus, stars that formed in the NGC 185 nuclear cluster will not be distributed into the main body of NGC 185 via simple dynamical evolution. If the majority of stars that formed in NGC 185 during the past few Gyr did so in the nucleus, then some other process must be involked to hasten their distribution to larger radii.
Interactions with M31 are one plausible mechanism for mixing the stellar contents of these galaxies. Indeed, there are indications that NGC 205, M32, and M31 have interacted at some point in the past (Cepa & Beckman 1988; Ibata et al. 2001; Choi et al. 2002; McConnachie et al. 2004). However, van den Bergh (1998) argues that NGC 147 and NGC 185 are a gravitationally bound pair, and that they thus likely do not have plunging orbits that bring them close to M31, as the binary system would then be disrupted. Battinelli & Demers (2004b) point out that there is no evidence for a tidal bridge between these galaxies, and that the separation assumed by van den Bergh (1998) may be underestimated. Indeed, the adopted distances for these galaxies listed in Table 1 indicate that they are separated by more than 40 kpc, whereas the projected separation discussed by van den Bergh (1998) is 10 kpc. Therefore, the orbits of NGC 147 and NGC 185 may bring them close enough to M31 to spur star formation.
| NGC | E(B–V)aaFrom Schlegel et al. (1998) | bbFrom McConnachie et al. (2004) | RM31 |
|---|---|---|---|
| (kpc) | |||
| 147 | 0.18 | 24.15 | 144.9 |
| 185 | 0.18 | 23.95 | 188.5 |
| 205 | 0.06 | 24.58 | 41.7 |
| NGC | ||||
|---|---|---|---|---|
| 147 | Inner | |||
| Outer | ||||
| 185 | Inner | |||
| Outer | ||||
| 205 | Inner | |||
| Outer |
| NGC | ||||
|---|---|---|---|---|
| 147 | Inner | |||
| Outer | ||||
| 185 | Inner | |||
| Outer | ||||
| 205 | Inner | |||
| Outer |
| NGC | M | ||
|---|---|---|---|
| 147 | Inner | 16.6 | –7.6 |
| Outer | 16.4 | –7.8 | |
| 185 | Inner | 15.8 | –8.2 |
| Outer | 16.4 | –7.6 | |
| 205 | Inner | 15.6 | –9.0 |
| Outer | 16.2 | –8.4 |
| Galaxy | aaMean C star brightness. | nCbbNumber of C stars. | ccFractional band contribution made by C stars to the total AGB flux. The uncertainty in this quantity based on statistical flucuations in the number of stars is roughly . | ddFractional band contribution made by C stars to the integrated galaxy light. The uncertainty in this quantity based on statistical flucuations in the number of C stars is roughly . |
|---|---|---|---|---|
| NGC 147 | ||||
| Inner | 41 | 0.49 | 0.018 | |
| Outer | 24 | 0.43 | 0.020 | |
| NGC 185 | ||||
| Inner | 74 | 0.30 | 0.022 | |
| Outer | 29 | 0.43 | 0.018 | |
| NGC 205 | ||||
| Inner | 243 | 0.25 | 0.029 | |
| Outer | 144 | 0.30 | 0.025 |
References
- (1)
- (2) Battinelli, P., & Demers, S. 2004a, A&A, 418, 33
- (3)
- (4) Battinelli, P., & Demers, S. 2004b, A&A, 417, 479
- (5)
- (6) Battinelli, P., & Demers, S. 2005, A&A, 434, 657
- (7)
- (8) Bekki, K., & Chiba, M. 2004, A&A, 417, 437
- (9)
- (10) Bekki, K., & Freeman, K. C. 2003, MNRAS, 346, L11
- (11)
- (12) Bessell, M. S., & Wood, P. R. 1984, PASP, 96, 247
- (13)
- (14) Bessell, M. S., Castelli, F., & Plez, B. 1998, A&A, 333, 231
- (15)
- (16) Bica, E., Alloin, D., & Schmidt, A. A. 1990, A&A, 228, 23
- (17)
- (18) Binney, J., & Tremaine, S. 1987, Galactic Dynamics, (Princeton University Press: Princeton)
- (19)
- (20) Butler, D. J., & Martinez-Delgado, D. 2005, AJ, 129, 2217
- (21)
- (22) Cappellari, M., Bertola, F., Burstein, D., Buson, L. M., Greggio, L., Renzini, A. 1999, ApJ, 515, L17
- (23)
- (24) Carraro, G., Chiosi, C., Girardi, L., & Lia, C. 2001, MNRAS, 327, 69
- (25)
- (26) Cepa, J., & Beckman, J. E. 1988, A&A, 200, 21
- (27)
- (28) Choi, P. I., Guhathakurta, P., & Johnston, K. V. 2002, AJ, 124, 310
- (29)
- (30) Cioni, M.-R. L., & Habing, H. J. 2005, A&A, 429, 837
- (31)
- (32) Cohen, J. G., Frogel, J. A., Persson, S. E., & Elias, J. H. 1981, ApJ, 249, 481
- (33)
- (34) Cook, K. H., Aaronson, M., & Norris, J. 1986, ApJ, 305, 634
- (35)
- (36) Courteau, S., & van den Bergh, S. 1999, AJ, 118, 337
- (37)
- (38) Cote, S., Carignan, C., & Freeman, K. C. 2000, AJ, 120, 3027
- (39)
- (40) Cutri, R. M. et al. 2003, 2MASS All-Sky Catalogue of Point Sources (Amherst: Univ. of Massachusetts Press; Pasadena: IPAC)
- (41)
- (42) Davidge, T. J. 1990, AJ, 99, 561
- (43)
- (44) Davidge, T. J. 1992, ApJ, 397, 457
- (45)
- (46) Davidge, T. J. 1994, AJ, 108, 2123
- (47)
- (48) Davidge, T. J. 2003, ApJ, 597, 289
- (49)
- (50) Davidge, T. J., & Rigaut, F. 2004, ApJ, 607, L25
- (51)
- (52) Demers, S., Battinelli, P., & Letarte, B. 2003, AJ, 125, 3037
- (53)
- (54) Demers, S., Dallaire, M., & Battinelli, P. 2002, AJ, 123, 3428
- (55)
- (56) Evans, N. W., Wilkinson, M. I., Guhathakurta, P., Grebel, E. K., & Vogt, S. S. 2000, ApJ, 540, L9
- (57)
- (58) Ferrara, A., & Tolstoy, E. 2000, MNRAS, 313, 291
- (59)
- (60) Frogel, J. A., Persson, S. E., Aaronson, M., & Matthews, K. 1978, ApJ, 220, 75
- (61)
- (62) Gallagher, J. S., & Hunter, D. A. 1981, AJ, 86, 1312
- (63)
- (64) Geha, M., Guhathakurta, P., & van der Marel, R. P. 2002, AJ, 124, 3073
- (65)
- (66) Girardi, L., Bertelli, G., Bressan, A., Chiosi, C., Groenewegen, M. A. T., Marigo, P., Salsnich, B., & Weiss, A. 2002, A&A, 391, 195
- (67)
- (68) Graham, A. W. 2002, ApJ, 568, L13
- (69)
- (70) Han, M., Hoessel, J. G., Gallagher, J. S. III, Holtsman, J., & Stetson, P. B. 1997, AJ, 113, 1001
- (71)
- (72) Hawarden, T. G., Leggett, S. K., Letawsky, M. B., Ballantyne, D. R., & Casali, M. M. 2001, MNRAS, 325, 563
- (73)
- (74) Held, E. V., de Zeeuw, T., Mould, J., & Picard, A. 1992, AJ, 103, 851
- (75)
- (76) Hughes, S. M. G., & Wood, P. R. 1990, AJ, 99, 784
- (77)
- (78) Ibata, R., Irwin, M., Lewis, G., Ferguson, A. M. N., & Tanvir, N. 2001, Nature, 412, 49
- (79)
- (80) Irwin, M., & Hatzidimitriou, D. 1995, MNRAS, 277, 1354
- (81)
- (82) Jarrett, T. H., Chester, T., Cutri, R., Schneider, S., Skrutskie, M., & Huchra, J. P. 2000, AJ, 119, 2498
- (83)
- (84) Kang, A., Sohn, Y-J, Rhee, J., Shin, M., Chun, M-S, & Kim, H-I 2005, A&A, 437, 61
- (85)
- (86) Karachentsev, I. D., et al. 2001, A&A, 375, 359
- (87)
- (88) Kim, S. S., Morris, M., & Lee, H. M. 1999, ApJ, 525, 228
- (89)
- (90) Kleyna, J., Wilkinson, M. I., Evans, N. W., Gilmore, G., & Frayn, C. 2002, MNRAS, 330, 792
- (91)
- (92) Lee, M. G. 1996, AJ, 112, 1438
- (93)
- (94) Lee, M. G., Freedman, W. L., & Madore, B. F. 1993, AJ, 106, 964
- (95)
- (96) Leitherer, C. et al. 1999, ApJS, 123, 3
- (97)
- (98) Maraston, C. 1998, MNRAS, 300, 872
- (99)
- (100) Marigo, P., Girardi, L., & Bressan, A. 1999, A&A, 344, 123
- (101)
- (102) Martinez-Delgado, D., & Aparicio, A. 1998, AJ, 115, 1462
- (103)
- (104) Martinez-Delgado, D., Aparicio, A., & Gallart, C. 1999, AJ, 118, 2229
- (105)
- (106) Mateo, M. 1998, ARA&A, 36, 435
- (107)
- (108) Mayer, L. et al. 2001, ApJ, 559, 754
- (109)
- (110) McConnachie, A. W., Irwin, M. J., Ferguson, A. M. N., Ibata, R. A., Lewis, G. F., & Tanvir, N. 2005, MNRAS, 356, 979
- (111)
- (112) McConnachie, A. W., Irwin, M. J., Lewis, G. F., Ibata, R. A., Chapman, S. C., Ferguson, A. M. N., & Tanvir, N. R. 2004, MNRAS, 351, L94
- (113)
- (114) Mizutani, A., Chiba, M., & Sakamoto, T. 2003, ApJ, 589, L89
- (115)
- (116) Moore, B., Lake, G., & Katz, N. 1998, ApJ, 495, 139
- (117)
- (118) Mould, J. R., Kristian, J., & Da Costa, G. S. 1983, ApJ, 270, 471
- (119)
- (120) Mould, J. R., Kristian, J., & Da Costa, G. S. 1984, ApJ, 278, 575
- (121)
- (122) Nikolaev, S., & Weinberg, M. D. 2000, ApJ, 542, 804
- (123)
- (124) Nowotny, W., Kerschbaum, F., Olofsson, H., & Schwarz, H. E. 2003, A&A, 403, 93
- (125)
- (126) Pritchet, C. J., Richer, H. B., Schade, D., Crabtree, D., & Yee, H. K. C. 1987, ApJ, 323, 79
- (127)
- (128) Rejkuba, M., Minniti, D., Silva, D. R., & Bedding, T. R. 2003, A&A, 411, 351
- (129)
- (130) Richer, H. B., Crabtree, D. R., & Pritchet, C. J. 1984, ApJ, 287, 138
- (131)
- (132) Sage, L. J., Welch, G. A., & Mitchell, G. F. 1998, ApJ, 507, 726
- (133)
- (134) Schlegel, D, J., Finkbeiner, D. P., & Davis, M. 1998, ApJ, 500, 525
- (135)
- (136) Stetson, P. B. 1987, PASP, 99, 191
- (137)
- (138) Stetson, P. B., & Harris, W. E. 1988, AJ, 96, 909
- (139)
- (140) Thilker, D. A., Braun, R., Walterbos, R. A. M., Corbelli, E., Lockman, F. J., Murphy, E., & Maddalena, R. 2004, ApJ, 601, L39
- (141)
- (142) Welch, G. A., Mitchell, G. F., & Yi, S. 1996, ApJ, 470, 781
- (143)
- (144) Wood, P. R. 1998, A&A, 338, 592
- (145)
- (146) Wood, P. R., Whiteoak, J. B., Hughes, S. M. G., Bessell, M. S., Gardner, F. F., & Hyland, A. R. 1992, ApJ, 397, 552
- (147)
- (148) Young, L. M. 2001, AJ, 122, 1747
- (149)
- (150) Young, L. M., & Lo, K. Y. 1997, ApJ, 476, 127
- (151)
- (152) Yun, M. S., Ho, P. T. P., & Lo, K. Y. 1994, Nature, 372, 530
- (153)
- (154) Zinnecker, H., & Cannon, R. D. 1986 in Star-Forming Dwarf Galaxies, ed. D. Kunth, T. X. Thuan, & J. tran Thanh Van (Gif-sur-Yvette: Editions Frontieres), 155
- (155)