Double barred galaxies at intermediate redshifts:
A feasibility study
Abstract
Despite the increasing number of studies of barred galaxies at intermediate and high redshifts, double-barred (S2B) systems have only been identified in the nearby () universe thus far. In this feasibility study we demonstrate that the detection and analysis of S2Bs is possible at intermediate redshifts () with the exquisite resolution of the Hubble Space Telescope Advanced Camera for Surveys (HST/ACS). We identify barred galaxies in the HST/ACS data of the Great Observatories Origins Deep Survey (GOODS) using a novel method. The radial profile of the Gini coefficient – a model-independent structure parameter – is able to detect bars in early-type galaxies that are large enough that they might host an inner bar of sufficient angular size. Using this method and subsequent examination with unsharp masks and ellipse fits we identified the two most distant S2Bs currently known (at redshifts and ). We investigate the underlying stellar populations of these two galaxies through a detailed colour analysis, in order to demonstrate the analysis that could be performed on a future sample of intermediate-redshift S2Bs. We also identify two S2Bs and five S2B candidates in the HST/ACS data of the Cosmic Evolution Survey (COSMOS). Our detections of distant S2Bs show that deep surveys like GOODS and COSMOS have the potential to push the limit for S2B detection and analysis out by a factor of ten in redshift and look-back time (, ) compared to the previously known S2Bs. This in turn would provide new insight into the formation of these objects.
keywords:
galaxies: evolution – galaxies: high-redshift – galaxies: photometry – galaxies: stellar content – galaxies: structure – methods: data analysis1 Introduction and motivation
The high redshift universe allows us to probe galaxy evolution directly, by presenting us with examples of galaxies at a fraction of the age of the universe. The resolution needed to study these objects is possible either with ground-based adaptive optics or with the Hubble Space Telescope (HST). Using such observations, disk galaxies have been detected up to redshift , when the universe was not even half of its present age. How do the properties of these galaxies compare with those of local disks? Lilly et al. (1998) showed that the scale-lengths of the disks were similar to those of local galaxies. Likewise, bulges at are found to have had a small amount of luminosity evolution and no significant size evolution (Glassman et al., 2002), although Simard et al. (1999) found a population of galaxies which have higher bulge surface brightness than the local galaxies.
Morphologies of high-redshift galaxies also have been studied and compared with those of local galaxies. The most prominent morphological feature of a large fraction of local galaxies is a bar (Sellwood & Wilkinson, 1993; Eskridge et al., 2000; Knapen et al., 2000). Since these can drive very strong secular evolution (e.g. Lynden-Bell & Kalnajs, 1972; Debattista et al., 2006), knowing how common they are at high is important for constraining disk evolution. Using a sample of 46 galaxies observed in the Hubble Deep Field, Abraham et al. (1999) concluded that the fraction of barred galaxies was at but decreased sharply from there to . This result subsequently turned out to be an artifact of the still limited resolution of the Wide Field Planetary Camera 2 (WFPC2), and several groups have now found a nearly constant barred fraction out to using the higher resolution made possible by ACS (Elmegreen et al., 2004; Jogee et al., 2004). Other disk structures which have been identified at high redshift include truncations at (Pérez, 2004; Trujillo & Pohlen, 2005) and warps (Reshetnikov et al., 2002).
Double-barred (S2B) galaxies, in which a small ’secondary’ bar is nested inside a larger ’primary’ bar, have instead been identified only out to thus far (Erwin, 2004). Indeed, the S2B catalog of Erwin (2004) contains only two galaxies (out of 50) at a distance of more than and none further than . S2Bs, which were first described by de Vaucouleurs (1975), have been postulated to be a mechanism for driving gas past the inner Lindblad resonance of primary bars to feed the supermassive black holes (SMBHs) that power active galactic nuclei (Shlosman et al., 1990). Despite the possibility of their playing such an important role in SMBH nurture, understanding them has progressed significantly only in recent years. Secondary bars have been sought in gas-poor early-type barred galaxies with high resolution HST imaging in order to distinguish secondary bars from other nuclear structures such as disks, rings, spirals and dust extinction (Erwin & Sparke, 1999, 2002). We now know that secondary bars are unambiguously found in about of early-type barred galaxies. Moreover, we finally have direct observational proof for a kinematic decoupling between the primary and secondary bars in one S2B galaxy, NGC 2950 (Corsini et al., 2003). Such decoupling is necessary, but not sufficient, for secondary bars to funnel gas inwards. On the theoretical side, important progress has come from the development by Maciejewski & Sparke (1997, 2000) of the orbit formalism necessary for understanding their dynamics. Finally, simulators have started to produce gas-free S2B systems in their simulations (Rautiainen et al., 2002). The secondary bars in these simulations rotated faster than the primary bars and survived for several gigayears, properties which favor SMBH fueling.
Observing S2Bs at significantly earlier epochs would allow us to compare them with local S2Bs and would thus provide new insight into the formation and evolution of these objects. Because of their small scales, their dynamical timescales may be quite short ( Myr). However, this does not necessarily imply a short lifetime: since as many as of early-type barred galaxies harbor secondary bars (e.g. Erwin & Sparke, 2002; Laine et al., 2002), it appears very unlikely that nuclear bars are destroyed and regenerated repeatedly in these nearly gas-free systems. Instead, they probably have been in place a long time. It is thus worthwhile to investigate whether the relative properties of the secondary and primary bars show any evidence for evolution. A comparison of the stellar populations of inner and outer bar would be one way to address this issue. If the stellar populations of secondary bars are systematically younger than those of the corresponding primary bars, this would support the hypothesis that nuclear bars form out of gas driven in by the primary bar (Shlosman et al., 1989). If instead the secondary bars consisted of older stellar populations than the primary bars, this would make this scenario implausible.
Given that the difference between the optical properties of two stellar populations decreases rapidly with age (e.g. Bruzual & Charlot, 2003), it would be desirable to observe S2B galaxies at larger look-back times. Moreover, a large enough sample of S2Bs at higher redshifts would reveal a possible evolution of the ratios of secondary-to-primary sizes. If inner bars lose angular momentum to the outer bar, they might grow larger in radius, leading to a larger ratio as time goes on.
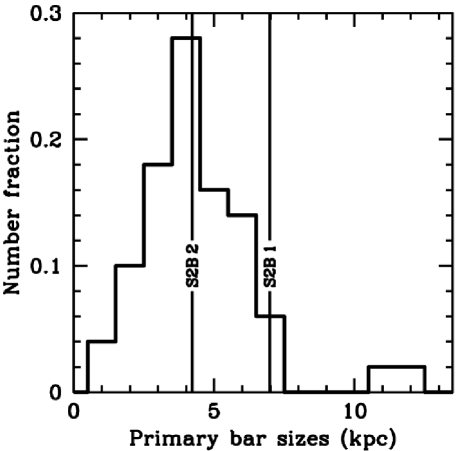
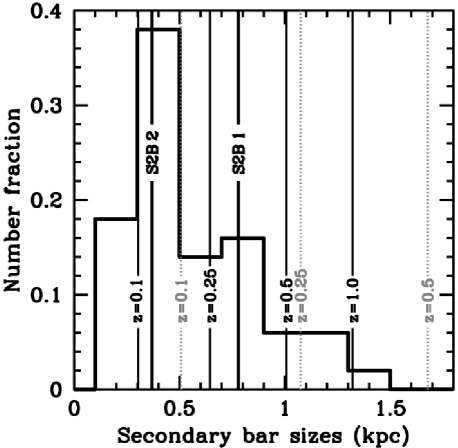
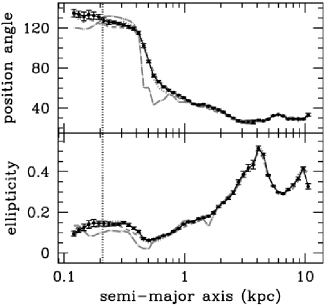
While such questions motivate the search for and study of S2Bs beyond the nearby universe, it is not yet clear whether such a study would be at all possible with present-day instrumentation. Therefore, as a first step, it is necessary to perform a feasibility study, i.e. to show that a) S2Bs can be found at significantly larger look-back times than known to date, and b) the stellar populations of primary and secondary bars can be analyzed and distinguished. An estimate of the limiting redshift for detecting inner bars with the HST Advanced Camera for Surveys (ACS) is provided by Sheth et al. (2003), who give a lower limit for a bar semi-major axis of times the point-spread function (PSF) full-width at half-maximum (FWHM). Adopting PSF FWHM and the concordance cosmology ( km s-1 Mpc-1 and , which we assume throughout), the resolution of the HST/ACS would be sufficient to identify inner bars out to provided that their sizes are similar to those of local nuclear bars from Erwin (2004). This limit is illustrated in the bottom panel of Fig. 1 by the dotted vertical lines, and is significantly larger than the redshifts of known S2B systems, .
Motivated by the foregoing estimate, we present a feasibility study for detecting and analyzing double-barred galaxies at intermediate redshifts, including our identification of the two most distant S2Bs known so far. In Section 2 we describe briefly the publicly available data used in this study. Section 3 explains how the objects were found, including a novel technique for identifying bars. A structural analysis of primary and secondary bars is presented in Section 4, followed by a colour and stellar population analysis in Section 5. Several (candidate-)S2Bs in the Cosmic Evolution Survey (COSMOS) are presented in Section 6, and a final discussion is presented in Section 7.
2 The data
The HST/ACS images of the Great Observatories Origins Deep Survey (GOODS) release v1.0 (Giavalisco et al., 2004) cover an area of 300 arcmin2 divided into two fields: the Hubble Deep Field North (HDFN) and the Chandra Deep Field South (CDFS). They consist of four deep images through the F435W (), F606W (), F775W (), and F850LP () passbands of ACS. The CDFS is divided into 18 sections and the HDFN into 17 sections with the images drizzled with a pixel scale of mas, chosen to optimize the sampling of the PSF. The images are not perfectly background subtracted: there is a remaining background of the order of one third of the noise RMS, which can vary by up to a factor of two across the image. Since this can contaminate measurements of colour and morphological parameters, we subtracted an individual background flux value for each object and band. We defined this background as the median pixel value within a box of centered on the galaxy, after masking all sources.
3 Object selection: Gini profiles
Despite the common use of ellipse fits for bar identification, their limitations are well known (e.g. Erwin & Sparke, 2003) and mainly originate from the fact that ellipse fits assume a definite (namely elliptical) isophotal shape of the object in question, which might not be the case in reality. Motivated by the successful application of model-independent structural parameters such as asymmetry or concentration to galaxy morphology (e.g. Abraham et al., 2003; Conselice, 2003), we sought a bar identification method that would rely solely on such parameters and would therefore provide a computationally quick and easy way to detect bars.
Given the usual difficulties in reliably identifying nuclear structures in late-type galaxies because of the significant amount of patchy obscuration that could mimic bar-like central shapes, we restricted our study to early-type galaxies, i.e. E/S0 galaxies as well as early-type spirals. We did this by selecting objects with central concentration values (cf. Fig. 11 of Lotz et al., 2004), where and is the radius enclosing of the total flux (Bershady et al., 2000). The total flux was measured in the -band within a circular aperture of the Petrosian radius, (Petrosian, 1976), where is given by
| (1) |
and is the surface brightness. We set cutoffs at apparent magnitude and half-light radius pixels to ensure that the objects were bright and large enough for identification of an inner bar. These criteria yielded a working sample of 231 objects in the GOODS dataset.
To detect large bars with major axis exceeding of the size of the galaxy, we computed model-independent radial profiles of structural parameters in circular apertures ranging from to on the -band images. We focus on large bars for two reasons: first, the bar needs to stand out in the radial structure profile, hence requiring its size to be a significant fraction of the galaxy radius, and second, small bars are less promising candidates for hosting nuclear bars that are large enough to be detected.
One structure parameter – the Gini coefficient, (Gini, 1912; Abraham et al., 2003) – proved to be a useful diagnostic for large bars. We calculate following the definition of Lotz et al. (2004),
| (2) |
where is the number of pixels in the image and is the flux and . As discussed by Lotz et al. (2004), the absolute values of are required in order to preserve the correct structure at low flux levels, where noise can result in negative values of after background subtraction. quantifies the distribution of flux values among the pixels of an object’s image. The two extreme values are if all pixels have the same flux, and if all the flux is concentrated in a single pixel. can therefore be thought of as measuring the contrast between the faintest and the brightest regions of a galaxy’s image, no matter where in the galaxy they are located; thus it does not assume any shape for the object. In our definition is computed within each aperture as described above. Circular apertures are preferred over elliptical ones because the shape of a bar clearly stands out in a circular aperture. An elliptical aperture instead would fit the bar’s shape to a higher degree, preventing the bar from standing out quite as much.
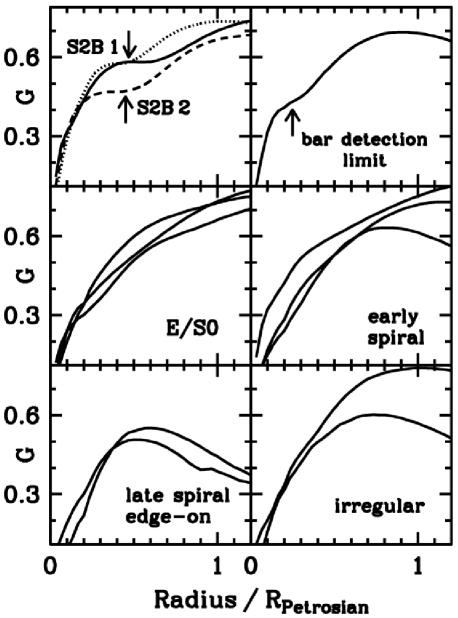
What do the Gini profiles of ordinary galaxies look like? From the objects in our working sample we assembled a subsample of such galaxies, ranging from ellipticals to late-type spirals and irregulars based on a visual classification. Since we selected objects with high concentration values, late-type spirals appear in our working sample generally when they are seen nearly edge-on. Similarly, the objects classified ’irregular’ still require a large amount of their light to be centrally concentrated to enter the sample. It is apparent from Fig. 2 that steadily increases with radius for E/S0 galaxies (possibly including edge-on early-type spirals), while for spirals it reaches a maximum and decreases thereafter. Late-type spirals can be distinguished because their maxima in are lower and are reached earlier than in early-type spirals
In the Gini profile of several galaxies, a plateau is seen at intermediate radii (top left panel of Fig. 2). We identify such a feature by its mathematical properties: the second derivative changes from negative to positive, with the first derivative positive before and after, but becoming small, or possibly negative, in between. We approximate the first and second derivative by considering small () intervals, which are then smoothed by averaging over three data points at each step. An object was selected if its profile shows a plateau that is at least as strong as the one presented in the upper right panel of Fig. 2. This also requires the bar to be ’strong’, i.e. a significant fraction of the total light needs to make up the bar shape. Bars that are so weak that they would hardly be seen without the help of unsharp masking or ellipse fits probably would not have enough effect on the Gini coefficient to produce a clear plateau in the profile. A plateau is evident in 46 objects of our working sample. Visual inspection shows that 17 of them indeed have a large bar, 23 galaxies are unbarred, while for 6 galaxies we could not decide whether a bar was present based on visual inspection.
How can the shape of for a barred galaxy be understood? First, the initial increase of with radius is caused by the brightest pixels being all located in the central region; thus increasing the radius adds only fainter pixels. This leads to a continuously increasing spread in the pixel flux values, and thus each Gini profile begins with increasing , independent of galaxy type. However, a bar is then able to maintain a relatively high surface brightness out to a larger radius than an unbarred object, therefore the fraction of faint pixels remains lower, which probably leads to the plateau in . Thus the Gini profile provides a simple way of identifying large, strong bars, and it can be computed easily and automatically for all sources detected in a deep survey such as GOODS.
Although we did successfully apply this bar detection method to the GOODS dataset, we point out that it is not yet optimized: the fraction of unbarred objects among the selected galaxies is , which would seem to not be a significant improvement over ellipse fits. Moreover, when visually inspecting all 231 galaxies of our working sample, 11 objects possess a bar but were missed by our method, partly because their bar is relatively small, but also because of spirals and lopsidedness. A quick visual study revealed that the method could be improved further, for example by including a second parameter to exclude those systems which are asymmetric. Moreover, our above interpretation of the cause of the plateau in the profile might be too simplistic: it could well be possible that not (only) the bar itself is causing the plateau, but rather the configuration of a barred galaxy as a whole, i.e. the distribution of pixel flux values around the bar. A full study of these issues is beyond the scope of this paper and will be addressed elsewhere (Pasquali et al., in prep.). Since completeness is not the goal for our feasibility study, we are satisfied with the easy derivation of the Gini profiles and defer further quantitative evaluation of the method’s potential.
Can the method be applied recursively to identify nuclear bars inside barred galaxies? This did not prove feasible due to the small apparent size of nuclear bars and, more importantly, the significant amount of smoothly distributed underlying galaxy light which decreases the contrast of nuclear bars (for the same reason, unsharp masks are such a useful tool for studying nuclear bars). Thus we had to inspect the selected barred objects visually and through unsharp masks in order to identify nuclear bars (Sect. 4). Two objects were clearly identified as double-barred: GOODS J033230.93-273923.7, hereafter S2B 1, and GOODS J033233.46-274312.8, hereafter S2B 2; both lie in the CDFS part of the GOODS survey.
4 Structural Properties
Here we present a structural analysis of S2B 1 and S2B 2. For this purpose we use unsharp masks and ellipse fits as in Erwin (2004).
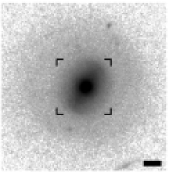
4.1 S2B 1 – a double-barred galaxy at
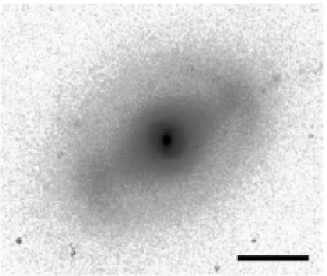
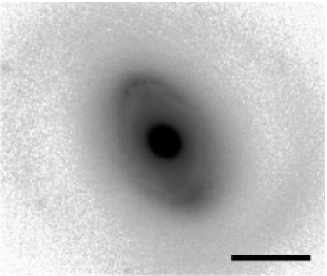
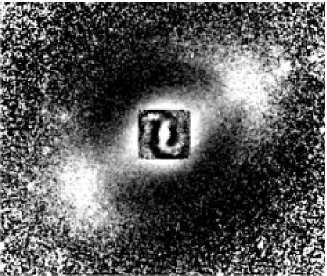
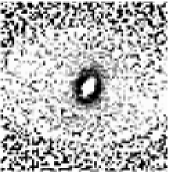
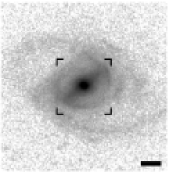
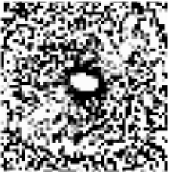
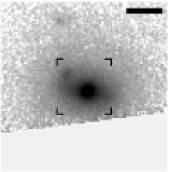
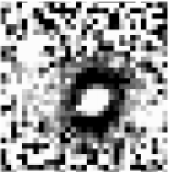
The left panels of Fig. 3 show, from top to bottom, an
-band image of S2B 1, an unsharp mask, and the ellipse fits. The
unsharp mask was created by dividing the original image with one
convolved with a Gaussian of pixels; in the center we
insert another unsharp mask created through a convolution with a much
smaller Gaussian ( pixels) to highlight the inner structure.
Apart from the huge primary bar, a very prominent secondary bar is
present along with a nuclear spiral. Its spectroscopic redshift, as
measured by the VIMOS VLT Deep Survey (Le Fèvre et al., 2004), is .
S2B 1 is therefore the most distant S2B galaxy known, at a luminosity
distance of
111Distances and image scales were derived with
Ned Wright’s Cosmology Calculator,
http://www.astro.ucla.edu/wright/CosmoCalc.html.
The black scale bar in the image
corresponds to a physical length of ; the image scale is
kpc/. We
visually classify S2B 1 as SB0/a.
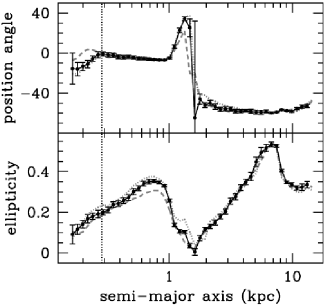
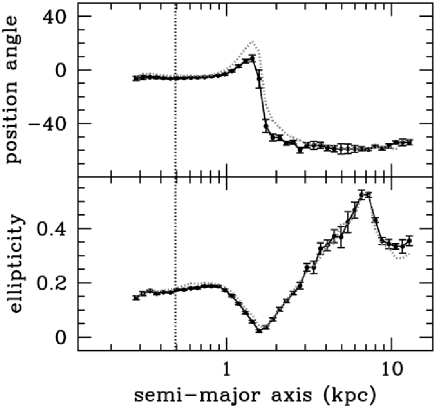
In order to quantify the structure of S2B 1, we performed an ellipse fit using the IRAF task ELLIPSE. The result is shown in Fig. 3; both the primary and secondary bar can be clearly identified as significant local peaks in the ellipticity. We did not attempt a deprojection of S2B 1, since its outer structure is difficult to determine: the primary bar dominates the galaxy’s appearance, and it cannot be ascertained whether it is circular or still part of an oval distortion. Since the primary bar lies along the major axis of the outer isophotes, as indicated by the nearly constant position angle in the ellipse fits, we do not expect measurements of its size and shape to be significantly affected by a, probably modest, inclination.
Following Erwin (2004), we measured the primary bar’s semi-major axis at its maximum ellipticity , and the upper limit on the bar semi-major axis as , where is the smaller of and , with being the semi-major axis at the first ellipticity minimum outside the bar, and being the semi-major axis where the position angle has changed by from the bar position angle. The equivalent values for the secondary bar are and . The physical size of the primary bar in S2B 1 is larger than 47 of the 50 S2Bs presented by Erwin (2004), while the secondary is larger than of Erwin’s sample.
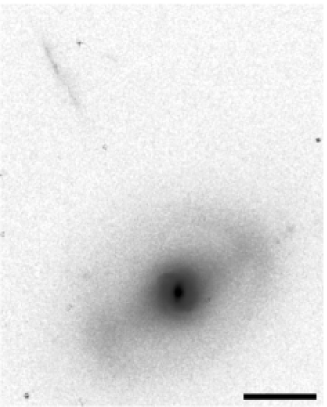
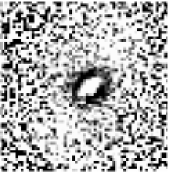
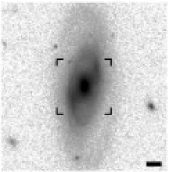
Visual inspection of the immediate environment of S2B 1 reveals a jet-like object close to it and pointing towards its center (Fig. 4). This object is seen in all bands. If the secondary bar in S2B 1 is feeding gas to an SMBH, then a jet originating from the SMBH may indeed be expected. However, its photometric redshift provided by the COMBO-17 survey (Wolf et al., 2004) is , suggesting the object is a background galaxy. On the other hand, one would not expect a photometric redshift (which relies on template spectral energy distributions) to yield useful results if the object actually was a jet. The X-ray flux of the galaxy would allow us to test for an active black hole in the center. The Extended CDFS survey (Virani et al., 2006) does not detect S2B 1, but it provides an upper limit on the X-ray flux. The 3 sigma upper limit on the count rate is (Virani, priv. comm.), which translates into an upper limit on the flux in the soft bands () of , using the Chandra X-ray Center Proposal Planning Toolkit PIMMS v3.7222http://cxc.harvard.edu/toolkit/pimms.jsp with a power law spectral model and a photon index of 1.8. This corresponds to an upper limit on the soft X-ray luminosity of . By applying equations 1 and 2 of Hornschemeier et al. (2003) we derive an upper limit on the X-ray-to-optical flux ratio of S2B 1 of . This value lies two orders of magnitude below the typical values for AGNs (cf. Fig. 3 of Hornschemeier et al., 2003); however, a heavily obscured AGN cannot be excluded.
Afonso et al. (2006) presented Australia Telescope Compact Array radio (1.4 GHz) observations of the CDFS. They found a total of 64 radio sources within the HST/ACS region of the GOODS/CDFS with flux densities between and . However, S2B 1 was not detected in this survey.
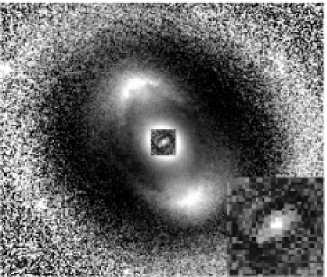
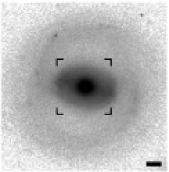
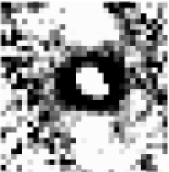
4.2 S2B 2 – a double-barred galaxy at
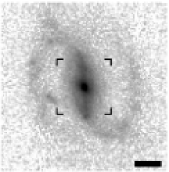
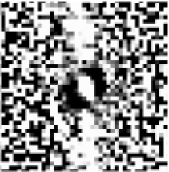
The right panels of Fig. 3 show an -band image, unsharp mask, and the ellipse fits for S2B 2, which we classify as SB0/a. The unsharp masks were produced with Gaussians of pixels and pixels. The small unsharp mask reveals an inner bar and spiral in the center of S2B 2. This is confirmed by a local peak in ellipticity, although this peak is relatively weak due to the small apparent size of the bar. The position angle nicely tracks the inner bar and then changes by about outside of it, since the inner and outer bars in this galaxy are nearly perpendicular. S2B 2’s spectroscopic redshift, as measured by 2dFGRS (Colless et al., 2001), is , putting it at a luminosity distance of . The black scale bar in the image corresponds to a physical length of ; the image scale is kpc/.
We deprojected the galaxy by assuming that the ellipticity minimum outside of the primary bar is the apparent ellipticity of the galaxy as a whole; we then obtained the deprojected size of the inner bar as and . The corresponding values for the primary bar are and , which did not require deprojection since the primary bar is almost along the galaxy’s apparent major axis.
The primary bar of S2B 2 is slightly smaller than the median size of the 50 S2Bs in Erwin (2004), while the secondary bar is smaller than that of of the same sample. With PSF FWHM the apparent size of the secondary bar is obviously just large enough for it to be detected by HST/ACS ( PSF FWHM in the -band and similar in the other bands). We therefore conclude that would be the maximum redshift for HST/ACS detection of the inner bar for the smallest of the currently known S2Bs.
S2B 2 has a faint (pseudo) ring around the main galaxy, resembling the R class of Buta & Crocker (1991). Rings are quite common in barred galaxies, and simulations show that they can be produced at bar resonances (see, e.g. the review by Buta & Combes, 1996).
S2B 2 is not detected in the radio observations of Afonso et al. (2006), but is detected in the CDFS survey of the Chandra X-Ray Observatory (Alexander et al., 2003; Giacconi et al., 2002). Its X-ray flux is in the soft bands (), which translates into a soft X-ray luminosity of . The upper limit on the flux in the hard bands () is (Alexander et al., 2003). With an X-ray-to-optical flux ratio of S2B 2 belongs to the optically bright, X-ray faint (OBXF) class of sources (Hornschemeier et al., 2003). These objects are thought to be quiescent, normal galaxies, with their high-energy emission originating from stellar processes or from low-level accretion onto SMBHs, but not from luminous active galactic nuclei unless they are heavily obscured. Since the optical and X-ray positions only differ by – which equals the median positional uncertainty of the faint X-ray sources (Alexander et al., 2003) – it is likely to originate from the central region. While we cannot gain more insight into the processes generating the X-ray emission of S2B 2, more detections of intermediate-redshift S2Bs at X-ray wavelengths would test the hypothesis that gas in S2Bs is fed to SMBHs.
5 Stellar population analysis
Comparisons of the available photometry from the ACS images with population synthesis models allow us to estimate the age and metallicity distribution of the stellar component in the two galaxies. A pixel by pixel approach has the advantage of spatially resolving regions which may have undergone different histories of star formation. However, the uneven distribution of the signal-to-noise ratio (SNR) across the galaxy images results in complicated maps of uncertainties which are hard to interpret. In order to improve the spatially resolved analysis, we decided to perform an adaptive binning following the Optimal Voronoi Tessellation method of Cappellari & Copin (2003), which has already been applied successfully to a study of early-type galaxies in GOODS/CDFS (Ferreras et al., 2005). A Voronoi tessellation divides a region starting from a distribution of points called generators. The area (or volume) is then binned in those regions closest to a given generator. Motivated by the analysis of integral field spectroscopy, Cappellari & Copin (2003) presented an algorithm optimised for the binning of a 2D map into bins which yield a small scatter of the SNR with respect to some target value and which are kept reasonably round in order to preserve, as much as possible, the spatial resolution. When we apply this method to colour maps, we ensure that the subsequent stellar population analysis is as homogeneous as possible.
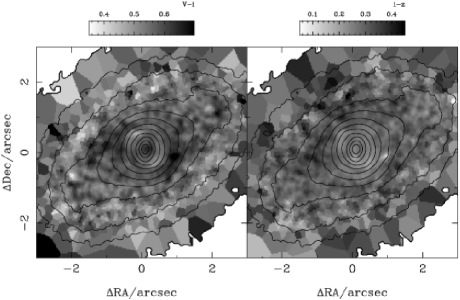
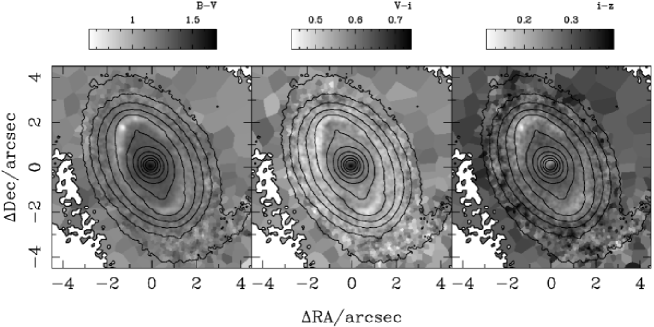
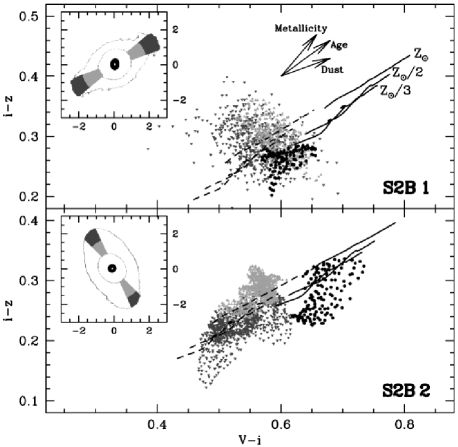
We generated colour maps by registering the images and convolving them with the PSF corresponding to the other band used for a given colour – e.g. for a colour map we convolve the -band image with the -band PSF and vice versa. We measured the PSFs from a set of stars in the GOODS/CDFS field. A recent analysis performed by the GEMS group (Rix et al., 2004) found that a universal PSF obtained from a set of bright but unsaturated stars is fully sufficient for all GOODS sections and for all positions inside each section. For the Optimal Voronoi Tessellation on the registered and convolved images, we chose a target SNR of in the ratio of the to fluxes, which amounts to an uncertainty of mag for the colour in each bin. The same bins were used in all other colours ( and ); the average errors are mag in and mag in . Note that S2B 1 does not have a -band image because it falls close to the edge of the field. Figures 5 and 6 show the colour maps for S2B 1 and S2B 2, respectively. The distribution of colours is somewhat patchier than expected from the above errors only (i.e. the RMS of the colour values exceeds the errors), particularly in S2B 1, which is partly due to dust and partly to population differences.
Table 1 lists some integrated properties of our objects. The -band absolute luminosity was computed from the observed passband which gives the smallest K correction, i.e. F606W for both S2B 1 and S2B 2, with a correction mag. The spectral energy distribution for these corrections was obtained from a simple stellar population with solar metallicity, whose age best matches the observed colours.
5.1 S2B 1
A young stellar component in the inner spiral structure is readily visible in the colour map in Fig. 5, at around from the center. Ongoing star formation is also deduced from a low-resolution spectrum of S2B 1 from the VIMOS VLT Deep Survey of the CDFS region (Le Fèvre et al., 2004). The spectrum spans the 5600-9000Å region and features H and [O III] but no [N II] emission, a signature of star-forming HII regions. Although these might coincide with the above region of young stars, no spatial resolution is possible due to the slit size () and to ground-based resolution.
The age-metallicity degeneracy prevents us from getting an accurate estimate of the age and metallicity distribution. Nevertheless, we can test for gross differences between the stellar populations in the primary and secondary bars via a colour-colour diagram. The top panel of Fig. 7 shows the versus colour distribution of S2B 1. Each “pixel” corresponds to a Voronoi-tessellated bin with the targeted SNR of 20 in the ratio of to , which aims at a 0.05 mag photometric error in . The actual tessellation produced an average error of 0.047 mag with a 0.033 mag RMS scatter. Regions in the inner bar are represented by filled dots. We selected those regions of the galaxy with an -band surface brightness between 17.5 and 18.5 mag/arcsec2, so that we exclude the very inner region which appears to be affected by dust. The filled triangles give the colours in the outer bar, located in the region with surface brightness between 21 and 22 mag/arcsec2. We select pixels in a wedge aligned with the position angle of the outer bar. We also distinguish pixels in two radial bins: the light grey symbols correspond to distances from the center while the dark grey symbols are pixels at .
For comparison, we show the colours of simple stellar populations from the latest models of Bruzual & Charlot (2003). Each line represents an age sequence between 2 and 10 Gyr, and three metallicities are considered, as labelled in the figure. The dashed lines are dustless populations, whereas the solid lines assume and a simple dust reddening law (Charlot & Fall, 2000). The inner bar shows the bluest colours in , which can be interpreted as indicating that its metallicity is lower than of the outer bar, and in addition either the stellar ages or the amount of dust is higher. However a unique interpretation is not possible with these data. The outer bar regions possess a larger colour spread than the inner bar, which presumably is caused mainly by dust (given the patchy distribution of colours discussed above), but may partly be due to radial variations in the stellar populations.
5.2 S2B 2
This galaxy has a conspicuous ring of young stars at a projected distance kpc () from the center (Fig. 6). Interior to this ring, the red colours are indicative of either old populations or dust extinction. The bottom panel of Fig. 7 shows the colour-colour diagram of S2B 2. The inner region – shown as dots – corresponds to an -band surface brightness between 17 and 18 mag/arcsec2. The filled triangles are pixels in the outer bar – selected in a wedge centered at the position angle of the bar with surface brightness between 20 and 21 mag/arcsec2. Two radial bins are chosen in the same way as with S2B 1, and similar population synthesis model predictions are shown. Note the remarkable difference between the outer bar and the red colours of the inner bar, which is significantly affected by dust. The figure hints at younger ages in the outer parts of the primary bar, which is clearly due to the ring of young stars mentioned above.
6 S2Bs in COSMOS
In the course of our study, the reduced HST/ACS -band imaging data (v1.2) of the first square degree of the Cosmic Evolution Survey (COSMOS333See http://www.astro.caltech.edu/cosmos) became publicly available. Since these data cover an area about twelve times larger than GOODS, they can be expected to host several S2B galaxies at intermediate redshifts. The COSMOS image depth is only slightly lower than that of GOODS, therefore a search for S2Bs with our Gini profile method and subsequent visual inspection appeared promising. We applied the same selection criteria as for our GOODS dataset, i.e. , , and half-light radius pixels. Indeed, we were able to identify two S2Bs and five S2B candidates which we list in Table 2. Their images and unsharp masks are shown in Fig. 8.
Based on their unsharp masks and ellipse fits (not shown), the objects COSMOS J095922.76+024245.3 and COSMOS J095936.98+015107.6 clearly host inner bars. Four of the other five galaxies probably contain nuclear disks since the inner position angles match those of their outer disks. The remaining object is an S2B candidate. In this analysis, the larger pixel scale of the COSMOS images as compared to GOODS has a noticeable effect – a drizzling process that would bring the COSMOS pixel scale from the current mas down to mas as in GOODS would result in a better discrimination of inner bars. Unfortunately, no further data (such as colours and redshifts) are publicly available for these galaxies; therefore their distances, bar sizes, and stellar population properties remain unknown.
7 Summary and Discussion
To date, all observational studies of S2Bs have been undertaken in the nearby universe. In this paper we presented the two most distant S2Bs currently known, at and , corresponding to a look-back time of 1.3 and 1.9 Gyr, respectively. Although our S2B sample contains only two objects, we can perform a consistency check with the number of S2Bs that would be expected given the numbers for nearby objects. Our GOODS sample of early-type barred galaxies consists of 17 objects that were selected by our Gini profile method, plus 11 barred galaxies that were missed by the method (see Sect. 3). Adopting an S2B fraction of 30% (e.g. Erwin & Sparke, 2002) we would thus expect 8.4 S2Bs to be within our sample. With a given distribution of redshifts, the bottom panel of Fig. 1 then leads to an estimate of the number of S2Bs whose inner bar would be large enough to be identified. Redshifts are available for 12 SBs in GOODS/CDFS from the COMBO-17 survey (Wolf et al., 2004) and the VIMOS VLT Deep Survey (VVDS, Le Fèvre et al., 2004), with 6 objects beyond . When we adopt this distribution to be representative for all 28 SB galaxies, we would expect to detect S2Bs, in excellent accordance with our findings. While this suggests no significant evolution of the S2B fraction, clearly a larger sample of S2Bs at intermediate redshifts is necessary to address the statistics properly.
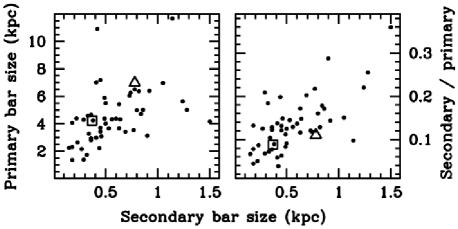
Any sample of intermediate-redshift S2Bs would of course be biased towards large secondary bars, and also towards large primary bars – the latter being due to both the selection of barred galaxy candidates and due to a correlation of the sizes of inner and outer bar. Despite this inevitable bias, it would be possible to compare the relations between the sizes of primary and secondary bar with those of the local sample: the data from Erwin (2004) show a clear correlation of primary and secondary bar size (left panel of Fig. 9). Moreover, the secondary-to-primary ratio is not constant but it increases with increasing secondary bar size (right panel of Fig. 9). If an intermediate-redshift sample showed an offset with respect to the local relations, this would hint at a decoupled evolution of sizes, possibly related to the loss of angular momentum. While S2B 2 (open square in Fig. 9) falls onto the above relations, the primary bar of S2B 1 (open triangle) is very large compared with its secondary. Still, S2B 1 falls within the scatter of the relations.
In addition to the structural parameters, we presented a colour analysis of the two S2Bs. Unfortunately, it is not possible from the available data alone to precisely trace back the star formation history of an individual galaxy (and of its bars), especially given the possible effect of dust and the well-known age-metallicity degeneracy. Nevertheless, we show that population differences between the outer bar and the inner bar region can be quantified, demonstrating the feasibility of stellar population analyses of S2Bs at intermediate redshifts. It is not clear whether the evolution of the primary bar and the secondary’s stellar content are linked in some way. For example, the secondary bar could be formed from stars born from gas swept by the primary bar. An intermediate-redshift S2B sample of significant size would be able to address this question. If the amount of dust were small, the colours of S2B 1 could be interpreted as the inner bar having lower metallicity and larger stellar ages (Sect. 5.1), making the above scenario implausible for this galaxy. The colours of S2B 2 are clearly more strongly affected by dust and little can be said about the relative ages of the primary and secondary bars.
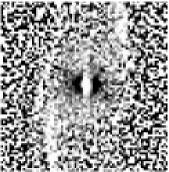
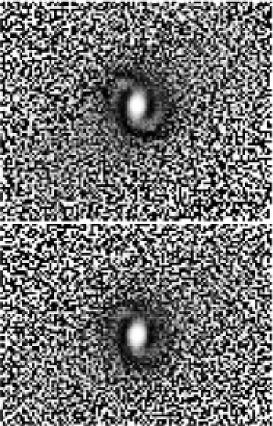
Another important result for future searches of S2Bs stems from our detection of S2B 2: its inner bar has an apparent semi-major axis size of only PSF FWHM but can still be recognized. This is significantly smaller than the estimate of PSF FWHM as a lower limit from Sheth et al. (2003), probably also due to the increased resolution from image drizzling. We thus suggest 1.5 PSF FWHM as a more modest minimum size for detecting nuclear bars. When we adopt this new limit, Fig. 1 demonstrates that we increase the maximum redshift for detection of the largest inner bars () of local S2Bs by more than a factor of two, from a redshift of to . In particular, S2B 1 with PSF FWHM should still be detectable at given the new detection limit. To test this, we created a mock image of S2B 1 at . Taking into account the corresponding wavelength shift would require an image right between -band and -band to be ’redshifted’. We therefore performed the artificial redshifting for both - and -band images. The images were rescaled and convolved with a Moffat profile representing the PSF of the GOODS images. Gaussian noise corresponding to the noise of the original images was then added, and unsharp masks, ellipse fits and Gini profiles were produced. The flux values were rescaled correctly throughout the process, taking into account surface brightness dimming as well as a proper normalization of the convolved images. We did not deconvolve the original image prior to redshifting it, which means that our final PSF is slightly too large; hence our treatment is conservative. The secondary bar can still be clearly identified in the unsharp masks (Fig. 10), and the primary bar would also have been selected from its Gini profile (dotted line in top left panel of Fig. 2). The ellipse fits (Fig. 10) show the inner bar as a flat peak in ellipticity, with a sharp drop outside of it. This inner part looks very similar to the ellipse fit of S2B 2, for the obvious reason that both inner bars in the redshifted S2B 1 and in S2B 2 are close to their detection limit. Since the inner bar of S2B 1 is not exceptional compared to local S2Bs (24% of the inner bars listed in Erwin (2004) are even larger), those could therefore be detected out to still larger redshifts, (Fig. 1).
Our identification of two S2Bs and five more S2B-candidate objects in the COSMOS data proves that in present-day deep surveys, it is worthwhile to search for distant S2Bs. These galaxies can be analyzed in a similar way as presented in this paper as soon as redshifts and colour data become available. We have shown that HST/ACS data are capable of making considerable progress in understanding the structure and evolution of such objects. We therefore see the possibility of an S2B sample distributed over a large redshift range in the near future. Such a sample would serve as an important observational constraint on models of S2B formation.
We described a first step in developing a model-independent method for detecting large and strong bars which we used here. While the method as presented here is not optimized, it appears that with further refinements it can become a useful method for identifying bars in large surveys.
Acknowledgments
We thank the referee for useful comments that helped us improve the paper. We are grateful to Shanil Virani for providing us with an upper limit on the X-ray flux of S2B 1. TL, VPD and IF enjoyed the company of the Celeste family and the atmosphere at Barry’s Pizza. VPD and IF thank the Astronomisches Institut der Universität Basel for hospitality while this paper was in progress. TL gratefully acknowledges support by the Swiss National Science Foundation through grant number 200020-105260. VPD is supported by a Brooks Prize Fellowship at the University of Washington and receives partial support from NSF ITR grant PHY-0205413. This research has made use of NASA’s Astrophysics Data System Bibliographic Services.
References
- Abraham et al. (1999) Abraham R. G., Merrifield M. R., Ellis R. S., Tanvir N. R., Brinchmann J., 1999, MNRAS, 308, 569
- Abraham et al. (2003) Abraham R. G., van den Bergh S., Nair P., 2003, ApJ, 588, 218
- Afonso et al. (2006) Afonso J., Mobasher B., Koekemoer A., Norris R. P., Cram L., 2006, AJ, 131, 1216
- Alexander et al. (2003) Alexander D. M., Bauer F. E., Brandt W. N., et al. 2003, AJ, 126, 539
- Bershady et al. (2000) Bershady M. A., Jangren A., Conselice C. J., 2000, AJ, 119, 2645
- Bruzual & Charlot (2003) Bruzual G., Charlot S., 2003, MNRAS, 344, 1000
- Buta & Combes (1996) Buta R., Combes F., 1996, Fundamentals of Cosmic Physics, 17, 95
- Buta & Crocker (1991) Buta R., Crocker D. A., 1991, AJ, 102, 1715
- Cappellari & Copin (2003) Cappellari M., Copin Y., 2003, MNRAS, 342, 345
- Charlot & Fall (2000) Charlot S., Fall S. M., 2000, ApJ, 539, 718
- Colless et al. (2001) Colless M., Dalton G., Maddox S., et al. 2001, MNRAS, 328, 1039
- Conselice (2003) Conselice C. J., 2003, ApJS, 147, 1
- Corsini et al. (2003) Corsini E. M., Debattista V. P., Aguerri J. A. L., 2003, ApJ, 599, L29
- Debattista et al. (2006) Debattista V. P., Mayer L., Carollo C. M., Moore B., Wadsley J., Quinn T., 2006, ApJ, accepted (astro-ph/0509310)
- de Vaucouleurs (1975) de Vaucouleurs G., 1975, ApJS, 29, 193
- Elmegreen et al. (2004) Elmegreen B. G., Elmegreen D. M., Hirst A. C., 2004, ApJ, 612, 191
- Erwin (2004) Erwin P., 2004, A&A, 415, 941
- Erwin & Sparke (1999) Erwin P., Sparke L. S., 1999, ApJ, 521, L37
- Erwin & Sparke (2002) Erwin P., Sparke L. S., 2002, AJ, 124, 65
- Erwin & Sparke (2003) Erwin P., Sparke L. S., 2003, ApJS, 146, 299
- Eskridge et al. (2000) Eskridge P. B., Frogel J. A., Pogge R. W., et al. 2000, AJ, 119, 536
- Ferreras et al. (2005) Ferreras I., Lisker T., Carollo C. M., Lilly S. J., Mobasher B., 2005, ApJ, 635, 243
- Giacconi et al. (2002) Giacconi R., Zirm A., Wang J., et al. 2002, ApJS, 139, 369
- Giavalisco et al. (2004) Giavalisco M., Ferguson H. C., Koekemoer A. M., et al. 2004, ApJ, 600, L93
- Gini (1912) Gini C., 1912, reprinted in Memorie di Metodologia Statistica, ed. E. Pizetti & T. Salvemini (1955; Rome: Libreria Eredi Virgilio Veschi)
- Glassman et al. (2002) Glassman T. M., Larkin J. E., Lafrenière D., 2002, ApJ, 581, 865
- Hornschemeier et al. (2003) Hornschemeier A. E., Bauer F. E., Alexander D. M., et al. 2003, AJ, 126, 575
- Jogee et al. (2004) Jogee S., Barazza F. D., Rix H.-W., et al. 2004, ApJ, 615, L105
- Knapen et al. (2000) Knapen J. H., Shlosman I., Peletier R. F., 2000, ApJ, 529, 93
- Laine et al. (2002) Laine S., Shlosman I., Knapen J. H., Peletier R. F., 2002, ApJ, 567, 97
- Le Fèvre et al. (2004) Le Fèvre O., Vettolani G., Paltani S., et al. 2004, A&A, 428, 1043
- Lilly et al. (1998) Lilly S., Schade D., Ellis R., et al. 1998, ApJ, 500, 75
- Lotz et al. (2004) Lotz J. M., Primack J., Madau P., 2004, AJ, 128, 163
- Lynden-Bell & Kalnajs (1972) Lynden-Bell D., Kalnajs A. J., 1972, MNRAS, 157, 1
- Maciejewski & Sparke (1997) Maciejewski W., Sparke L. S., 1997, ApJ, 484, L117
- Maciejewski & Sparke (2000) Maciejewski W., Sparke L. S., 2000, MNRAS, 313, 745
- Pérez (2004) Pérez I., 2004, A&A, 427, L17
- Petrosian (1976) Petrosian V., 1976, ApJ, 209, L1
- Rautiainen et al. (2002) Rautiainen P., Salo H., Laurikainen E., 2002, MNRAS, 337, 1233
- Reshetnikov et al. (2002) Reshetnikov V., Battaner E., Combes F., Jiménez-Vicente J., 2002, A&A, 382, 513
- Rix et al. (2004) Rix H.-W., Barden M., Beckwith S. V. W., et al. 2004, ApJS, 152, 163
- Sellwood & Wilkinson (1993) Sellwood J. A., Wilkinson A., 1993, Rep. Prog. Phys, 56, 173
- Sheth et al. (2003) Sheth K., Regan M. W., Scoville N. Z., Strubbe L. E., 2003, ApJ, 592, L13
- Shlosman et al. (1990) Shlosman I., Begelman M. C., Frank J., 1990, Nature, 345, 679
- Shlosman et al. (1989) Shlosman I., Frank J., Begelman M. C., 1989, Nature, 338, 45
- Simard et al. (1999) Simard L., Koo D. C., Faber S. M., et al. 1999, ApJ, 519, 563
- Trujillo & Pohlen (2005) Trujillo I., Pohlen M., 2005, ApJ, 630, L17
- Virani et al. (2006) Virani S., Treister E., Urry C. M., Gawiser E., 2006, AJ, accepted (astro-ph/0506551)
- Wolf et al. (2004) Wolf C., Meisenheimer K., Kleinheinrich M., Borch A., Dye S., Gray M., Wisotzki L., Bell E. F., Rix H.-W., Cimatti A., Hasinger G., Szokoly G., 2004, A&A, 421, 913
| Object | ID | mi | MV | |||
|---|---|---|---|---|---|---|
| magAB | magAB | magAB | magAB | magAB | ||
| GOODS J033230.93-273923.7 | S2B 1 | — | ||||
| GOODS J033233.46-274312.8 | S2B 2 |
| Object | mi | Classification |
|---|---|---|
| magAB | ||
| COSMOS J095922.76+024245.3 | 18.4 | S2B |
| COSMOS J095936.98+015107.6 | 17.9 | S2B |
| COSMOS J095931.25+015916.5 | 18.1a | possibly S2B or SB with nuclear disk |
| COSMOS J095947.65+021549.0 | 18.4 | possibly S2B or SB with nuclear disk |
| COSMOS J100045.42+021932.4 | 19.4 | possibly S2B or SB with nuclear disk |
| COSMOS J100048.23+015856.2 | 20.0 | possibly S2B or SB with nuclear disk |
| COSMOS J095952.25+020543.1 | 20.1 | possibly S2B |
-
a
Partially contaminated by a bright star’s bleeding trails.