Diffuse Optical Light in Galaxy Clusters I: Abell 3888
Abstract
We are undertaking a program to measure the characteristics of the intracluster light (total flux, profile, color, and substructure) in a sample of 10 galaxy clusters with a range of cluster mass, morphology, and redshift. We present here the methods and results for the first cluster in that sample, A3888. We have identified an intracluster light (ICL) component in A3888 in and that contains % of the total cluster light and extends to 700hkpc () from the center of the cluster. The ICL color in our smallest radial bin is , similar to the central cluster ellipticals. The ICL is redder than the galaxies at hkpc although the uncertainty in any one radial bin is high. Based on a comparison of color with simple stellar models, the ICL contains a component which formed more than 7 Gyr ago (at ), coupled with a high metallicity (), and a more centralized component which contains stars formed within the past 5 Gyr (at ). The profile of the ICL can be roughly fit by a shallow exponential in the outer regions and a steeper exponential in the central region. We also find a concentration of diffuse light around a small group of galaxies 1.4hMpc from the center of the cluster. In addition, we find 3 low surface brightness features near the cluster center which are blue () and contain a total flux of 0.1. Based on these observations and X-ray and galaxy morphology, we suggest that this cluster is entering a phase of significant merging of galaxy groups in the core, whereupon we expect the ICL fraction to grow significantly with the formation of a cD galaxy as well as the in-fall of groups.
Subject headings:
galaxies: clusters: individual (A3888) — galaxies: evolution — galaxies: interactions — galaxies: photometry — cosmology: observations1. Introduction
Galaxy clusters contain a population of stars which are not members of individual galaxies but which are bound to the cluster potential, producing diffuse intracluster light (ICL). This ICL component has been found in a number of clusters through surface brightness measurements and direct detections of resolved stars including planetary nebulae, red giants, supernovae, novae, and globular cluster systems. These investigations indicate that the optical ICL comprises between 5% and 50% of the total optical cluster luminosity (see Feldmeier et al., 2004; Gonzalez et al., 2005; Zibetti et al., 2005, and references therein). Conclusions on the color of the ICL vary widely from blue to red, with and without color gradients (Schombert, 1988; Mackie, 1992; Gonzalez et al., 2000; Zibetti et al., 2005). Current measurements of the shape of the ICL generally favor a double deVaucouleurs profile such that one function fits the BCG and the second function fits the extended envelope (Gonzalez et al., 2000; Bernstein et al., 1995; Zibetti et al., 2005). Examples of tidal features such as plumes and bridges are found in multiple clusters as evidence of interactions which add stars to the ICL (Gregg & West, 1998; Calcáneo-Roldán et al., 2000; Feldmeier et al., 2004). Long-slit spectroscopy of A2199 shows that the intracluster stars there have the same velocity dispersion as the cluster galaxies (Kelson et al., 2002), confirming that, in at least one cluster, the intracluster stars are not bound to the individual galaxies but trace the overall cluster potential. Conversely, intracluster planetary nebulae studies show evidence for less relaxed velocities (Arnaboldi et al., 2004; Gerhard et al., 2005). There is no consensus on the velocity distribution of intracluster stars.
The intracluster light is a fossil remnant of cluster formation and evolution and can be used to study the dominant physical processes involved in galaxy evolution in clusters. Hierarchical dark matter simulations suggest that galaxies falling into dense regions would loose most of their mass. When mechanisms such as radiative cooling and star formation are included in the simulations, galaxies which are composed of a central dense core of stars do retain most of their stellar mass throughout cluster in-fall, but lose some stars to the cluster potential. State of the art simulations are able to predict the existence of this intracluster population, but basic questions as to its properties can only be answered by understanding which physical mechanisms are important. This work seeks to answer when and how intracluster stars are formed by studying the total flux, profile shape, color, and substructure in the ICL as a function of cluster mass, morphology, and redshift.
Observations of the total flux in the ICL over a sample of clusters will allow us to identify the effects of cluster environment on galaxy evolution. For example, a high mass cluster should have a higher ICL fraction than low-mass clusters if ram pressure stripping or harassment are dominant mechanisms. In fact, simulations by both Lin & Mohr (2004) and Murante et al. (2004) predict a strong relation between ICL fraction and mass. If, however, galaxy-galaxy merging is the dominant mechanism, and most of the galaxy evolution happens early on in cluster collapse, then the ICL should not correlate directly with current cluster mass. The existence of a cD galaxy in a cluster is evidence of a rich merger history and therefore morphology should also correlate strongly with ICL fraction. The ICL fraction will be affected by redshift, since with time comes an increased number of interactions.
Observations of the color and substructure of the ICL will help to identify the origin, formation epoch, metallicity, and possibly progenitor morphologies of cluster galaxies. For example, if the ICL is as red or redder than the bright cluster ellipticals, it is likely to be a remnant from the early epochs of cluster formation with little recent accretion of tidally disrupted systems. If the ICL is bluer than the galaxies, then some recent accretion has occurred, either from ellipticals with low metallicity or spirals with younger stellar populations. While multiple mechanisms are likely to play a role in the complicated process of formation and evolution of clusters, important constraints can come from ICL measurement in clusters with a wide range of properties.
In addition to constraining galaxy evolution, the ICL is an important baryonic component in clusters. The ICL, which is typically not included in the baryon census, will contribute to the baryon fraction of clusters and that contribution is likely to change with time. If the ICL fraction does indeed evolve with redshift and is a significant fraction of the total cluster light, it will systematically bias the inferred redshift dependence of the baryon fraction. Recent work by Allen et al. (2004) has used a change in baryon fraction with redshift of only a few percent to constrain cosmological parameters. When doing such precision cosmology it will be necessary to include ICL in the cluster light budget.
The ICL may also play an important role in the global properties of the intracluster medium (ICM). It has recently been suggested that an intracluster stellar population (ICSP) can account for at least some amount of heating and metal enrichment of the intracluster medium (ICM) (Zaritsky et al., 2004; Lin & Mohr, 2004; Domainko et al., 2004). Considering only supernovae (SNe) within galaxies, the full metallicity of the ICM can not easily be accounted for (Lin & Mohr, 2004). However, since intracluster supernovae are in situ in the ICM, they contribute directly to the metallicity of the ICM, and will have therefore a direct impact on its abundance. Although these authors find that the ICL cannot fully account for the high abundance of the ICM (), further studies are warranted to quantify just how many ICSNe there are. Even if the ICSP can not account for the full metallicity of the ICM, it is possible that this population is responsible for the metallicity gradient found in clusters. If true, a correlation between ICL flux and abundance gradients in clusters should exist.
In this paper we present the methods of this survey as well as measurements of the color, total flux, and profile shape for the first cluster in our sample, A3888. In §2 we discuss characteristics of the entire sample. Details of the observations and reduction are presented in §3 and §4 including flat-fielding and sky background subtraction methods. In §5 we discuss object detection and removal as well as cluster membership. In §6 we describe results followed by a discussion of accuracy limits in §7. In §8 we present a discussion of the results. Conclusions are summarized in §9.
Throughout this paper we use km/s/Mpc, = 0.3, = 0.7 which gives 3.5 kpc/arcsecond at the distance of A3888.
2. The Sample
The ten galaxy clusters in our survey were selected to meet two general criteria. First, each cluster has a published X-ray luminosity which guarantees the presence of a cluster and provides an estimate of the cluster’s mass. Second, all are at high galactic and ecliptic latitude along lines of sight with low HI column density. This minimizes complications due to scattered light from galactic stars and zodiacal dust and from variable extinction across the cluster field. Of the clusters that meet the above qualifications, we selected ten clusters as the beginning of a statistical sample which is representative of a wide range in cluster characteristics, namely redshift, morphology, spatial projected density (richness), and X-ray luminosity (mass).
To the extent possible, we also selected clusters for which mass estimates and membership information are available in the literature. For example, in addition to published X-ray masses, three of the clusters have mass estimates from gravitational lensing measurements. Published redshift surveys provide velocity dispersions and membership information for all but 2 clusters in the survey. Those 2 clusters, as well as 5 others with small numbers of published velocities, were included in a redshift survey we undertook with IMACS on Magellan I (Baade). With these additional observations the physical properties of all clusters in our sample can be compared to the ICL characteristics. Table 1 lists the relevant information for the cluster sample.
The sample is divided into a “low” () and “high” () redshift range which we have observed with the 1 meter Swope and 2.5 meter Du Pont telescope respectively. The bottom end of the redshift range is limited by the field of view of the 1 meter telescope and detector , which corresponds to Mpc () at z = 0.05. This field of view allows us to measure the ICL as well as off-cluster background flux in the same image for all clusters in the sample. The top end of the redshift range reflects X-ray data availability and the increasing difficulty of measuring diffuse sources at high redshift due to surface brightness dimming.
2.1. A3888
This paper focuses on one cluster in our sample, A3888, which is a richness class 2 cluster at z=0.15 (Abell et al., 1989). This Bautz-Morgan type I-II cluster has no cD galaxy; instead the core is comprised of 3 distinct sub-clumps of multiple galaxies each. At least 2 galaxies in each of these clumps are confirmed members (Teague et al., 1990; Pimbblet et al., 2002). On large scales (286, 535, and 714 kpc) Girardi et al. (1997) find a unimodal distribution for this cluster with no detected substructures in either the galaxy spatial or velocity distribution. The projected spatial distribution of galaxies in A3888 is slightly elongated with an ellipticity of 0.43 (Struble & Ftaclas, 1994). X-ray surface brightness from XMM observations also indicate an elongated, single-peaked distribution for the hot gas. The cluster contains an X-ray bright Seyfert I galaxy located at a projected distance of roughly kpc from the cluster center (Reimers et al., 1996).
The mass of A3888 can be estimated from two different sets of observations. Reiprich & Böhringer (2002) calculate gravitational mass based on pointed ROSAT PSPC count rates and the ROSAT-ASCA Lx-Tx relation (Markevitch, 1998). Assuming an isothermal distribution and employing hydrostatic equilibrium, they find = 25.5 M⊙, where = 2.8Mpc which is defined as the radius within which the mean mass density is equal to two hundred times the critical density. In a complementary method, mass can be determined from published galaxy velocity dispersions. Based on redshifts for 50 member galaxies located within a radius of 3.11 Mpc (Teague et al., 1990) and using the method described by Girardi & Mezzetti (2001), we find that the mass of A3888 within is = 40.2 M⊙. For the purpose of this work, these two mass estimates are in good agreement, particularly since this cluster is elongated and likely not in dynamic equilibrium.
3. Observations
Observations for the entire sample of 10 clusters have been completed. The “high” redshift observations were made with the du Pont 2.5m telescope at Las Campanas Observatory. We used the thinned, Tektronix “Tek#5” CCD with a count gain and readnoise. The pixel scale is 0.259″/pixel ( pixels), so that the full field of view is 8.8′ on a side, corresponding to 1.8Mpc per frame. Data was taken in two filters, gunn- ( Å) and ( Å). These filters were selected to provide some color constraint on the stellar populations in the ICL, while avoiding flat-fielding difficulties at longer wavelengths and prohibitive sky brightness at shorter wavelengths.
Observing runs occurred on August 19-25, 1998, September 2-10, 1999, and September 22-27, 2000. Specifically, A3888 was observed on the nights of September 2 and 8, 1999 and September 22-25, 2000. Both observing runs took place in the days leading up to new moon. September 2, 1999 was the only non-photometric night, and only 3 cluster images were taken on that night. These were individually tied to the photometric data. The average seeing during the 1999 and 2000 run was 1.77 and 0.93 arcseconds respectively. Across both runs, we observed A3888 for an average of 5 hours in each band. In addition to the cluster frames, night sky flats were obtained in nearby, off-cluster, “blank” regions of the sky with total exposure times roughly equal to one third of the integration times on cluster targets. Night sky flats were taken in all moon conditions. Typical and band sky levels during the run were and mag arcsec-2, respectively.
Cluster images were dithered by one third of the field of view between exposures. The large overlap from the dithering pattern gives us ample area for linking background values from the neighboring cluster images. Observing the cluster in multiple positions on the chip is beneficial because upon combination large-scale flat-fielding fluctuations will be reduced. Integration times were typically 900 seconds as a compromise between signal-to-noise and moderating the number of saturated stars.
Observations of the “low” redshift clusters will be discussed in a future paper.
4. Reduction
In order to create a single, mosaiced image of the cluster with a uniform background level and accurate resolved–source fluxes, the images must be bias and dark subtracted, flat–fielded, flux calibrated, background–subtracted, extinction corrected, and registered before combining. These issues are dealt with as described below.
4.1. Bias and Dark Subtraction
Pre-processing of the data, including overscan, bias, and dark subtraction, was done in the standard manner using mainly IRAF tasks. The average bias level was stable at counts, changing by 1% throughout the night. There is structure in the bias in the form of random fluctuations, as well as a highly-repeatable, large-scale ramping in the first 500 pixels of every row. To remove this structure, we first fit an 8th order polynomial to 140 overscan columns and subtract that fit, column by column, from each image. We further average together ten bias frames per night with cosmic ray rejection and then boxcar smooth in the vertical direction before subtracting from the data. We choose to smooth in the vertical direction because we have already removed vertical structure in the previous processing step. Test-reduction of the bias frames themselves with this procedure reveals no remaining visible structure and each frame has a mean level of 0 counts to within counts.
Twenty-five dark exposures were taken per observing run. We averaged these together with rejection to look for structure or significant count levels in the dark current. The mean dark count is 0.6 counts/900s, which is less than of the sky level, and is therefore not significant. However, even at this small count level, there is some vertical structure in the dark which amounts to 1 count/900s over the whole image. To remove this large-scale structure from the data images, the combined dark frame was median smoothed over pixels (), scaled by the exposure time, and subtracted from the program frames. Small scale variations were not present in the dark. Errors in both the bias and dark subtraction due to structure in the residuals are an additive offset to the background level. These are included in our final error budget based on an empirical measurement of the stability of the background level in the final combined image (see §7).
4.2. Flat Fielding
The accuracy of any low surface brightness measurement is limited by fluctuations on the background level. A major contributor to those fluctuations is the the large-scale flat-fielding accuracy. Pixel–to–pixel sensitivity variations were corrected in all cluster and night-sky flat images using nightly, high S/N, median-combined dome flats with 70,000 – 90,000 total counts. After this step, a large-scale illumination pattern of order 1% remains across the chip. This was removed using combined night-sky flats of “blank” regions of the sky. To make these night-sky flats, objects in the individual blank sky frames were first masked before combination. We used SExtractor (Bertin & Arnouts, 1996) to identify all sources with a minimum of 6 pixels and a total flux of above the sky background. Mask sizes were increased by 4-7 pixels over the semi-major and semi-minor axes from the object catalogs to insure object rejection. The masked images were then median combined with rejection. This produced an image with no evident residual flux from sources and kept the large scale illumination pattern intact. Fluctuations are less than 0.1% peak to peak on scales. The final combined night-sky flats were then median smoothed pixels (), normalized, and divided into the program images. The illumination pattern was stable among images taken during the same moon phase. Program images were corrected only with night sky flats taken in conditions of similar moon. The contribution of flat fielding to our final error budget is measured empirically, as described in §7.
4.3. Non-linearity
Although the ICL measurement is based on a low number of counts, photometric calibration is based on bright standard stars. Accurate calibration is then dependent upon the CCD having a linear response to flux. To ascertain if Tek#5 was linear with flux over a wide dynamic range, a consecutive chain of dome-flat images were taken, with exposure times of 2 - 100 seconds, corresponding to approximately counts per pixel. Multiple passes through the exposure time sequence (increasing and decreasing) were made to rule out any effects from fluctuating lamp flux. We find that the Tek#5 CCD does have an approximately non-linearity, which we fit with a second order polynomial and corrected for in all the data. The same functional fit was found for both the 1999 and 2000 data. Note that exposure times used for all observations are long enough that shutter performance is not a problem. The uncertainty in the linearity correction is incorporated in the total photometric uncertainty discussed below.
4.4. Photometric Calibration
Photometric calibration was performed in the usual manner. Fifty to seventy standard stars (Landolt, 1992; Jorgensen, 1994) were observed per night per filter over a range of airmasses. Stellar magnitudes were measured with an aperture size of the full width at half maximum (fwhm), where the fwhm of the stars in the images was determined using SExtractor. We choose this aperture size as a compromise between aperture correction and added background noise. Photometric nights were analyzed together; solutions were found in each filter for a zero-point and extinction coefficient with an RMS of 0.03 magnitudes () in Sept. 1999 and 0.02 magnitudes ( and ) in Sept. 2000. These uncertainties are a small contribution to our final error budget, but are included for completeness as discussed in §7. Observing the same cluster field for long periods throughout the night allows us to measure an extinction coefficient from stars in the cluster fields, which we find is fully consistent with the extinction coefficient measured from the standard stars. The three exposures taken in non-photometric conditions were individually tied to the photometric data using roughly 10 stars well distributed around each frame to find the effective extinction for that frame. We find a standard deviation of 0.03 within each frame, with no spatial gradient in the residuals.
We have compared our and band magnitudes for hundreds of galaxies in the cluster with band magnitudes from the Las Campanas/AAT Rich Cluster Survey (LARCS, Pimbblet et al., 2002). To the detection limit of the LARCS photometry, and adopting a single average galaxy color to convert between filters, the two samples are consistent with an RMS scatter of 0.07 magnitudes.
4.5. Sky Background Subtraction
An important issue for accurate surface brightness measurement is accurate identification of the background sky level. The off-cluster background level in any image is a combination of atmospheric emission (airglow) and light from extra-terrestrial sources (zodiacal light, moonlight, starlight, starlight scattered off of galactic dust). Zodiacal light comes from solar photons scattered off of ecliptic dust and is therefore concentrated in the ecliptic plane, which, along with the galactic plane we were careful to avoid in sample selection, so the extra-terrestrial background light will not vary spatially. Light from the extra-terrestrial sources will additionally be scattered into the field of view by the atmosphere. Airglow is emission from the recombination of electrons in the earth’s atmosphere which were excited during the day by solar photons, and as such is a function of solar activity, time elapsed since sunset, and geomagnetic latitude (Leinert et al., 1998). Airglow and atmospheric scattering vary throughout the night, moonlight varies from night to night, and zodiacal light varies from year to year. The background values from frame to frame correspondingly vary temporally by up to 10% throughout one run and 20% from year to year.
Due to the temporal variations in the background, it is necessary to link the off-cluster backgrounds from adjacent frames to create one single background of zero counts for the entire cluster mosaic before averaging together frames. To determine the background on each individual frame we measure average counts in approximately twenty pixel regions across the frame. Regions are chosen individually by hand to be a representative sample of all areas of the frame that are more distant than Mpc from the center of the cluster. This is well beyond the radius at which ICL components have been identified in other clusters (Feldmeier et al., 2002; Gonzalez et al., 2005), and is also beyond the radius at which we detect any diffuse light in A3888. The average of these background regions for each frame is subtracted from the data, bringing every frame to a zero background. The accuracy of the background subtraction will be discussed in §7.
4.6. Extinction Correction
After background subtraction, all flux in the frame originates above the atmosphere, and is subject to atmospheric extinction (large angle scattering out of the line of sight). This is equally true of resolved sources and diffuse sources less than several degrees in extent. While extinction corrections are usually applied to individual resolved sources, that is not possible with the diffuse ICL. We correct entire cluster images for this extinction by multiplying each individual image by , where is the airmass and is the fitted extinction term from the photometric solution. This multiplicative correction is between 1.06 and 1.29 for the airmass range of our A3888 observations.
4.7. Registration & Distortion
To combine images, we align all 41 individual frames to one central reference frame. SExtractor positions of approximately 10 stars in each frame are used as input coordinates to the IRAF tasks geomap and geotran, which find and apply x and y shifts and rotations between images. The geotran solution is accurate to 0.01 pixels (RMS). As an independent check of registration accuracy, we confirm that the center coordinates of stars in the original images, as compared to the combined image, are the same to within 0.01 pixels. This uncertainty is negligible for our measurement which is made on much larger scales. In addition, the ellipticities of individual stars do not change with image combination, suggesting that no systematic errors in registration exist. Stellar ellipticities also show no variation across the frame, suggesting that there are no significant image distortions.
4.8. Image Combination
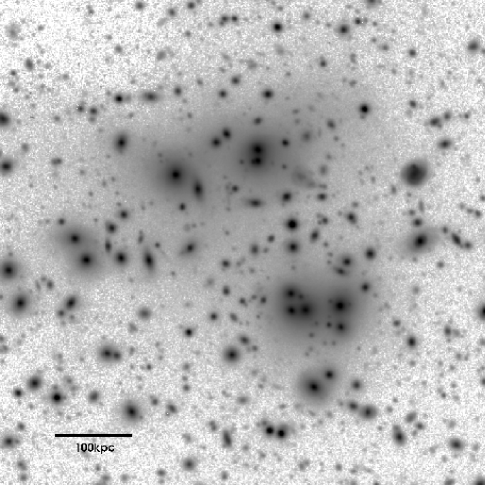
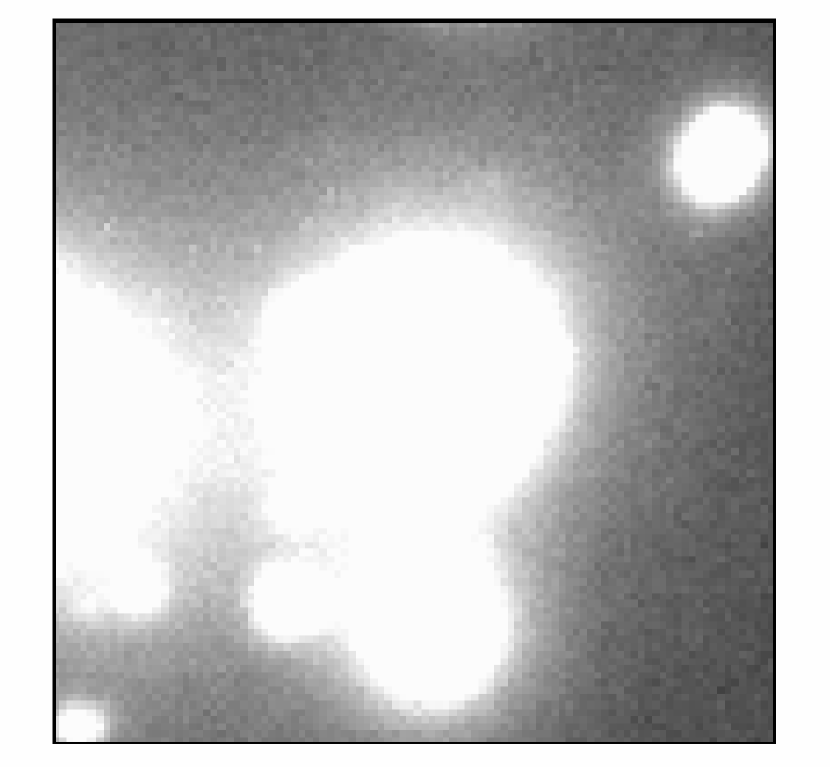
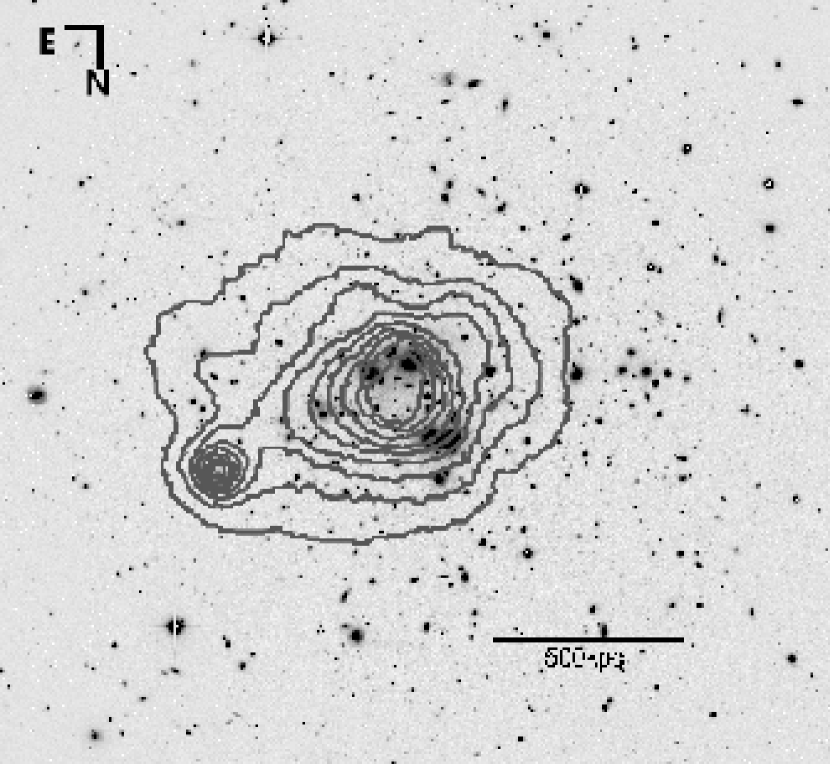
After pre-processing, background subtraction, extinction correction, and registration, we combined the images using the IRAF routine imcombine with a rejection of and . This range was chosen as a compromise between rejecting the cosmic rays (CRs) and allowing for some seeing variations in the peak flux of stars. In total, 16 and 25 900s exposures in the and bands, respectively, were averaged together. The final combined image is 4096 pixels (Mpc) on a side. The central region (approximately Mpc on a side) of the final combined band image is shown in Figure 1.
5. Analysis
5.1. Object Detection
We use SExtractor both to find all objects in the combined frames and to determine their shape parameters. The detection threshold in both the and images was defined such that objects have a minimum of 6 contiguous pixels, each of which are greater than above the background sky level. This corresponds to a minimum surface brightness of 26.0 mag arcsec-2 in and 26.4 mag arcsec-2 in . The faintest object in the catalog has a total magnitude of 27.0 mag in and 27.4 mag in , however we are complete only to 24.8 mag in and 24.5 mag in . We choose these parameters as a compromise between detecting faint objects in high signal-to-noise regions and rejecting noise fluctuations in low signal-to-noise regions. Shape parameters are determined in SExtractor using only those pixels above the detection threshold.
5.2. Object Removal & Masking
To measure the ICL we remove all detected objects from the frame by either subtraction of an analytical profile or masking. Details of this process are described below.
5.2.1 Stars
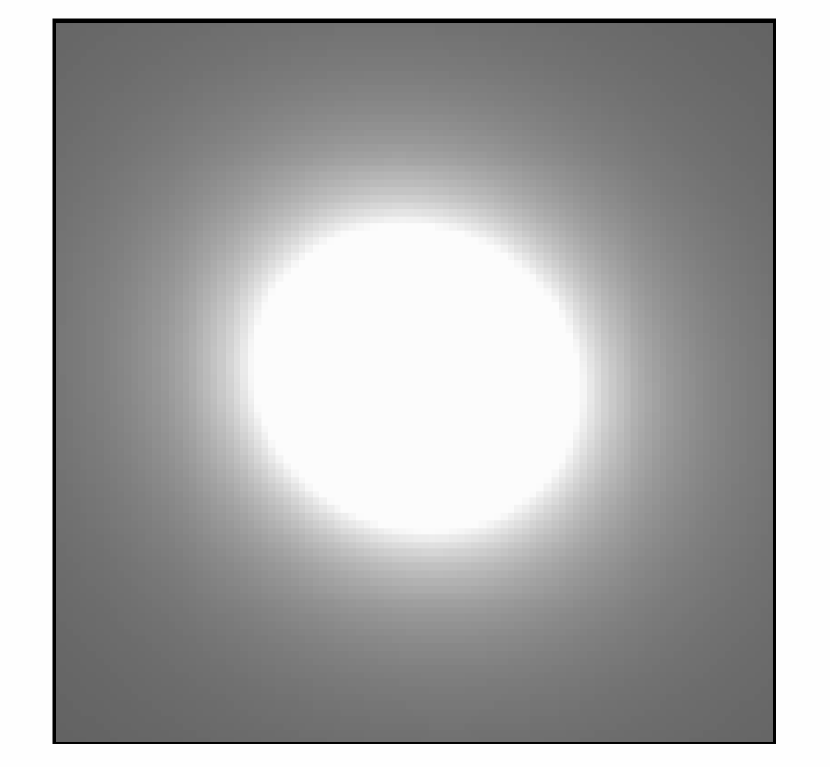
Scattered light in the telescope and atmosphere produce an extended point spread function (PSF) for all objects. To correct for this effect, we determine the telescope PSF using the profiles of a collection of stars from super-saturated 4th mag stars to unsaturated 14th magnitude stars. The radial profiles of these stars were fit together to form one PSF such that the extremely saturated star was used to create the profile at large radii and the unsaturated stars were used for the inner portion of the profile. This allows us to create an accurate PSF to a radius of ′, shown in Figure 2.
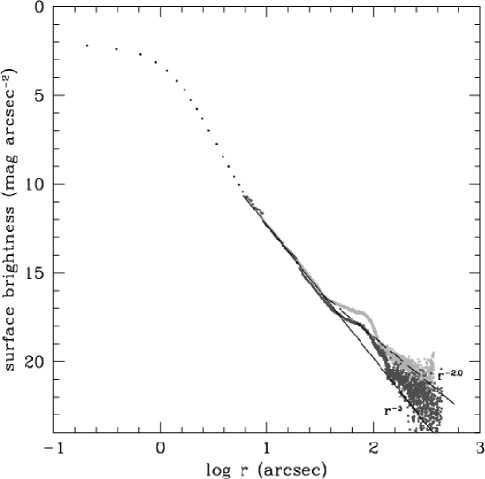
The inner region of the PSF is well fit by a Moffat function. The outer region is well fit by . There is a small additional halo of light at roughly 50 - 100″(200-400pix) around stars imaged on the CCD. Images of saturated stars located off of the field of view of the detector do not show this halo, indicating that it is due to a reflection of light off of the CCD itself. We find that roughly 1% of the total flux in the star is in this halo. There are 13 saturated stars within 3.8 Mpc of A3888 ranging from 11.6 - 15.2 magnitudes. The nearest three saturated stars are 0.6, 0.8, and 1.0 Mpc from the cluster center and have 14.6, 13.4, and 11.6 magnitudes, respectively. These stars do not directly contribute to the ICL measurement because they are not near enough to the center, do not have very bright magnitudes, and the PSF does not put very much power into the wings. We do a careful job of background subtraction, by tying to off-cluster flux, so that the PSF also does not affect the background measurement.
For each individual, non-saturated star, we subtract a scaled profile from the frame in addition to masking the inner ″ of the profile (the region which follows a Moffat profile). Since we do not have accurate magnitudes for the saturated stars in our own data, and to be as cautious as possible with the PSF wings, we have assumed the brightest possible magnitudes for these stars given the full USNO catalog errors. We then subtract a stellar profile with that magnitude and produce a large mask to cover the inner regions and any bleeding. We can afford to be liberal with our saturated star masking since there are very few saturated stars and none of them are near the center of the cluster where we need the unmasked area to measure any possible ICL.
5.2.2 Galaxies
To make an ICL measurement we would ideally like to subtract a scaled analytical profile for each galaxy that would leave no residuals and would allow us to recover the area on the sky covered by cluster galaxies. We have attempted to do this using 3 publicly available algorithms: GIM2D (Simard et al., 2002), Galfit (Peng et al., 2002), and the IRAF task ellipse (Jedrzejewski, 1987). With these algorithms, we have employed a wide range of surface brightness profiles, including deVaucouleurs, Sersic, exponential profiles, and combinations thereof. In addition, we have used iterative techniques to alternately fit and remove galaxies in crowded fields. The technical challenges in fitting the galaxies, including galaxy deblending, PSF effects and deconvolution, 2D profile fitting, and speed in performing many Fourier transforms have been previously discussed by several groups (see for example Peng et al., 2002, for a review).
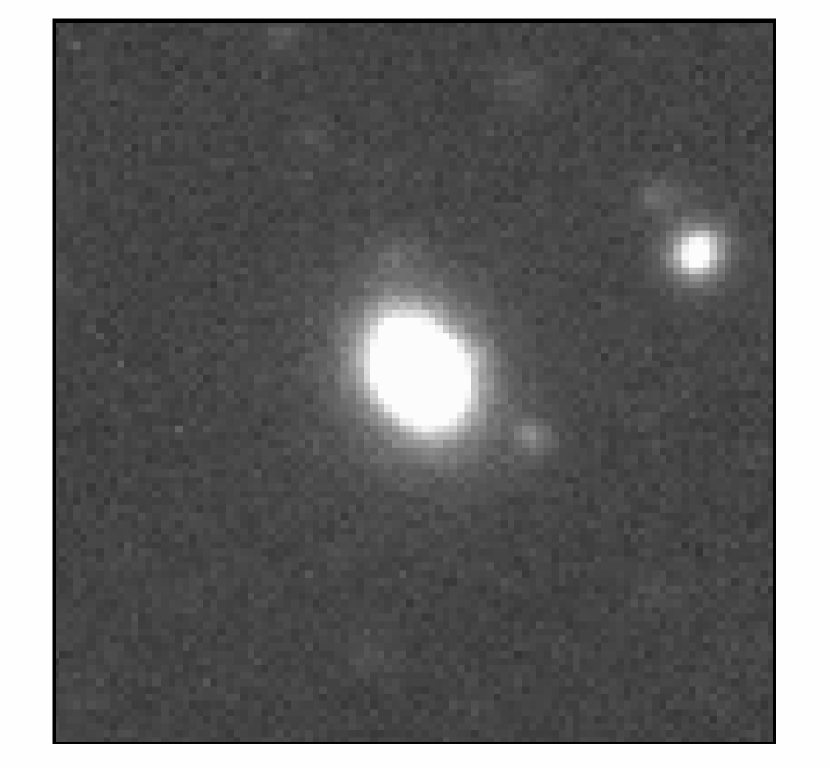
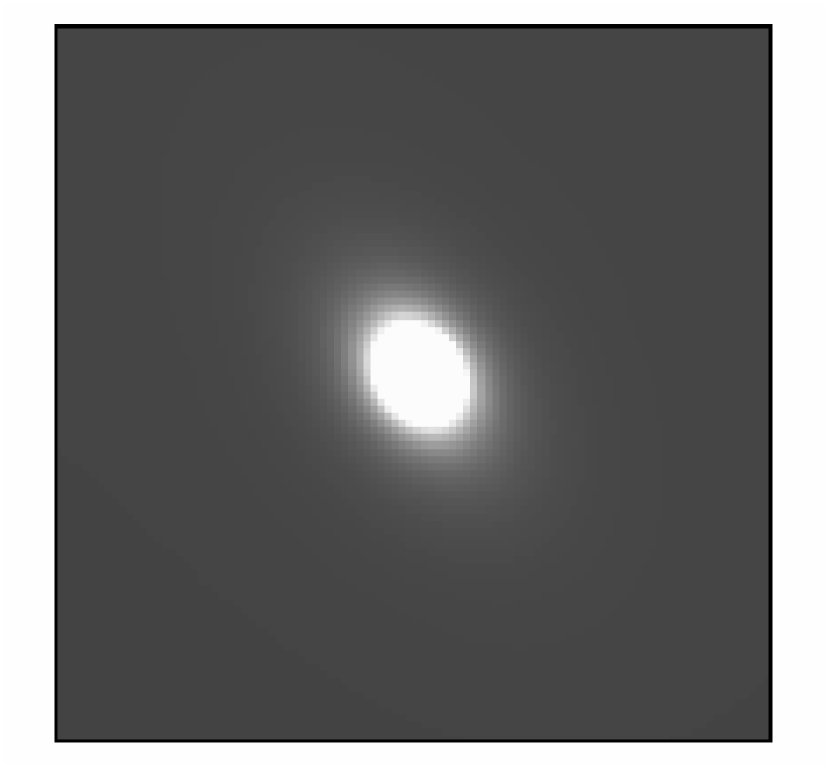
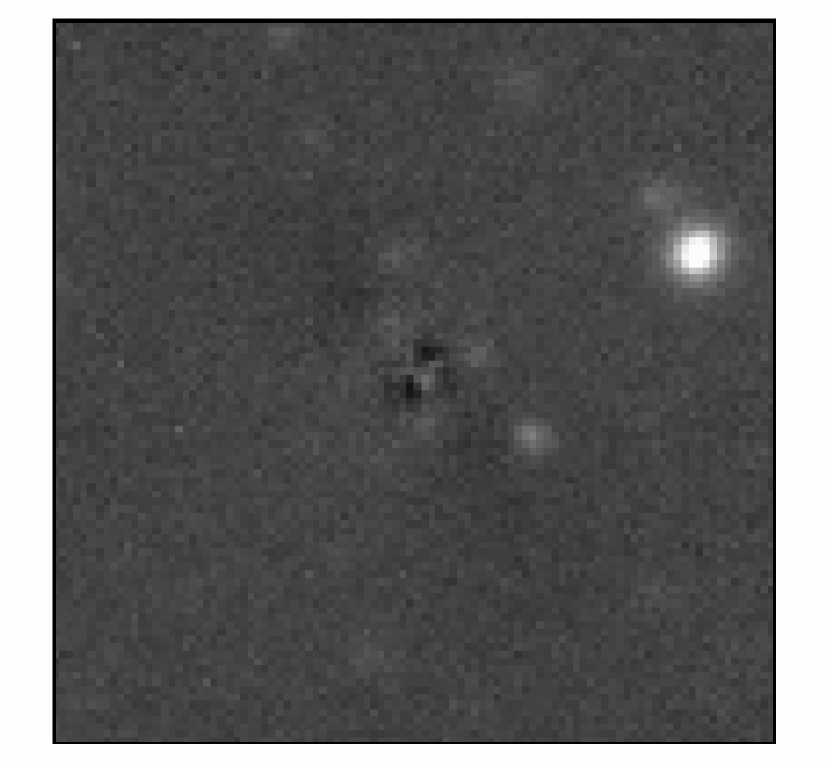
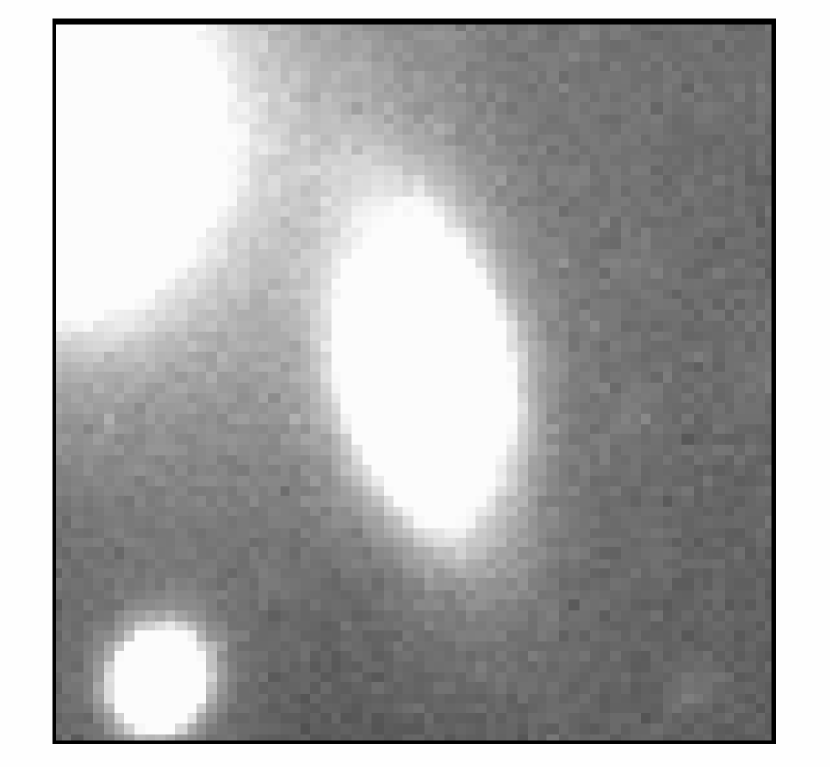
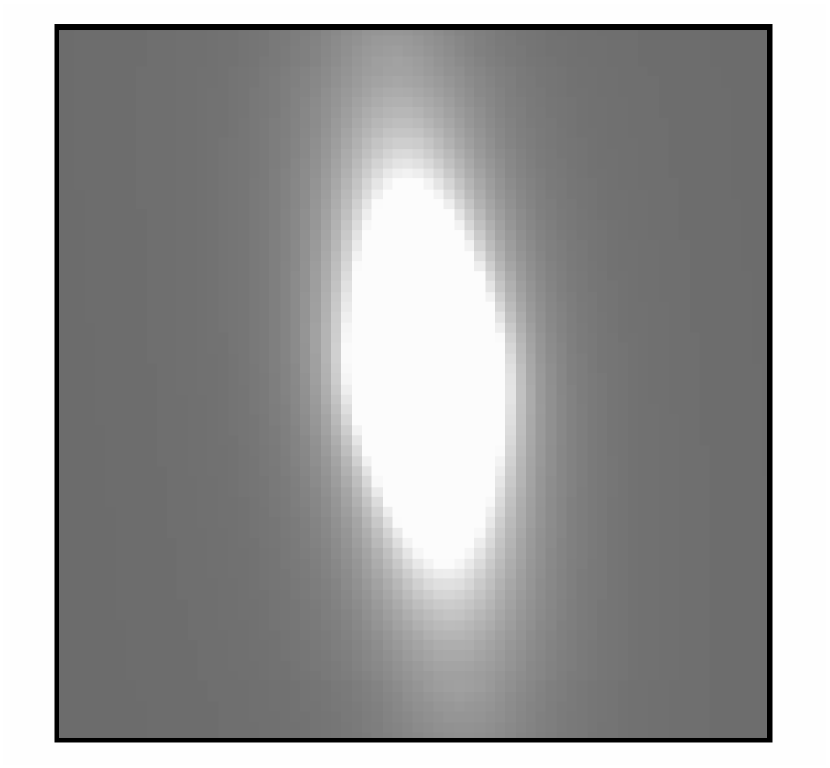
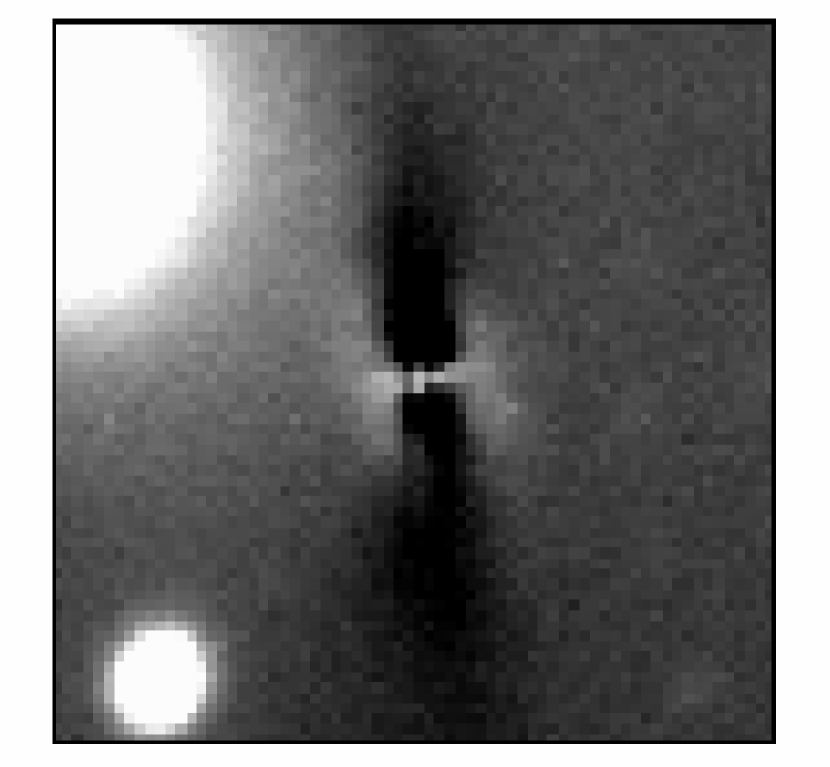
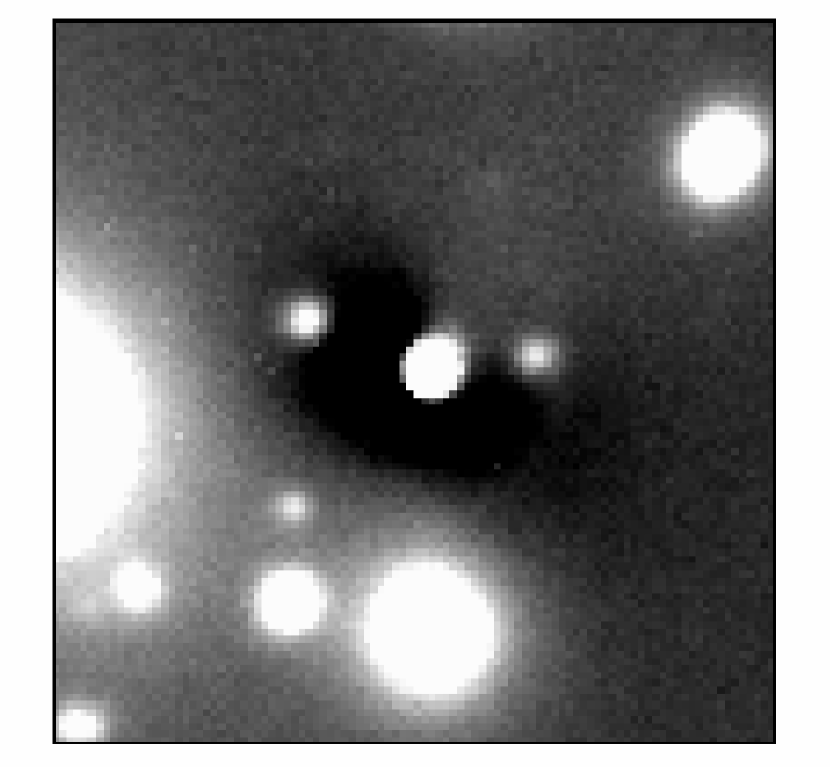
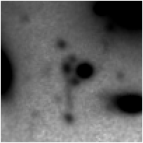
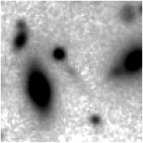
Figure 3 shows representative results of modeling 3 galaxies using Galfit: one isolated galaxy and two galaxies in increasingly dense regions. These examples show that the algorithms perform well for isolated galaxies, but fail for galaxies near the core due either to difficulty in deblending many overlapping galaxy profiles or because the individual galaxies in such dense regions do not follow simple analytical profiles. It is not clear what the profiles should be of galaxies deep in the potential wells of clusters (Trujillo et al., 2001; Feldmeier et al., 2004). The fact that A3888 is not a relaxed cluster clearly makes galaxy subtraction more difficult near the core than it would be in a CD cluster; A3888 has 3 main brightness peaks which contain 3, 7, and 12 galaxy cores in their densest regions, respectively.
As it is not possible to cleanly fit the galaxies in this cluster such that the residuals (positive or negative) do not interfere with the ICL measurement, we have chosen to mask the galaxies. This gives us a well defined measurement of the ICL at the expense of forfeiting some area. Although we could model and subtract the more isolated galaxies in the outer regions of the cluster, it is in these regions that we can generously mask the galaxies and still have enough pixels for an ICL measurement. Note that we do not replace masked pixels. Masked regions are simply removed entirely from the ICL measurement.
We use the same masks for both bands so that all galaxies are masked to the same radius, thereby insuring a self-consistent measurement of the ICL color. We use the band image to define the masks as it has a deeper detection threshold (and thus larger detection areas) than the band catalog. Objects are identified using SExtractor and masks are based on the isophotal detection area with a threshold of 26.4 mag arcsec-2( above sky). To be conservative in rejection, we scale the semi-major and semi-minor axes identified by SExtractor to increase the area of each galaxy mask by a multiplicative factor of , depending on the magnitude of the galaxy. To explore the effect of mask size on the profile shape of the ICL, we make two additional images with mask sizes that are 30% smaller and 30% larger than the original masks. We then measure the ICL three times with the three versions of mask sizes. Additional minor masking is done by hand to remove any remaining flux associated with resolved objects. These few regions are associated with small overlapping sources which are not correctly deblended by SExtractor.
The total masked area within the central 1.2 Mpc of the cluster in each of the three mask sizes is 34%, 41%, and 49%. The masked fraction is much higher in the very center of the cluster and reaches nearly 100% in the inner 30 arcseconds. The increase in masked fraction is not directly proportional to the increase in mask size because the masks often overlap. Figure 4 shows the final band image with intermediate-sized masks.
5.3. Cluster Membership & Flux
An interesting characteristic of the ICL lies in its comparison to cluster properties including the cluster galaxies themselves. We compare two methods below for measuring cluster membership and flux: (1) we identify member galaxies using our own 2-band photometry; and (2) we integrate the flux in a published galaxy luminosity function for this cluster.
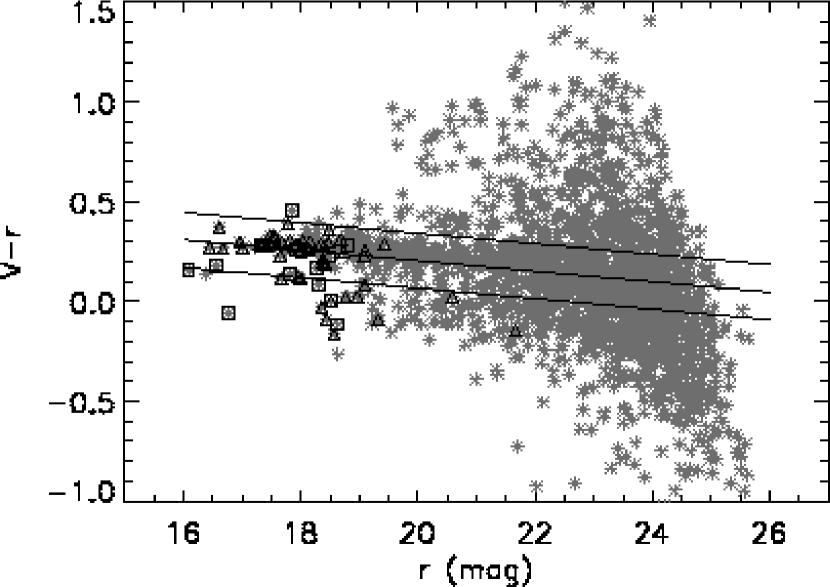
Some published velocities are available in the literature (Teague et al., 1990; Pimbblet et al., 2002) and can be used to explicitly identify member galaxies. However these redshift surveys are not complete to our detection threshold, and can therefore not provide membership information for all detected galaxies. Alternatively, we can estimate cluster membership using a color magnitude relation (Figure 5) from our and gunn- images. There is a clear red sequence of galaxies where the brightest galaxies have . Those galaxies which lie within 1 of a biweight fit to the red sequence are taken to be cluster members (functional form taken from Beers et al., 1990). The slope of the red sequence is 0.1 mags(color)/ 4mags(galaxy r magnitude). Those galaxies which are redder than the red sequence are both generally fainter implying that they are higher redshift background galaxies and are not as concentrated toward the center of the cluster as all galaxies. The number of those very red galaxies per projected area is higher within 400kpc than without. Although some of these galaxies are undoubtedly members of the cluster, their spatial distribution does not allow us to make conclusive statements about their membership. Approximately 42% of the galaxies in the image are identified as members by this method. Of the galaxies with spectroscopically determined velocities, 78% of the 55 confirmed members are included in the cut; 54% of the 13 known non-members are also included. The red cluster sequence is a good tool for identifying clusters, but it is not a perfect method of determining membership as it is unable to cleanly distinguish between member and non-member galaxies.
We measure the total flux in all galaxies identified as members using corrected isophotal magnitudes from SExtractor. For these, SExtractor assumes a Gaussian profile to infer the flux beyond the isophotal detection threshold, corresponding to 26.0 mag arcsec-2 and 26.4 mag arcsec-2. As expected, the corrected magnitudes are brighter than the isophotal magnitudes by a full magnitude at the faint end of our detection limit. The total flux in galaxies within 700h kpc center of the cluster, as determined from the same galaxy catalog that was used for galaxy masking, is 3.9 x L⊙ in the band and 4.9 x L⊙ in the band. We expect the error on the total flux from this estimate to be greater than 30% which is mainly due to uncertainty in the membership determination.
We can also determine cluster flux using the Driver et al. (1998) luminosity distribution for this cluster, which is based on a statistical background subtraction of non-cluster galaxies. It would be possible to do this with our own data, however Driver et al. (1998) have more uniform, large-area coverage to several magnitudes below at the redshift of the cluster. In addition, the authors pay careful attention to observing background fields which are up to 75′ from the cluster center, at approximately the same airmass, seeing, exptime, and UT as the cluster fields. Consequently, the background fields have the same noise characteristics and detection threshold as the cluster images, and sample the same large scale structures. They can therefore be used to reliably determine contamination of the cluster fields. Bernstein et al. (1995) gives a careful account of the significant considerations in using this method, all of which are taken into account by Driver et al. (1998).
We explore one minor effect not discussed by Driver et al. (1998): the effect of gravitational lensing on the background galaxy counts. There are two competing effects which change the number and brightness of galaxies behind the cluster as compared to background galaxy counts in an off-cluster field. First, magnification of the background galaxies will artificially inflate the background counts behind the cluster, resulting in an underestimation of cluster galaxy flux. Second, all background objects behind the cluster will appear radially more distant from the cluster center, which will artificially decrease the background counts, resulting in an overestimate of the cluster galaxy flux. The change from an overall magnification to de-magnification happens at . Following the method of Broadhurst et al. (1995) to determine the strength of the de-magnification for A3888 at z = 0.15, we find a negligible degradation in the and band flux (), and therefore do not correct for it in the Driver et al. (1998) background counts.
Driver et al. (1998) use their -band luminosity distribution to determine a dwarf to giant ratio, however we choose to fit it with a classical Schechter function ( = 0.71), which can then be used to determine a luminosity density for the cluster. We note that the luminosity distribution is not perfectly fit by a Schechter function at the bright end, due mainly to a small number of extremely bright galaxies, as is typical of clusters. Adopting a volume equal to that over which we are able to measure the ICL, 1.4 Mpc3, and integrating the luminosity function down to very faint dwarf galaxies, = -11, the total luminosity from galaxies in the cluster is L⊙ in the band. Given galaxy colors from Fukugita et al. (1995), the total luminosity from galaxies in A3888 is 3.4 L⊙ in and 4.3 L⊙ in the band. The difference between this value of total flux and that determined from our color–magnitude estimate of membership is likely due to uncertainties in our membership identification and difference in detection thresholds of the two surveys. Although the two estimates are generally consistent, we adopt the total flux as derived from the luminosity distribution throughout the remainder of the paper.
6. Results
6.1. Surface brightness profile
After subtracting the stars and masking the galaxies, we fit the resulting image with the IRAF routine ellipse, a 2D, interactive, isophote fitting algorithm. Again, the masked pixels are completely excluded in this procedure. There are 3 free parameters in the isophote fitting: center, position angle, and ellipticity. We fix the center ( J2000.0, ) and position angle (-70 degrees) to values found by ellipse based on the inner isophotes, and let the ellipticity vary as a function of radius. Fitted ellipticities range from 0.2 to 0.5. Allowing the center and position angle to vary results in worse fits. Stable fits are found from . From the fitted isophotes we identify a fairly smooth ICL profile over the range of 26 to approximately 29 mag arcsec-2. The error on the mean within each elliptical isophote is negligible, as discussed in §7. It is possible that the different seeing in the and band images could unevenly affect the profiles. To address this issue, the and band images have been convolved to the same seeing, and the surface brightness profiles re-measured. No significant change was found in the profiles.
Note that we are not able to measure the ICL at radii smaller than because that region is heavily masked. Most other ICL measurements focus on this inner region, leaving little overlap between this survey and previous work in other clusters. In clusters containing a cD galaxy, the diffuse component of the cluster has been found to blend smoothly into the cD envelope, and masking in the core of such clusters is not necessary (see most recently Gonzalez et al., 2005).
We identify the surface brightness profile of the total cluster light (ie., including resolved galaxies) for comparison with the ICL within the same radial extent. To do this, we make a new “cluster” image, with color-determined, non-member galaxies masked out (see §5.3). A surface brightness profile of the cluster light is then measured from this image using the same elliptical isophotes as were used in the ICL profile measurement. This profile, in contrast to the ICL, is quite irregular, reflecting the clustering of galaxies. Substructure in the galaxy distribution is an indication of a young dynamical age for this cluster.
Figure 6 shows the surface brightness profiles of the ICL as well as the total cluster light as a function of semi-major axis in both the and bands. Results based on all three versions of mask size (as discussed in §5.2.2) are shown. The uncertainty in the ICL surface brightness is dominated by the accuracy with which the background level can be identified, as discussed in §7. Error bars in Figure 6 show the cumulative uncertainties tabulated in Table 3.
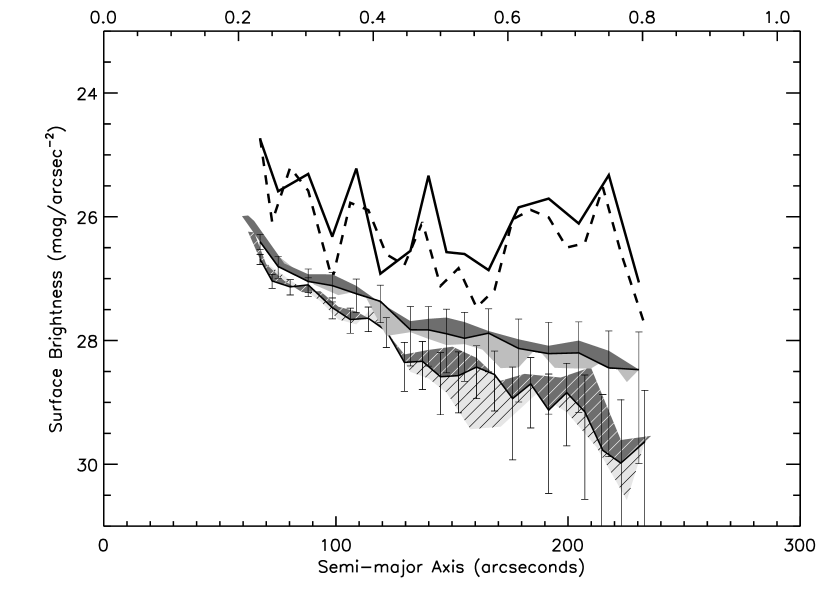
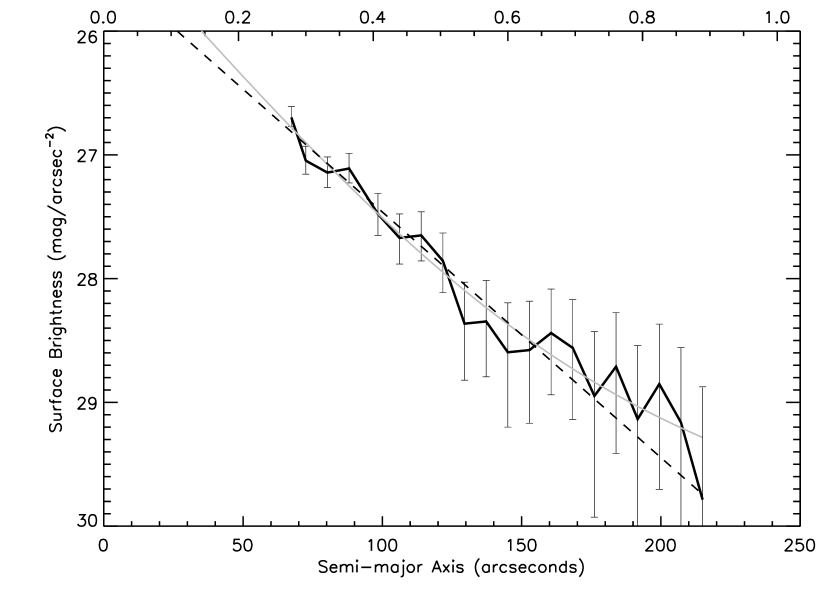
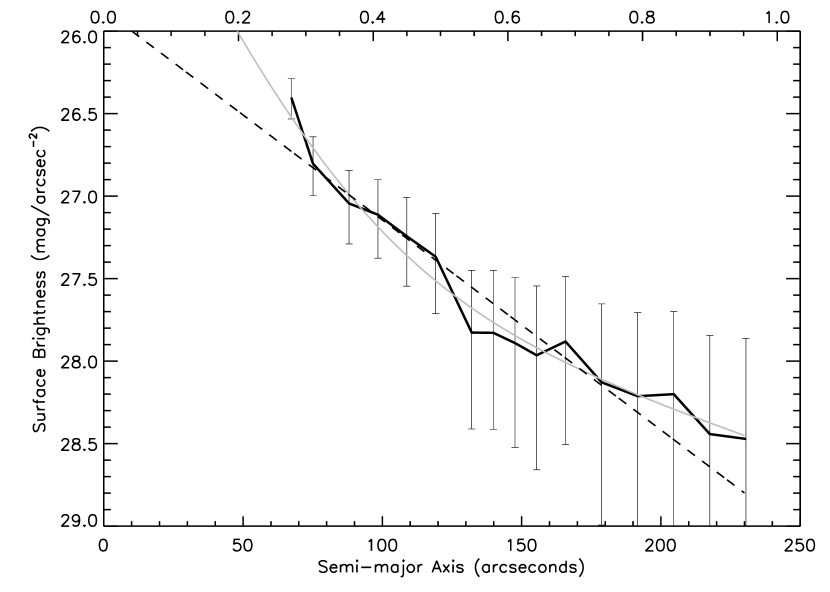
Two characteristics are evident from the surface brightness profiles. First, the inner region ( hkpc) has a notably steeper profile than the outer region. While the entire profile can be adequately described within the uncertainties by a single exponential, a double exponential gives a better fit in the band ( improves by ) and a marginally better fit in the band. These fits are shown in Figures 7 and 8. We have also fit the ICL profile with DeVaucouleurs and Sersic profiles. Acceptable fits can be found, however the best fit values are unphysical. Namely they have high exponents for the Sersic and unrealistically large effective radii for the DeVaucouleurs profiles. The second general characteristic of the ICL is that it is more concentrated than the galaxies, which is to say that the ICL falls off more rapidly with radius than the galaxy light.
6.2. Spatial Distribution
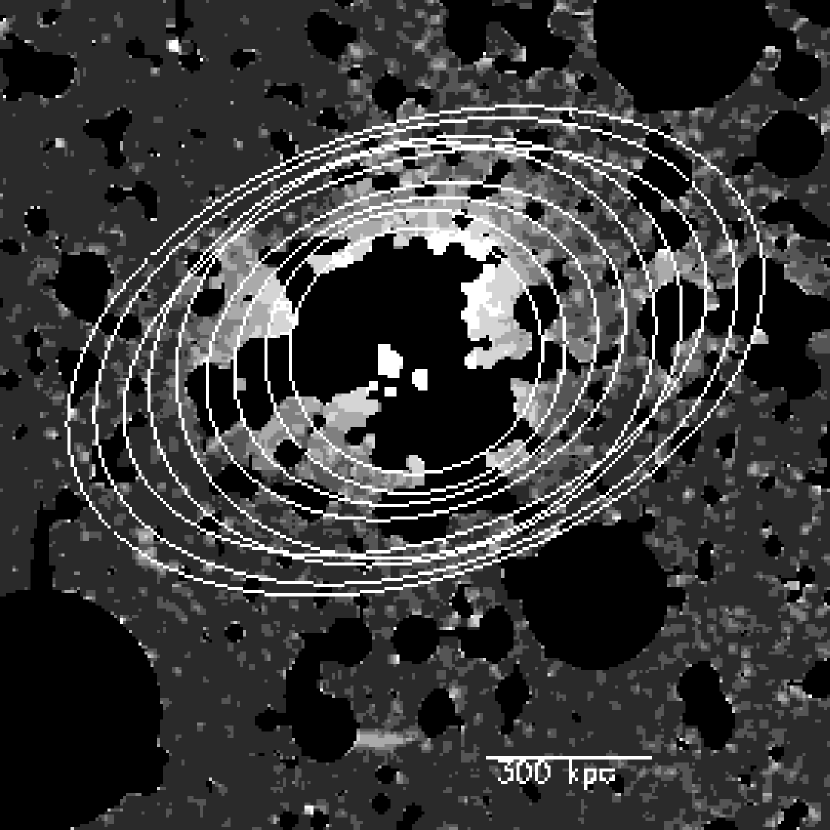
The ICL is aligned to within of the position angle of the hot intracluster gas. Figure 9 shows contours of XMM archival observations overlaid on our optical image. We interpret the alignment of the diffuse intracluster light with the hot gas in the cluster as an indication that we are indeed measuring light which follows the gravitational potential of the cluster. In addition, the ICL radial surface brightness profile is significantly different than the galaxy surface brightness profile in both and , suggesting that the intracluster light component is at least in part distinct from the individual galaxies in the cluster.
6.3. Color
We measure an average color of the ICL by binning together three to four points from the ICL radial profile. Between 200 and 400h kpc, the innermost measured radii, the diffuse ICL has an average color of . Beyond 400h kpc the ICL becomes increasingly redder, such that by 700h kpc the ICL has an average color of . The only characteristic color of the galaxies we have to compare with the ICL is the red sequence color (). We have no definitive membership information for those galaxies off the red sequence. The color of the ICL in the inner 400h kpc is roughly equivalent to the red ellipticals residing in the same part of the cluster, but significantly redder than several tidal features we detect (see §6.5). The color of the ICL beyond 400h kpc is redder than the red sequence galaxies. The color of the diffuse ICL can be approximated as a simple linear function of radius, with a slope of per 100h kpc and a y–intercept of . Figure 10 shows the color profile and corresponding error bars. While this fit is clearly simplistic, the data do not warrant a more complicated fit. This red color gradient is opposite that which we expect to find for the cluster galaxies. When looking at the color of galaxies as a function of distance from the center of the cluster, we find a flat or slightly blueward profile such that the galaxies get slightly bluer with increasing radius. Therefore the ICL color profile is distinct from the galaxy color profile.

Using the population synthesis models of Bruzual & Charlot (2003) we can obtain rough constraints on the age and metallicity of the stellar population which contributes to the ICL. Because the total range in color is not large and because the age-metallicity degeneracy limits our conclusions, we limit our discussion to two regions, h kpc and h kpc, rather than individual points along the full radial profile. The stellar evolution models begin with a starburst of user defined strength and extent, a Salpeter initial mass function, and a standard CDM Universe. The stars then evolve along the Padova 1994 spectral evolution tracks. Within this scheme, the simplest scenario is an instantaneous starburst with a single formation epoch and metallicity. For this case, the red color of the ICL in the outer kpc, , is consistent with a stellar population which formed at redshifts z (7 - 13 Gyr ago) with an initial abundance of . The color of the ICL in the inner 200-400h kpc, , allows the minimum age of that range to be lowered, where the most recent allowable formation is Gyr ago () with an initial abundance of 0.2 - 0.5 solar. Allowing an extended burst of duration 10 to 100 Myr has a minimal effect on the color. Allowing an exponentially decaying star burst with an e-folding time of 1Gyr, the population becomes overall 0.02 - 0.06 magnitudes bluer, depending on the initial formation redshift. For the ICL in A3888, an exponential star formation history therefore implies even higher metallicities or earlier formation. Finally, simulations with a constant star formation rate of yr create very blue stars. It is not possible to form a stellar population with a constant star formation rate which has . Implications of these models are discussed further in §8.1.
6.4. Fractional Flux
The ratio of ICL flux to total cluster flux can help constrain the importance of galaxy disruption in the evolution of clusters. To identify the total flux in the ICL, we integrate the single exponential fit to the ICL surface brightness profile (see §6.1) over the range 0–200″(h kpc). As we are not able to measure the ICL at radii smaller than , this requires an extrapolation into the center of the cluster. Note that the single exponential fit, which is dominated by the slope of the ICL profile at larger radii, gives significantly less light in the core than the double exponential fit (see Figures 7 and 8), and is therefore a conservative estimate of ICL flux. The total flux in the intracluster light is then L⊙ in and L⊙ in , where these errors are the full errors as described in §7. This value is equivalent to the full disruption of roughly galaxies.
We consider 4 modifications to this estimate of the total ICL flux. First, we consider a correction for that volume of the cluster which is filled with galaxies, since no ICL can exist in that volume. While lines of sight intersect galaxies over most of the area near the center of the cluster, the galaxy filling factor is less than 3% by volume, even inside 200h kpc (60 arcsec, projected). So it is reasonable to assume that intracluster stars do exist in that volume and we need make no correction for the filled volume. Second, we can determine a hard lower limit to the ICL flux by assuming that there is no ICL in the inner 60″. This correction, albeit extreme, would decrease our estimate of the total ICL flux by 30%. Third, we make a less extreme correction by assuming a flat core region instead of the exponential extrapolation. A flat profile is suggested by Aguerri et al. (2005), although those results are in Virgo, where the center of the ICL is not defined and the measurement is based on small area coverage, which does not allow for an elliptical profile determination. A flat core region would decrease our estimate of the total ICL flux by 5%. Fourth, we consider low surface brightness galaxies below our detection threshold which could contribute to, and therefore be an error in, the inferred ICL flux. To account for these very faint galaxies, we integrate the cluster galaxy luminosity function from our detection limit ( = -15.22) to = -11.0. Due to the extremely low detection threshold of this survey (7.6 magnitudes below ), and the apparently flat faint end of the luminosity function (, see §5.3), only 0.07% of the total galaxy flux could come from galaxies this faint. As this contribution is not significant, we make no correction for this effect.
Adopting the total galaxy flux found from the luminosity function in §5.3, we find that the ICL accounts for of the total band cluster light and of the band cluster light within 700h kpc of the center of the cluster. The range in these values comes from the combination of all uncertainties in the ICL measurement coupled with the uncertainty in the total cluster flux, as discussed in §7. The galaxy light and the ICL decrease with radius, but since we don’t accurately know the slope of either of them at large radii, we compare fluxes within the same volume over which we have reliable data. This fraction is only relevant at this radius, and is likely to be lower when taking into account the entire virial radius of the cluster, since the ICL is centrally concentrated and not evenly distributed throughout the cluster. On the same note, ICL measurements at smaller radii are likely to find a higher fraction of the total flux in the ICL because of the steep ICL profile, and because the volume involved is much smaller. For example, if we assume we can only measure the ICL in the inner 600h instead of 700hkpc, we find a fractional flux of 19% in both and , an almost 50% increase over the measured 13%.
6.5. ICL Substructure
Using the technique of unsharp masking, we find 3 possible tidal features, all within the central h kpc of A3888, identified as A, B, and C in Figure 11. Arcs A and B are both roughly hkpc hkpc and are near to the center of the cluster. Arc C is a diffuse, tail-like feature at hkpc from the center and covers hkpc hkpc (see Table 2). All three features are blue, , with a combined flux equivalent to one magnitude galaxy (0.1). These objects are unlikely to be gravitational arcs since they are not oriented tangentially to the cluster potential.
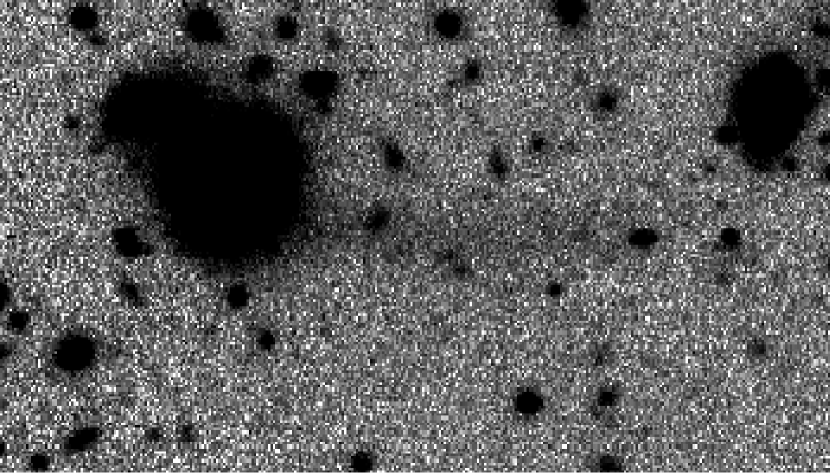
The diffuse nature of the large feature, C, suggests that it is tidal. This object is very similar to the large arcs found in Coma, Centaurus, and A1914 (Gregg & West, 1998; Calcáneo-Roldán et al., 2000; Feldmeier et al., 2004), which are included in Table 2 for reference. In general it is of similar size to, but slightly fainter than, those found in the other clusters. It has slight curvature and appears to connect to a pair of galaxies (left side of the image as displayed) that could be in the midst of an interaction. Both Calcáneo-Roldán et al. (2000) and Feldmeier et al. (2004) find through numerical simulations that these types of arcs are typical of recent tidal interactions between luminous spiral galaxies and massive cluster ellipticals. Spectroscopy to confirm its origin at this faint surface brightness is not currently possible.
| Object | radial distance | length | width | MV | Mr | |||
|---|---|---|---|---|---|---|---|---|
| hkpc | hkpc | hkpc | mag arcsec-2 | mag arcsec-2 | ||||
| A | 66 | 17 | 5 | -0.05 | -18.5 | -18.5 | 24.6 | 24.5 |
| B | 155 | 15 | 5 | 0 | -18.1 | -18.1 | 25.3 | 24.9 |
| C | 720 | 132 | 20 | 0.03 | -20.5 | -20.5 | 26.4 | 26.7 |
| Coma1 | 100 | 130 | 15-30 | 0.57(R) | -18.8 | -19.4(R) | 26.9 | 26.3(R) |
| Centaurus2 | 170 | 171 | 1 | -14.8(R) | 26.1(R) | |||
| A19143 | 75 | 160 | 30 | 26.1 |
We cannot rule out the possibility that the 2 smaller features in our 0.06 degree-2 of cluster imaging are low surface brightness (LSB) galaxies seen edge-on. In field surveys, surface densities of the dimmest LSB galaxies ( mag arcsec-2) are at least 0.01 galaxies degree-2 (Dalcanton et al., 1997). In clusters, although there are overall higher space densities of galaxies, LSB galaxies run the risk of getting tidally disrupted in the harsh environment of cluster centers. In a survey of the Cancer and Pegasus clusters, O’Neil et al. (1997) find 1.6 galaxies per square degree with central surface brightness dimmer than 21.2 in . The 2 candidates with average surface brightnesses of roughly 25mag arcsec-2 in in this cluster represent a higher density than found in these surveys. In addition, they do not have clear centers. Both of these facts suggest that they are not LSB galaxies. However, it is likely that even if these are LSB galaxies, they will not remain bound systems for long in the high density cluster environment, and we therefore consider them to be contributors to the ICL in the following calculation.
We briefly examine the importance of all three tidal features in contributing to the ICL over a Hubble time to see if they can account, in whole or in part, for the ICL found in the cluster. Cluster crossing time is estimated to be 4.5 Gyr given a virial radius of 3.7 Mpc and a temperature of 10KeV (Reiprich & Böhringer, 2002). We assume both a constant rate of formation, and dissipation of tidal features in approximately 1 crossing time. From this we conclude that in 1 Hubble time, approximately one half of an galaxy will be contributed to the ICL through the visible tidal features such as these. This simple calculation suggests that these features cannot account for the current ICL flux, however it is feasible that there was a variable interaction rate in the history of this cluster. Further substructure could also be hidden below our surface brightness detection threshold.
At the distance of A3888, the flux of a single globular cluster ( mag) spread over one seeing disk (3.5kpc)is many magnitudes below our surface brightness detection threshold. Therefore we are not sensitive to intracluster globular clusters which have been studied by other groups in nearby clusters (Jordán et al., 2003; Bassino et al., 2003; Hilker, 2003; Marín-Franch & Aparicio, 2003).
6.6. Group
In addition to the main cluster ICL, we detect excess diffuse light around a group of galaxies which are 1.35hMpc from the center of A3888, (J2000) . There are two galaxies centered in this diffuse component, separated by only 2″. The spatial extent of the group appears to be 200h kpc, within which there are 60 galaxy peaks detected by SExtractor. Independent of the ICL component, the group is identified in the density distribution of cluster. Velocities are available only for the central galaxies in the group, however these suggest that the group is co-spatial with A3888 (Pimbblet et al., 2002; Teague et al., 1990). Within the 200h kpc extent of the group, we find L⊙ in and L⊙ in above background, which is equivalent to approximately of an galaxy.
The average color of this diffuse component based on total flux within 200h kpc is , which is again redder than the cluster galaxies and consistent with the color of the main cluster ICL at large radii. The accuracy of the fluxes and hence the colors is limited by the accuracy in masking since it is a simple sum over the pixels in the group region. We estimate the error in masking to be less than 30% based on our work with varying the mask size (see §6.1 and Table 3).
This secondary ICL concentration is consistent with galaxy interactions and ram pressure stripping occurring in an in-falling group (“pre-processing”). Such pre-processing has been shown in simulations to affect galaxies before they fall into the main cluster potential (Willman et al., 2004; Fujita, 2004, and references therein). This is also consistent with recent measurements of a small amount of ICL in isolated galaxy groups (Castro-Rodríguez et al., 2003; Durrell et al., 2004).
| Source | contribution to ICL uncertainty (%) | |||||||
|---|---|---|---|---|---|---|---|---|
| uncertainty | (0″- 100″) | (100″- 200″) | total ICL flux | |||||
| () | () | () | () | () | () | () | () | |
| background levela | 29.5 mag arcsec-2 | 28.8 mag arcsec-2 | 14 | 18 | 39 | 45 | 24 | 31 |
| photometry | 0.02 mag | 0.03 mag | 2 | 3 | 2 | 3 | 2 | 3 |
| maskingb | variation in mask area | 5 | 5 | 14 | 19 | 9 | 12 | |
| std. dev. in meanc | 32.7 mag arcsec-2 | 32.7 mag arcsec-2 | 3 | 2 | 2 | 1 | 3 | 1 |
| (total) | 15 | 19 | 41 | 50 | 26 | 33 | ||
| cluster fluxd | 16% | 16% | ||||||
Note. — a: Large scale fluctuations in background level are measured empirically and include instrumental calibration uncertainties as well as and true variations in background level (see §7). b: Object masks were scaled by in area to test the impact on ICL measurement (see §5.2.2). c: The statistical uncertainty in the mean surface brightness of the ICL in each isophote. d: Errors on the total cluster flux are based on errors in the fit to the luminosity function (see §5.3).
7. Accuracy Limits
The accuracy of the ICL surface brightness is limited on small scales () by photon noise. On larger scales (), structure in the background level (be it physical on the sky or instrumental) will dominate the error budget. We determine the stability of the background level in the image on large scales by first median smoothing the masked image by 75″. We then measure the mean flux in thousands of random 1″ regions more distant than 0.8 Mpc from the center of the cluster. The standard deviation of these regions is 29.5 mag arcsec-2 in (0.06% of sky), and 28.8 mag arcsec-2 in (0.01% of sky). Histograms with gaussians overlaid are shown in Figures 12 & 13. The histograms are not perfect gaussians. This is likely due to the fact that the background level includes both a symmetric gaussian and positive sources which are below the detection threshold. The offset of the gaussian portion of the histogram represents the statistical difficulty in measuring the mean value of the background in any one image. Regions from all around the frame are used to check that our accuracy limit is universal across the image and not affected by location in the frame. This empirical measurement of the large-scale fluctuations across the image is dominated by the instrumental flat-fielding accuracy, but includes contributions from the bias and dark subtraction, physical variations in the sky level, and the statistical uncertainties mentioned above.


This empirical measurement of the large–scale background fluctuations is likely to be a worst–case estimate of the accuracy with which we can measure surface brightness on large scales because it is derived from the outer regions of the image where only 6-10 individual exposures have been combined. In the central regions of our imaging (h kpc), roughly twice as many dithered images have been combined, which has the effect of smoothing out large-scale fluctuations in the illumination pattern to a greater degree. We therefore expect greater accuracy in the center of the image where the ICL is being measured.
All sources of uncertainty are listed in Table 3. In addition to dominant uncertainty from our ability to measure the large-scale fluctuations on the background as discussed above, we quantify the contributions from the photometry, masking, and the accuracy with which we can measure the mean in the individual elliptical isophotes. In total the error on the ICL flux is 26% in V and 33% in r, which in addition to a 16% error in the total cluster flux, leads to a 30–40% uncertainty in the fractional flux.
8. Discussion
We measure a diffuse intracluster component in A3888 to a radius of h kpc in the and band down to 28.9 mag arcsec-2 and 28.2 mag arcsec-2 respectively. We discuss here the physical implications of color, total flux, and profile shape of the ICL.
8.1. Color Implications
Color information can place constraints on the age and metallicity of the progenitor population of the ICL, thereby shedding light on the dominant physical mechanisms and timescales for galaxy disruption. Color information may also be able to differentiate between the morphological types of progenitor galaxies.
The color of the ICL in A3888 is consistent with some previous observational results in other clusters, although those results vary widely. Schombert (1988) and Mackie (1992) have found a wide range of results for cD envelopes, from blue to red, with and without color gradients. These surveys have typically been sensitive to a diffuse component within 100-150h kpc, a much smaller radial extent than this survey. Recently, Gonzalez et al. (2000) have found a mild color gradient where the ICL becomes redder with radius by from 10 to 70kpc. Again, our observations cover a much larger radial region of A3888 and we have no information on the ICL in the core region because it contains several complicated, unmerged clumps. Over a similar range in radius to our measurement, Zibetti et al. (2005), from a stack of hundreds of SDSS clusters, find an ICL including the BCG which is similar in color to the galaxy light and has a flat or slightly blue color gradient with radius.
If the ICL is composed of stars stripped from galaxies, its color relative to the galaxies is indicative of the epoch when it was stripped in the following sense. If the ICL is redder than the cluster galaxies, it is likely to have been stripped from the galaxies at early times (higher z). Stripped stars will passively evolve toward red colors, while the galaxies will continue to form stars. If, on the other hand, the ICL is of similar color to the average galaxy, the ICL is likely to have formed from the ongoing stripping of stars (via harassment as in Moore et al., 1996). In this case the stripped stars should have roughly the same color at the current epoch as the galaxies at the current epoch. This picture is complicated by the fact that clusters are not made up of galaxies which were all formed at a single epoch and that we don’t know the star formation rates of galaxies once they enter a cluster. While these simple trends hold for the colors of intracluster stars compared to galaxies, the color difference between passively evolving stars and low star forming galaxies may not be large enough to detect.
Cluster evolution is complex due to a myriad of environmental influences. Several groups have produced hierarchical, CDM simulations of clusters which include radiative cooling, star formation, and various feedback mechanisms, but differ primarily in star formation prescriptions and numerical resolution. These models can be divided based on their broad, empirical predictions for the color/formation epoch of the ICL.
Theoretical models in which the ICL forms early in the cluster history all suggest an ICL which is older, redder than the galaxy population because the galaxies continue to form new stars and therefore have younger mean ages than the ICL population (Dubinski, 1998; Murante et al., 2004; Sommer-Larsen et al., 2005). This is generally consistent with our results in the outer regions of A3888. Specifically, Sommer-Larsen et al. (2005) predict a slight color gradient in such that the ICL becomes 0.1 magnitudes bluer from 0 to 600h kpc, while our data suggest the opposite trend with radius in .
Theoretical models in which the ICL forms throughout the cluster lifetime generally predict a younger, bluer intracluster stellar population (Willman et al., 2004; Moore et al., 1999; Gnedin, 2003; Bekki et al., 2001) since more recent stripping will have the chance to pull newly formed stars out of galaxies. Ongoing stripping is consistent with our results within about 400h kpc, where the ICL is roughly the same color or slightly bluer than the red cluster sequence. In an N-body + SPH simulation, Willman et al. (2004) find that 50% of intracluster stars come from or brighter galaxies, which means the color of the intracluster stars should be in accord with the color of the outskirts of bright cluster galaxies or equivalently the color of intermediate luminosity galaxies. The intermediate luminosity galaxies which we consider members of A3888 have a color in the range of . Our results are consistent with this prediction in the inner regions of the cluster.
Recent observations of some intracluster HII regions (such as those found in Virgo by Gerhard et al., 2002; Ryan-Weber et al., 2004; Cortese et al., 2004) indicate that it may be possible for some intracluster stars to form in situ. In this case, the ICL color will still depend on the formation epoch. If the ICSP is just now forming in intracluster HII regions (such as those found in Virgo by Gerhard et al., 2002; Ryan-Weber et al., 2004; Cortese et al., 2004) then it will be blue, however if it formed earlier in cluster formation, then the ICSP will passively evolve toward redder colors. Only if the ICL were significantly bluer than the existing cluster galaxies could it be possible to definitively state from the color that a significant fraction of the ICL formed in situ. Since this is not the case in A3888, our results cannot constrain the formation site of the ICL.
Using N-body simulations, both Moore et al. (1999) and Gnedin (2003) find that low density galaxies (LSB and dwarf galaxies) are the main contributers to the ICL. LSB galaxies in Sloan data have a color range of (Kniazev et al., 2004) which corresponds to . Dwarf galaxies in Coma have (Trentham, 1998). This range is sufficiently broad that it is consistent with the ICL at all radii in A3888, implying that the ICL could have origins in LSB or dwarf galaxies.
In summary, the ICL in the outer regions of A3888 is consistent with the predictions for a stellar population which formed at redshifts higher than 1 and is significantly metal-rich, implying an ICL which forms early with the collapse of the main cluster. The ICL in the center of A3888 (rhkpc) is consistent with predictions for a relatively younger population. This implies that within some core radius harassment type interactions are the dominant mechanism.
8.2. Fractional Flux Implications
Another clue to the dominant mechanism driving evolution in clusters comes from correlating ICL properties with the properties of the parent cluster. For example, a trend in ICL fraction with cluster mass but not redshift, richness, or morphology would indicate that mass was the dominant mechanism which could predict ICL fraction. The calculation of the fractional ICL flux depends on many observational parameters including the surface brightness and radial limit of the ICL measurement itself; the surface brightness at which individually bound, resolved sources are distinguished from the ICL; and the volume over which the ICL flux and galaxy flux are measured. As these parameters vary widely in work by previous groups, it is difficult to make meaningful comparisons with results for other clusters in the literature. In addition, A3888 is a very massive cluster, and is not as simple as clusters with a cD or clear brightest cluster galaxy (BCG). A1914 is the only cluster with an ICL measurement (Feldmeier et al., 2004) which has overall similar characteristics to A3888. With similar detection limits to those employed here, those authors find an ICL fraction of 7% in the band, which is generally consistent with our results for A3888.
With these observational complications and cluster parameters in mind, we can only generally conclude that previous measurements of the ICL in clusters over a wide range in redshift () and mass (M⊙) are roughly 10%. There are no obvious trends with mass or redshift, although there are some noteworthy outliers at 50% for Coma (Bernstein et al., 1995) and 0% for A1689 (Gudehus, 1989). The Bernstein et al. (1995) result covers a small radial extent and is therefore biased toward higher fractional flux values. It is difficult to interpret the Gudehus (1989) measurement due to disparate methods. There is a some evidence that the ICL fraction is dependent upon cluster morphology; B/M type I clusters (Theuns & Warren, 1997; Feldmeier et al., 2002; Uson et al., 1991; Vilchez-Gomez et al., 1994) have a reported average ICL fraction which is marginally higher than those with B/M type III (Vilchez-Gomez et al., 1994; Feldmeier et al., 2004; Arnaboldi et al., 2003; Ferguson et al., 1998; Durrell et al., 2002). However poor morphological classification, small number statistics, and widely disparate methods and accuracies among the different measurements make any possible trends difficult to quantify.
In comparing the observed ICL with simulations, it is important to note that the simulations generally report the fractional light in the ICL out to much larger radii (e.g., ) than its surface brightness can be measured observationally. At smaller radii, the predicted ratio of ICL to galaxy light would be larger. Bearing this in mind, Willman et al. (2004) finds a lower limit for fractional flux in the ICL of 10-22% at for a Virgo-like cluster from (increasing fractional flux with time). At the maximum radius of our ICL measurement (), the fraction would presumably be higher by at least a factor of two, making it larger than we observe in A3888. Other predictions are similarly high. For a cluster with the mass of A3888 ( M⊙), both Lin & Mohr (2004) and Murante et al. (2004) predict an ICL fraction in excess of 40%. To be consistent with their predictions, this cluster would require a factor of greater than 100 lower mass to have only 10% ICL, and although this cluster is not dynamically relaxed, such large erros in mass are not realistic.
In summary, we find an ICL fraction which is roughly compatible with observed ICL measurements in other clusters. However, our measurement differs significantly from theoretical estimates, particularly considering A3888’s large total mass. The dynamical state of A3888 may contribute to this discrepancy, as morphology may have a significant influence over ICL fraction. We emphasize again that A3888 is not a relaxed cluster; it does not have a cD galaxy and it’s X-ray isophotes are not circular. If we have caught this cluster as it is just now entering its major merger phase, we would expect a low ICL fraction as compared with a cluster at this redshift, mass, and richness which had already reached dynamic equilibrium. In contrast, when examining Coma, a cluster with an extremely high ICL fraction but lower mass, we note that it’s morphology indicates that it has already undergone significant merging to produce 2 cD-like galaxies. If morphology is the dominant influence on ICL flux, we should find A3888 to have a similar ICL fraction to other clusters with similar morphologies. Comparable measurements of the ICL in our remaining sample will help to resolve this issue.
8.3. Profile Shape Implications
As discussed in §6.1, the profile of the ICL is generally stepper at smaller radii. In particular, the steepening profile near the core region of the cluster is associated with the 3 apparently merging groups of galaxies in the center of the cluster. The recent interactions in the center have likely added and continue to add ICL, which is likely to eventually relax into a BCG and BCG halo. The profile in the outer region of the cluster is consistent with previous measurements of BCG envelopes which follow shallower profiles (Gonzalez et al., 2005). In addition, Bernstein et al. (1995) and Zibetti et al. (2005) find a steeper profile for the Coma cluster and for a stacked profile of hundreds of Sloan clusters. This steeper profile is consistent with some theoretical predictions, particularly by Murante et al. (2004) based on a hydrodynamical simulation including radiative cooling, star formation, and supernova feedback.
9. Conclusion
We have presented results for the first of ten clusters in our sample. We have identified an intracluster component in A3888 to h kpc from the center of the cluster down to mag arcsec-2 in the and mag arcsec-2 in gunn- band. This ICL component is aligned with the hot gas in the cluster, which is evidence of its correlation with the underlying mass distribution. There is a second diffuse component around a group of galaxies 1.4hMpc from the center of the cluster which is consistent with pre-processing in an in-falling group. In addition to these two diffuse ICL components, we find 3 low surface brightness features consistent with being remnants from tidal interactions.
Beyond 400hkpc from the center of the cluster, the ICL is redder than the galaxies, implying an older population of stars. Inside of 400hkpc the ICL has a similar color to the galaxies. We interpret this color gradient in the ICL (, from inner to outer) as evidence of younger intracluster stars in the center of the cluster. Consequently, we suggest that more than one process is likely stripping stars from cluster galaxies. Specifically, harassment type interactions are still ongoing in the center of the cluster while galaxy mergers may have played a significant role earlier in the history of the cluster.
We find that the ICL component in A3888 does not follow the same light profile as the resolved sources, but has a smoother and slightly steeper profile than the galaxies. Due to a steepening profile within 400h kpc, the ICL profile can be described by a double exponential function. A double profile is consistent with ongoing dynamical activity in the center of this cluster producing a new population of intracluster stars.
Comparing the ICL to cluster galaxy flux, we find that the ICL component in A3888 accounts for roughly of the total cluster flux within 700h kpc (). This value is low compared to the theoretical predictions for a cluster of this mass, and may be partly due to the fact that A3888 appears to be a dynamically young cluster. The ICL in A3888 will likely increase with time due both to contributions from an in-falling group as well as through major mergers in the center to create a cD galaxy.
References
- Abell et al. (1989) Abell, G. O., Corwin, H. G., & Olowin, R. P. 1989, ApJS, 70, 1
- Aguerri et al. (2005) Aguerri, J. A. L., Gerhard, O. E., Arnaboldi, M., Napolitano, N. R., Castro-Rodriguez, N., & Freeman, K. C. 2005, AJ, 129, 2585
- Allen et al. (2004) Allen, S. W., Schmidt, R. W., Ebeling, H., Fabian, A. C., & van Speybroeck, L. 2004, astro-ph/0405340
- Arnaboldi et al. (2003) Arnaboldi, M., Freeman, K. C., Okamura, S., Yasuda, N., Gerhard, O., Napolitano, N. R., Pannella, M., Ando, H., Doi, M., Furusawa, H., Hamabe, M., Kimura, M., Kajino, T., Komiyama, Y., Miyazaki, S., Nakata, F., Ouchi, M., Sekiguchi, M., Shimasaku, K., & Yagi, M. 2003, AJ, 125, 514
- Arnaboldi et al. (2004) Arnaboldi, M., Gerhard, O., Aguerri, J. A. L., Freeman, K. C., Napolitano, N. R., Okamura, S., & Yasuda, N. 2004, ApJ, 614, L33
- Bassino et al. (2003) Bassino, L. P., Cellone, S. A., Forte, J. C., & Dirsch, B. 2003, A&A, 399, 489
- Batuski et al. (1999) Batuski, D. J., Miller, C. J., Slinglend, K. A., Balkowski, C., Maurogordato, S., Cayatte, V., Felenbok, P., & Olowin, R. 1999, ApJ, 520, 491
- Beers et al. (1990) Beers, T. C., Flynn, K., & Gebhardt, K. 1990, AJ, 100, 32
- Bekki et al. (2001) Bekki, K., Couch, W. J., & Drinkwater, M. J. 2001, ApJ, 552, L105
- Bernstein et al. (1995) Bernstein, G. M., Nichol, R. C., Tyson, J. A., Ulmer, M. P., & Wittman, D. 1995, AJ, 110, 1507
- Bertin & Arnouts (1996) Bertin, E. & Arnouts, S. 1996, A&AS, 117, 393
- Broadhurst et al. (1995) Broadhurst, T. J., Taylor, A. N., & Peacock, J. A. 1995, ApJ, 438, 49
- Bruzual & Charlot (2003) Bruzual, G. & Charlot, S. 2003, MNRAS, 344, 1000
- Busarello et al. (2002) Busarello, G., Merluzzi, P., La Barbera, F., Massarotti, M., & Capaccioli, M. 2002, A&A, 389, 787
- Calcáneo-Roldán et al. (2000) Calcáneo-Roldán, C., Moore, B., Bland-Hawthorn, J., Malin, D., & Sadler, E. M. 2000, MNRAS, 314, 324
- Castro-Rodríguez et al. (2003) Castro-Rodríguez, N., Aguerri, J. A. L., Arnaboldi, M., Gerhard, O., Freeman, K. C., Napolitano, N. R., & Capaccioli, M. 2003, A&A, 405, 803
- Chen et al. (1998) Chen, J., Huchra, J. P., McNamara, B. R., & Mader, J. 1998, Bulletin of the American Astronomical Society, 30, 1307
- Ciardullo et al. (1985) Ciardullo, R., Ford, H., & Harms, R. 1985, ApJ, 293, 69
- Collins et al. (1995) Collins, C. A., Guzzo, L., Nichol, R. C., & Lumsden, S. L. 1995, MNRAS, 274, 1071
- Cortese et al. (2004) Cortese, L., Gavazzi, G., Boselli, A., & Iglesias-Paramo, J. 2004, A&A, 416, 119
- Couch et al. (2001) Couch, W. J., Balogh, M. L., Bower, R. G., Smail, I., Glazebrook, K., & Taylor, M. 2001, ApJ, 549, 820
- Couch & Newell (1984) Couch, W. J. & Newell, E. B. 1984, ApJS, 56, 143
- Couch & Sharples (1987) Couch, W. J. & Sharples, R. M. 1987, MNRAS, 229, 423
- Dalcanton et al. (1997) Dalcanton, J. J., Spergel, D. N., Gunn, J. E., Schmidt, M., & Schneider, D. P. 1997, AJ, 114, 635
- De Filippis et al. (2004) De Filippis, E., Bautz, M. W., Sereno, M., & Garmire, G. P. 2004, ApJ, 611, 164
- De Propris et al. (2002) De Propris, R., Couch, W. J., Colless, M., Dalton, G. B., Collins, C., Baugh, C. M., Bland-Hawthorn, J., Bridges, T., Cannon, R., Cole, S., Cross, N., Deeley, K., Driver, S. P., Efstathiou, G., Ellis, R. S., Frenk, C. S., Glazebrook, K., Jackson, C., Lahav, O., Lewis, I., Lumsden, S., Maddox, S., Madgwick, D., Moody, S., Norberg, P., Peacock, J. A., Percival, W., Peterson, B. A., Sutherland, W., & Taylor, K. 2002, MNRAS, 329, 87
- den Hartog (1995) den Hartog, R. 1995, Ph.D. Thesis
- Domainko et al. (2004) Domainko, W., Gitti, M., Schindler, S., & Kapferer, W. 2004, A&A, 425, L21
- Driver et al. (1998) Driver, S. P., Couch, W. J., & Phillipps, S. 1998, MNRAS, 301, 369
- Dubinski (1998) Dubinski, J. 1998, ApJ, 502, 141
- Durrell et al. (2002) Durrell, P. R., Ciardullo, R., Feldmeier, J. J., Jacoby, G. H., & Sigurdsson, S. 2002, ApJ, 570, 119
- Durrell et al. (2004) Durrell, P. R., Decesar, M. E., Ciardullo, R., Hurley-Keller, D., & Feldmeier, J. J. 2004, in IAU Symposium, 90
- Ebeling et al. (1996) Ebeling, H., Voges, W., Bohringer, H., Edge, A. C., Huchra, J. P., & Briel, U. G. 1996, MNRAS, 281, 799
- Feldmeier et al. (2004) Feldmeier, J. J., Mihos, J. C., Morrison, H. L., Harding, Kaib, P. N., & Dubinski, J. 2004, ApJ, in press
- Feldmeier et al. (2002) Feldmeier, J. J., Mihos, J. C., Morrison, H. L., Rodney, S. A., & Harding, P. 2002, ApJ, 575, 779
- Ferguson et al. (1998) Ferguson, H. C., Tanvir, N. R., & von Hippel, T. 1998, Nature, 391, 461
- Fujita (2004) Fujita, Y. 2004, PASJ, 56, 29
- Fukugita et al. (1995) Fukugita, M., Shimasaku, K., & Ichikawa, T. 1995, PASP, 107, 945
- Gerhard et al. (2005) Gerhard, O., Arnaboldi, M., Freeman, K. C., Kashikawa, N., Okamura, S., & Yasuda, N. 2005, ApJ, 621, L93
- Gerhard et al. (2002) Gerhard, O., Arnaboldi, M., Freeman, K. C., & Okamura, S. 2002, ApJ, 580, L121
- Girardi et al. (1998) Girardi, M., Borgani, S., Giuricin, G., Mardirossian, F., & Mezzetti, M. 1998, ApJ, 506, 45
- Girardi et al. (1997) Girardi, M., Escalera, E., Fadda, D., Giuricin, G., Mardirossian, F., & Mezzetti, M. 1997, ApJ, 482, 41
- Girardi & Mezzetti (2001) Girardi, M. & Mezzetti, M. 2001, ApJ, 548, 79
- Gnedin (2003) Gnedin, O. Y. 2003, ApJ, 589, 752
- Gonzalez et al. (2005) Gonzalez, A. H., Zabludoff, A. I., & Zaritsky, D. 2005, ApJ, 618, 195
- Gonzalez et al. (2000) Gonzalez, A. H., Zabludoff, A. I., Zaritsky, D., & Dalcanton, J. J. 2000, ApJ, 536, 561
- Gregg & West (1998) Gregg, M. D. & West, M. J. 1998, Nature, 396, 549
- Gudehus (1989) Gudehus, D. H. 1989, ApJ, 340, 661
- Hilker (2003) Hilker, M. 2003, in Extragalactic Globular Cluster Systems, 173
- Jedrzejewski (1987) Jedrzejewski, R. I. 1987, MNRAS, 226, 747
- Jordán et al. (2003) Jordán, A., West, M. J., Côté, P., & Marzke, R. O. 2003, AJ, 125, 1642
- Jorgensen (1994) Jorgensen, I. 1994, PASP, 106, 967
- Kelson et al. (2002) Kelson, D. D., Zabludoff, A. I., Williams, K. A., Trager, S. C., Mulchaey, J. S., & Bolte, M. 2002, ApJ, 576, 720
- Kniazev et al. (2004) Kniazev, A. Y., Grebel, E. K., Pustilnik, S. A., Pramskij, A. G., Kniazeva, T. F., Prada, F., & Harbeck, D. 2004, AJ, 127, 704
- Kowalski et al. (1983) Kowalski, M. P., Ulmer, M. P., & Cruddace, R. G. 1983, ApJ, 268, 540
- Landolt (1992) Landolt, A. U. 1992, AJ, 104, 340
- Leinert et al. (1998) Leinert, C., Bowyer, S., Haikala, L. K., Hanner, M. S., Hauser, M. G., Levasseur-Regourd, A.-C., Mann, I., Mattila, K., Reach, W. T., Schlosser, W., Staude, H. J., Toller, G. N., Weiland, J. L., Weinberg, J. L., & Witt, A. N. 1998, A&AS, 127, 1
- Lin & Mohr (2004) Lin, Y. & Mohr, J. J. 2004, ApJ, 617, 879
- Mackie (1992) Mackie, G. 1992, ApJ, 400, 65
- Marín-Franch & Aparicio (2003) Marín-Franch, A. & Aparicio, A. 2003, ApJ, 585, 714
- Markevitch (1998) Markevitch, M. 1998, ApJ, 504, 27
- Mazure et al. (1996) Mazure, A., Katgert, P., den Hartog, R., Biviano, A., Dubath, P., Escalera, E., Focardi, P., Gerbal, D., Giuricin, G., Jones, B., Le Fevre, O., Moles, M., Perea, J., & Rhee, G. 1996, A&A, 310, 31
- Moore et al. (1996) Moore, B., Katz, N., Lake, G., Dressler, A., & Oemler, A. 1996, Nature, 379, 613
- Moore et al. (1999) Moore, B., Lake, G., Stadel, J., & Quinn, T. 1999, in ASP Conf. Ser. 170: The Low Surface Brightness Universe, 229
- Murante et al. (2004) Murante, G., Arnaboldi, M., Gerhard, O., Borgani, S., Cheng, L. M., Diaferio, A., Dolag, K., Moscardini, L., Tormen, G., Tornatore, L., & Tozzi, P. 2004, ApJ, 607, L83
- O’Neil et al. (1997) O’Neil, K., Bothun, G. D., & Cornell, M. E. 1997, AJ, 113, 1212
- Peng et al. (2002) Peng, C. Y., Ho, L. C., Impey, C. D., & Rix, H. 2002, AJ, 124, 266
- Pimbblet et al. (2002) Pimbblet, K. A., Smail, I., Kodama, T., Couch, W. J., Edge, A. C., Zabludoff, A. I., & O’Hely, E. 2002, MNRAS, 331, 333
- Reimers et al. (1996) Reimers, D., Koehler, T., & Wisotzki, L. 1996, A&AS, 115, 235
- Reiprich & Böhringer (2002) Reiprich, T. H. & Böhringer, H. 2002, ApJ, 567, 716
- Ryan-Weber et al. (2004) Ryan-Weber, E. V., Meurer, G. R., Freeman, K. C., Putman, M. E., Webster, R. L., Drinkwater, M. J., Ferguson, H. C., Hanish, D., Heckman, T. M., Kennicutt, R. C., Kilborn, V. A., Knezek, P. M., Koribalski, B. S., Meyer, M. J., Oey, M. S., Smith, R. C., Staveley-Smith, L., & Zwaan, M. A. 2004, AJ, 127, 1431
- Schombert (1988) Schombert, J. M. 1988, ApJ, 328, 475
- Simard et al. (2002) Simard, L., Willmer, C. N. A., Vogt, N. P., Sarajedini, V. L., Phillips, A. C., Weiner, B. J., Koo, D. C., Im, M., Illingworth, G. D., & Faber, S. M. 2002, ApJS, 142, 1
- Sommer-Larsen et al. (2005) Sommer-Larsen, J., Romeo, A. D., & Portinari, L. 2005, MNRAS, 39
- Stein (1996) Stein, P. 1996, A&AS, 116, 203
- Struble & Ftaclas (1994) Struble, M. F. & Ftaclas, C. 1994, AJ, 108, 1
- Struble & Rood (1999) Struble, M. F. & Rood, H. J. 1999, ApJS, 125, 35
- Teague et al. (1990) Teague, P. F., Carter, D., & Gray, P. M. 1990, ApJS, 72, 715
- Theuns & Warren (1997) Theuns, T. & Warren, S. J. 1997, MNRAS, 284, L11
- Trentham (1998) Trentham, N. 1998, MNRAS, 293, 71
- Trujillo et al. (2001) Trujillo, I., Aguerri, J. A. L., Gutiérrez, C. M., & Cepa, J. 2001, AJ, 122, 38
- Uson et al. (1991) Uson, J. M., Boughn, S. P., & Kuhn, J. R. 1991, ApJ, 369, 46
- Vilchez-Gomez et al. (1994) Vilchez-Gomez, R., Pello, R., & Sanahuja, B. 1994, A&A, 283, 37
- Willman et al. (2004) Willman, B., Governato, F., Wadsley, J., & Quinn, T. 2004, MNRAS, 355, 159
- Wu et al. (1999) Wu, X., Xue, Y., & Fang, L. 1999, ApJ, 524, 22
- Zaritsky et al. (2004) Zaritsky, D., Gonzalez, A. H., & Zabludoff, A. I. 2004, ApJ, 613, L93
- Zibetti et al. (2005) Zibetti, S., White, S. D. M., Schneider, D. P., & Brinkmann, J. 2005, MNRAS, 358, 949
![[Uncaptioned image]](/html/astro-ph/0509609/assets/x24.png)