A Fundamental Plane Relation for the X-Ray Gas in Normal Elliptical Galaxies
Abstract
We report on the discovery of a new correlation between global parameters of the hot interstellar gas in elliptical galaxies. We reanalyze archival Chandra data for 30 normal early-type systems, removing the contributions of resolved and unresolved point sources to reveal the X-ray morphology of the hot gas. We determine the half-light radius, , and the mean surface brightness, , from the gas surface brightness profiles. A spectral analysis determines the temperature, , of the gas within 3 optical effective radii. We find that the galaxies lie on an X-ray Gas Fundamental Plane (XGFP) of the form . This is close to, but distinct from, a simple luminosity-temperature relation. The intrinsic width of the XGFP is only dex, nearly identical to that of the stellar (optical) fundamental plane (SFP). This is surprising since X-ray gas masses are typically of the stellar masses. We show that the XGFP is not a simple consequence of the virial theorem or hydrostatic equilibrium, and that it is essentially independent of the SFP. The XGFP thus represents a genuinely new constraint on the hydrodynamical evolution of elliptical galaxies.
Subject headings:
galaxies: cooling flows—galaxies: elliptical and lenticular, cD—galaxies: ISM—X-rays: galaxies—X-rays: ISM1. Introduction
Elliptical galaxies lie on a two-dimensional locus, known as the fundamental plane (FP), in the space defined by the optical effective radius , optical surface brightness , and stellar velocity dispersion (Djorgovski & Davis, 1987; Dressler et al., 1987). The FP is understood to be a consequence of the virial theorem, modified by stellar population variations and structural nonhomology for systems of different luminosity (Trujillo et al., 2004, and references therein). FP-like scaling relations have been found for other types of systems as well, including galaxy clusters (Schaeffer et al., 1993). Several authors have pointed out “cluster fundamental plane” relations involving either optical parameters alone (Adami et al., 1998) or mixtures of X-ray and optical parameters (Fritsch & Buchert, 1999; Miller et al., 1999). Because the baryonic mass in clusters is dominated by intracluster gas at temperatures , X-rays are a better tracer of ordinary matter than starlight. Fujita & Takahara (1999a) show the existence of a cluster FP purely in X-ray parameters (see also Annis, 1994), which they show can be consistent with simple spherical collapse (Fujita & Takahara, 1999b).
An “X-ray fundamental plane” for elliptical galaxies—actually a relation between stellar dispersion, X-ray luminosity, and half-light radius—has been suggested by Fukugita & Peebles (1999). But in normal ellipticals,111For our purposes, normal ellipticals are those that are not at the centers of cluster potential wells. the mass of X-ray gas is typically only a few percent of the stellar mass (Bregman et al., 1992). Much of the X-ray flux comes from low-mass X-ray binaries (LMXBs); if not accounted for, this guarantees a correlation between X-ray and optical luminosity. Normal ellipticals are thought to lose most of their gas in supernova-driven winds (Ciotti et al., 1991), and high-resolution observations using Chandra show that many appear disturbed, suggesting redistribution of gas through shocks, nuclear activity, mergers, or interaction with the intergalactic medium (e.g Finoguenov & Jones, 2001; Jones et al., 2002; Machacek et al., 2005; Statler & McNamara, 2002). Thus, the visible hot gas is only a tenuous leftover of a complex hydrodynamical history, and may be far from equilibrium.
Nonetheless, in this Letter we report the discovery of a fundamental plane relation for the X-ray gas alone. We show that the X-ray Gas Fundamental Plane (XGFP) is distinct from—but as tight as—the stellar fundamental plane (SFP). Unlike the SFP, the XGFP is not a simple consequence of the virial theorem. In fact, the XGFP is almost completely decoupled from the SFP, and thus constitutes a new constraint on the evolution of normal elliptical galaxies.
2. Data Reduction and Analysis
2.1. Chandra Archive Sample and Pipeline Reduction
We analyze a sample consisting of 56 E and E/S0 galaxies having non-grating ACIS-S exposures longer than in the Chandra public archive. Brightest cluster galaxies and objects with AGN-dominated emission are excluded. All observations are uniformly reprocessed using version 3.1 of the CIAO software and version 2.28 of the calibration database. Flares are removed by iteratively applying a threshold. For the quiescent background, intervals more than 20% above the mean count rate are excised, to match the blank sky background fields. We restrict photon energies to the range –, further divided into soft (–) and hard (–) bands. Monoenergetic exposure maps are created in steps of 7 in PI (). An image is extracted for each -wide PI channel, and divided by the energetically closest exposure map to create a photon-flux-calibrated “slice.” The slices are summed to produce the calibrated photon flux images. Full details of the analysis and results, along with data products, will be presented in future papers (Diehl & Statler, 2006a, b).
2.2. Isolating the Gas Emission
Point sources are identified in each band by CIAO’s wavdetect tool. Regions enclosing 95% of the source flux are removed and the holes filled with counts drawn from a Poisson distribution, whose pixel-by-pixel expectation value is determined by adaptive interpolation using the asmooth tool in the XMMSAS package. A uniform background is determined from fits to the radial surface brightness profile, and subtracted.
To remove the contribution of unresolved point sources, we use the fact that the hot gas and LMXBs contribute differently to the soft and the hard bands. Let and represent the background-subtracted soft and hard images. We can express both in terms of the unresolved point source emission , the gas emission , and their respective softness ratios and :
| (1) | |||||
| (2) |
The uncontaminated gas image is then given by
| (3) |
Assuming that resolved and unresolved LMXBs share spatially independent spectral properties, we can use the resolved sources to determine the constant . We take sources between and from the center, excluding high luminosity sources ( counts). For systems with sources meeting these criteria, we fit an absorbed power law model to the combined point source spectrum, with hydrogen column density fixed at the Galactic value for the line of sight. Integrating the model over the soft and hard bands yields . For other galaxies, we exploit the universal nature of the LMXB spectrum (Irwin et al., 2003). A simultaneous power-law fit to all low-luminosity () point sources in our sample gives a photon index of . This model is used to derive for the source-poor galaxies.
The coefficient is determined similarly, from the fit of an APEC thermal plasma model (Smith et al., 2001) to the hot gas emission (see § 2.3). This approach assumes isothermal gas throughout the galaxy. In case of a temperature gradient, one would have to account for the spatial dependence of , but this approach is beyond the scope of this Letter.
2.3. Physical Parameters for the Gas
To produce a radial profile, we adaptively bin the gas image into circular annuli. In 12 cases there is insufficient signal to fit the spatial profile. We fit the remaining profiles with Sérsic models to derive X-ray half-light radii and mean enclosed surface brightnesses .222Fits using and double- models are unphysical in more than half the cases, implying divergent fluxes at large radii. We discard 14 objects with larger than the size of the observed field. The final sample of 30 objects has absolute magnitudes in the range . Twenty-one are group members, and 14 are brightest group galaxies (Garcia, 1993). Eight of the 14, plus 3 additional objects, are central members of X-ray-bright groups in the GEMS survey (Osmond & Ponman, 2004). We find that up to 55% (typically 10–30%) of the diffuse emission in the final sample comes from unresolved LMXBs.
The spectrum of the diffuse emission between and is extracted from a circular region in radius, excluding resolved point source regions. We fit the spectrum using the SHERPA package, adopting a single temperature APEC thermal plasma model for the hot gas and a power law for the unresolved LMXBs. The normalizations of both components, the gas temperature , and (in most cases) gas metallicity are allowed to vary. The redshift is set to the value given in the Lyon–Meudon Extragalactic Database (LEDA; Paturel et al., 1997). For low signal-to-noise spectra, the abundances are held fixed at the solar value. The photon index of the power law component is determined by a simultaneous fit to the spectrum of the lowest luminosity resolved point sources (§ 2.2). Single-temperature APEC models are poor fits (reduced ) to 12 objects. In these cases the temperature should be interpreted as an emission weighted average. Excluding these galaxies from the sample does not change the results.
All errors are assumed to be Gaussian, described by a covariance matrix. Statistical errors on , , and are obtained from the fitted models. We adopt distances and errors obtained from surface brightness fluctuations (Tonry et al., 2001) where available; otherwise we use LEDA values333LEDA distances are obtained from a -band Faber-Jackson relation of the form and assume errors of . We adopt a 10% uncertainty in from the galaxy-to-galaxy scatter in the photon indices fitted to the composite point-source spectra, and a 5% uncertainty in from a comparison of values obtained from the spectral fits and from direct integration of gas-dominated spectra over the hard and soft bands. We measure the effect on and by repeating the spatial fits with altered values of and .
Table 1 lists the base-10 logarithms of (kpc), () and () for the final sample of 30 galaxies, and the corresponding non-zero elements of the covariance matrix.
| ID | |||||||
|---|---|---|---|---|---|---|---|
| I1459 | |||||||
| I4296 | |||||||
| N193 | |||||||
| N315 | |||||||
| N533 | |||||||
| N720 | |||||||
| N741 | |||||||
| N1404 | |||||||
| N1407 | |||||||
| N1553 | |||||||
| N2434 | |||||||
| N3923 | |||||||
| N4125 | |||||||
| N4261 | |||||||
| N4374 | |||||||
| N4526 | |||||||
| N4552 | |||||||
| N4621 | |||||||
| N4636 | |||||||
| N4649 | |||||||
| N4783 | |||||||
| N5044 | |||||||
| N5846 | |||||||
| N6482 | |||||||
| N7052 | |||||||
| N7618 |
3. The X-Ray Gas Fundamental Plane
The distribution of galaxies in the parameter space is nearly planar. This is seen clearly in Figure 1, which shows face-on and edge-on views of the XGFP. We determine the intrinsic distribution in this space by fitting a probability density in the form of a tilted slab with finite Gaussian width, taking correlated errors into account.
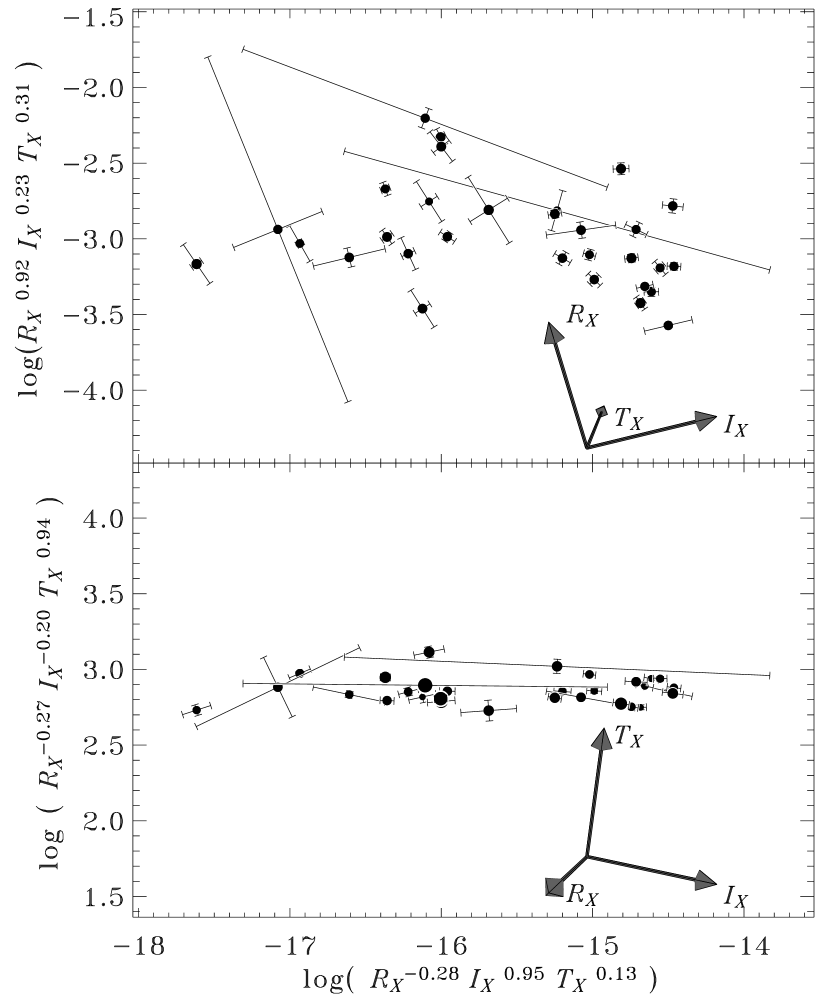
We can express the XGFP in the form
| (4) |
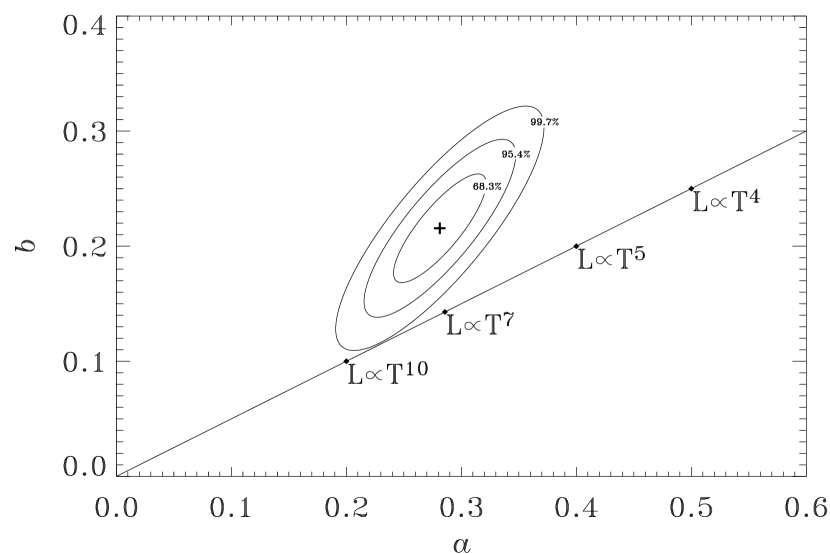
where and determine the orientation of the plane. The best-fit values are and (Figure 2). The formal 1-dimensional errors in and are and , respectively; but as the figure shows, the errors are correlated. The intrinsic width of the XGFP is very small, with a value of dex, which is identical to that of the SFP (Bernardi et al., 2003) to within the errors. The fit is robust and not sensitive to the choice of model for the surface brightness profile. Excluding the brightest group galaxies or galaxies with bad single-temperature fits results in and values within the 68.3% confidence ellipse in Figure 2.
4. Discussion
4.1. Relation to Known Scaling Laws
If and obeyed the relation , the XGFP would be equivalent to a simple luminosity–temperature relation of the form , indicated by the solid line in Figure 2. The model fit rules out a pure – relation at confidence. The – relation represents a nearly edge-on view of the XGFP, analogous to the Faber-Jackson relation (Faber & Jackson, 1976) for the SFP. As in the optical case, the XGFP accounts for much of the intrinsic scatter ( dex) in the – relation.444Gas luminosities are obtained by summing the observed flux in the field of view and using the fitted Sérsic law to account for the flux at larger radii. For a given , galaxies with more extended gas emission are more luminous than compact objects.
The – relation most nearly consistent with the XGFP is given by (Figure 2). A naive principal component analysis in the – plane yields a shallower exponent of . O’Sullivan et al. (2003) find for their complete sample, and a steeper exponent of when they exclude galaxies with prominent temperature gradients. However, their X-ray luminosities include unresolved LMXBs, the removal of which would steepen the – relation.
A comparison can also be made with the – relation for ellipticals. Mahdavi & Geller (2001) find , and predict this relation to steepen to if is restricted solely to the hot gas. Using the temperature-dispersion correlation (O’Sullivan et al., 2003), we can approximate our closest – relation as , which is consistent with the earlier result.
Fujita & Takahara (1999a) obtain a result vaguely similar to ours for clusters of galaxies. They find an X-ray cluster FP connecting core radius, central density, and mean cluster temperature. Assuming a constant value of for their surface brightness profile fits, we can translate their cluster FP to our parameters, finding . Their relation is significantly inclined to our XGFP, and is close to the relation . However, the cluster FP deviates from a pure – relation in a manner similar to that of the XGFP.
Fukugita & Peebles (1999) suggest a galaxy fundamental plane with mixed X-ray and optical parameters, , and . Their sample consists of 11 galaxies with ROSAT, Einstein or ASCA observations. We do not reproduce their result with our larger Chandra sample. The reason for this discrepancy may be that their X-ray luminosities are corrected neither for light outside the field of view nor for the contribution of point sources.
4.2. Independence of the XGFP and the SFP
The virial theorem connects a system’s total mass with its characteristic radius and dispersion . This relation produces an observable SFP because mass maps to luminosity by way of the mass-to-light ratio, and the stellar and are surrogates for and . For the XGFP to be another manifestation of the virial theorem, one would require similar mappings from mass parameters into X-ray observables. One example is hydrostatic equilibrium, which links and for a given potential. Others might connect gas mass to total mass or to a measure of gas retainability such as . However, these relations would be identifiable in correlations between optical and X-ray parameters. Only the known – relation (e.g. O’Sullivan et al., 2003) and an additional, very weak – relation are supported by the data. X-ray gas masses are uncorrelated with and other optical properties.
If the SFP and XGFP were linked, then each plane would represent a projection of a higher dimensional, more fundamental hyperplane into the corresponding 3-parameter subspace. We test this hypothesis by analyzing the (, , , , , ) space with principal component analysis (PCA). In this space our sample is reduced to 25 objects with reliable X-ray and optical parameters. We define the 3-vectors and to be the normals to the fundamental planes in X-ray and optical parameters, respectively. From the SFP we have (Bernardi et al., 2003) and from the XGFP, . If the planes are completely independent, the eigenvectors corresponding to the two smallest eigenvalues will have the form and . Here, and are 6-vectors, and can be any number between and 1, depending on the relative scatter in the two planes. We obtain and . This result is not far from the above prediction with . Furthermore, the scatter about both planes is not reduced by going to higher dimensions. Both results point to, at most, weak coupling of the subspaces.
Optical and X-ray parameters are known to be coupled through the observed – relation. We test whether this coupling could have a measurable effect on the eigenvectors, using Monte Carlo simulations of 25-object samples following the fitted SFP and XGFP relations. We take the SFP and XGFP to be independent, except for an intrinsic linear correlation between and with a variable amount of scatter. We consider three coupling strengths: none, weak, and strong. Weak coupling reproduces the observed width ( dex) of the – relation and, by way of the SFP, the somewhat weaker – relation; strong coupling reduces the – width by a factor of 3. We perform PCA on the simulated 6-d data and measure the alignment of the best 2 eigenvectors with those obtained from the real data. All 3 cases reproduce the eigenvectors to within the Poisson noise, showing that the observed – relation does not change the relation between a decoupled XGFP and SFP at a level that can be resolved with a 25-object sample.
The data are thus consistent with the XGFP and SFP being almost completely independent. The XGFP cannot be understood as a simple consequence of the virial theorem or hydrostatic equilibrium. Instead, the XGFP represents a new constraint on the hydrodynamic evolution of elliptical galaxies.
References
- Adami et al. (1998) Adami, C., Mazure, A., Biviano, A., Katgert, P., & Rhee, G. 1998, A&A, 331, 493
- Annis (1994) Annis, J. 1994, BAAS, 26, 1427
- Bernardi et al. (2003) Bernardi, M., et al. 2003, AJ, 125, 1866
- Bregman et al. (1992) Bregman, J. N., Hogg, D. E., & Roberts, M. S. 1992, ApJ, 387, 484
- Brighenti & Mathews (1998) Brighenti, F. & Mathews, W. G. 1998, ApJ, 495, 239
- Brown & Bregman (1998) Brown, B. A. & Bregman, J. N. 1998, ApJ, 495, L75
- Ciotti et al. (1991) Ciotti, L., Pellegrini, S., Renzini, A., & D’Ercole, A. 1991, ApJ, 376, 380
- David et al. (1991) David, L. P., Forman, W., & Jones, C. 1991, ApJ, 369, 121
- Diehl & Statler (2006a) Diehl, S. & Statler, T. S., 2006a, in preparation
- Diehl & Statler (2006b) Diehl, S. & Statler, T. S., 2006b, in preparation
- Djorgovski & Davis (1987) Djorgovski, S. & Davis, M. 1987, ApJ, 313, 59
- Dressler et al. (1987) Dressler, A., Lynden-Bell, D., Burstein, D., Davies, R. L., Faber, S. M., Terelvich, R. J., & Wegner, G. 1987, ApJ, 313, 42
- Faber & Jackson (1976) Faber, S. M., & Jackson, R. E. 1976, ApJ, 204, 668
- Finoguenov & Jones (2001) Finoguenov, A., & Jones, C. 2001, ApJ, 547, L107
- Fritsch & Buchert (1999) Fritsch, C. & Buchert, T. 1999, A&A, 344, 749
- Fujita & Takahara (1999a) Fujita, Y. & Takahara, F. 1999a, ApJ, 519, L51
- Fujita & Takahara (1999b) Fujita, Y. & Takahara, F. 1999b, ApJ, 519, L55
- Fukugita & Peebles (1999) Fukugita, M. & Peebles, P. J. E. 1999, ApJ, 524, L31
- Garcia (1993) Garcia, A. M. 1993, A&AS, 100, 47
- Hibbard & Mihos (1995) Hibbard, J. E. & Mihos, J. C. 1995, AJ, 110, 140
- Irwin et al. (2003) Irwin, J. A., Athey, A. E., & Bregman, J. N. 2003, ApJ, 587, 356
- Jones et al. (2002) Jones, C., Forman, W., Vikhlinin, A., Markevitch, M., David, L., Warmflash, S., Murray, S., & Nulsen, P.E.J. 2002, ApJ, 567, L115
- Kritsuk et al. (1998) Kritsuk, A., Bohringer, H., & Muller, E. 1998, MNRAS, 301, 343
- Loewenstein & Mathews (1987) Loewenstein, M., & Mathews, W. G. 1987, ApJ, 319, 614
- Machacek et al. (2005) Machacek, M., Dosaj, A., Forman, W., Jones, C., Markevitch, M., Vikhlinin, A., Warmflash, A., & Kraft, R. 2005, ApJ, 621, 663
- Mahdavi & Geller (2001) Mahdavi, A., & Geller, M. J. 2001, ApJ, 554, L129
- Mathews et al. (2004) Mathews, W. G., Brighenti, F., & Buote, D. A. 2004, ApJ, 615, 662
- Miller et al. (1999) Miller, C. J., Melott, A. L., & Gorman, P. 1999, ApJ, 526, L61
- Osmond & Ponman (2004) Osmond, J. P. F., & Ponman, T. J. 2004, MNRAS, 350, 1511
- O’Sullivan et al. (2003) O’Sullivan, E., Ponman, T. J., & Collins, R. S. 2003, MNRAS, 340, 1375
- Paturel et al. (1997) Paturel, G., et al. 1997, A&AS, 124, 109
- Pellegrini & Ciotti (1998) Pellegrini, S., & Ciotti, L. 1998, A&A, 333, 433
- Read & Ponman (1998) Read, A. M. & Ponman, T. J. 1998, MNRAS, 297, 143
- Schaeffer et al. (1993) Schaeffer, R., Maurogordato, S., Cappi, A., & Bernardeau, F. 1993, MNRAS, 263, 21
- Smith et al. (2001) Smith, R. K., Brickhouse, N. S., Liedahl, D. A., & Raymond, J. C. 2001, ApJ, 556, L91
- Statler & McNamara (2002) Statler, T. S., & McNamara, B. R. 2002, ApJ, 581, 1032
- Tonry et al. (2001) Tonry, J. L., Dressler, A., Blakeslee, J. P., Ajhar, E. A., Fletcher, A. B., Luppino, G. A., Metzger, M. R., & Moore, C. B. 2001, ApJ, 546, 681
- Trujillo et al. (2004) Trujillo, I., Burkert, A., & Bell, E. F. 2004, ApJ, 600, L39
- White & Sarazin (1991) White, R. E. & Sarazin, C. L. 1991, ApJ, 367, 476