ZEN and the search for high–redshift galaxies
Abstract
We present the ZEN (z equals nine) survey: a deep, narrow -band search for proto-galactic Ly emission at redshifts . In the first phase of the survey, dubbed ZEN1, we combine an exceptionally deep image of the Hubble Deep Field South, obtained using a narrow band filter centred on the wavelength 1.187m, with existing deep, broad band images covering optical to near infrared wavelengths. Candidate Ly-emitting galaxies display a significant narrow band excess relative to the –band that are undetected at optical wavelengths. We detect no sources consistent with this criterion to the 90% point source flux limit of the NB image, . The survey selection function indicates that we have sampled a volume of approximately to a Ly emission luminosity of . When compared to the predicted properties of galaxies based upon no evolution of observed Ly-emitting galaxies, the ‘volume shortfall’ of the current survey, i.e. the volume required to detect this putative population, is a factor of at least 8 to 10. We also discuss continuing narrow -band imaging surveys that will reduce the volume shortfall factor to the point where the no-evolution prediction from is probed in a meaningful manner.
1 Introduction
Determining during which epoch and under what conditions the first galaxies and stars formed is a key goal of galaxy evolution studies. Observations of distant galaxies currently extend to redshifts (Kneib et al. 2004). In addition, a number of studies have demonstrated that selecting faint galaxies displaying colours characteristic of the Lyman Break signature at redshifts is an effective method to identify significant ( galaxies) samples of high-redshift galaxies (Bouwens et al. 2004a; Dickinson et al. 2004; Stanway et al. 2004; Malhotra et al. 2005). The addition of a narrow band (NB) filter to such broad band observations robustly identifies Ly-emitting galaxies at redshifts that place the emission line in the filter bandpass (Hu et al. 2004; Kodaira et al. 2003; Rhoads et al. 2004). In the case of Ly-emitting galaxies at , NB filters can exploit narrow spectral regions free from bright night sky emission lines. The main benefit of this approach is that the spectral location and profile of the Ly emission line can be identified in a relatively straightforward manner – leading to samples of galaxies with very high spectral completeness (e.g. Hu et al. 2004). The main drawback of course is that the narrow spectral region viewed by the NB filter greatly reduces the volume sampled compared to a broad band survey of comparable depth and field.
The properties of individual galaxies now provide relatively detailed constraints upon the the very earliest epochs of star formation (SF) – pointing to an earlier epoch of very intense SF just beyond the redshift limit of current, optical surveys. Two of the brightest galaxies known at have been detected at 3.6m and 4.5m using the Spitzer infrared space telescope (Eyles et al. 2005). Analysis of the rest-frame UV to optical spectral energy distribution (SED) of these galaxies indicates the presence of stellar populations of masses M⊙ and ages Myr. Within the cosmological model assumed in these proceedings (see below) the epoch corresponding to the onset of SF in these galaxies is .
A key factor that determines the visibility of Ly-emitting galaxies at is the ionisation state of the inter-galactic medium (IGM). As the neutral fraction of uniformly distributed hydrogen gas in the Universe increases beyond 1 part in the associated optical depth at rest wavelengths blueward of 1216Å exceeds unity (Gunn and Peterson 1965). Observations of “dark regions” – consistent with an IGM optical depth – in redshift QSOs suggest that we may be witnessing the onset of neutrality in the IGM at these redshifts (Becker et al. 2001; Fan et al. 2002). As the IGM neutral fraction increases further, the absorption profile develops a strong damping wing extending to rest wavelengths Å – potentially absorbing the Ly feature in high-redshift SF galaxies. However, the observation of a Ly-emitting galaxy at redshift (Hu et al. 2002) is not inconsistent with observation of a possible GP effect in lower redshift QSOs. Haiman (2002), Santos (2004) and Barton et al. (2004) describe the ionising effect of a star forming galaxy embedded in a neutral IGM and note that, depending upon the exact assumptions made regarding the mass and star formation properties of the source and the physical conditions present in the IGM, the galaxy will form a local HII region of sufficient size to permit transmission of a partially attenuated Ly line and associated continuum.
The visibility of Ly emission in high-redshift SF galaxies is important as, although galaxies will appear as continuum drop-out sources, e.g. (Bouwens et al. 2004b), confirming the redshift of such faint candidates () on the basis of continuum features observed in deep near infrared (NIR) spectra is challenging to the point of being impractical. Therefore, a NIR NB survey for Ly-emitting galaxies at has the potential to detect Ly-bright galaxies for which obtaining a spectroscopic redshift via follow-up NIR spectroscopy using 8–10m class telescopes is a realistic goal. In the remainder of these proceedings we describe a dedicated search for high–redshift star forming galaxies, employing an extension of broad and narrow–band selection techniques applied at optical wavelengths to the NIR wavelength regime. In particular we focus upon the application of a narrow –band filter centred at m to detect the signature of Ly emitting galaxies located about a redshift (termed in the following text).
In these proceedings we adopt a cosmological model described by the parameters , , kms-1 Mpc. All magnitudes are quoted using the AB system.
2 Constructing the experiment: going deep and rejecting interlopers
We assume that a redshift Ly–emitting galaxy will display a significant narrow band excess relative to the –band, in addition to displaying a continuum break consistent with almost complete attenuation of photons at rest frame Å. In order to generate an effective survey for such sources certain additional factors must be considered:
-
1.
NIR continuum imaging data must achieve a limiting depth of . The brightest emission line galaxies confirmed at redshifts display AB magnitudes (Hu et al. 2004). The additional distance modulus between a redshift and results in a relative dimming term of 1 magnitude.
-
2.
Optical imaging data must reach a limiting depth typically 1.5 magnitudes fainter than NIR data. Early–type galaxies located at redshifts can generate a spectral discontinuity between optical and NIR continuum bands of amplitude mag. (Stanway et al 2004b). Failure to identify the continuum break directly could lead to the mis-identification of redshifted [OII]3727 emission in such sources as candidate Ly emission.
Following these considerations the Hubble Deep Field South (HDFS; Williams et al. 2000) Wide field Planetary Camera 2 (WFPC2) apex pointing (, J2000) was selected as the target field in order to exploit the high quality of optical to NIR image data available for the field. In particular, the combination of HDFS WFPC2 and Very Large Telescope (VLT) Infrared Spectrometer And Array Camera (ISAAC; Moorwood 1997) observations of the field provide images to typical depths AB=28 and AB=26 in optical and NIR bandpasses respectively (Labbé et al. 2003).
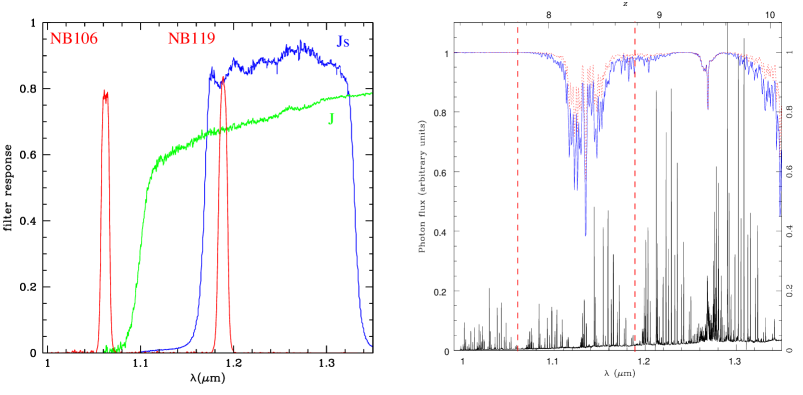
VLT/ISAAC further provides a suitable combination of narrow and broad band filters for the ZEN survey: the NB119 filter (see Figure 1) is well placed within the response of both the and NIR bandpasses. In addition the NB119 filter samples a spectral region free from both strong atmospheric emission and absorption features. The NB119 filter has an effective width of 89.5Å and is centred at a wavelength 1.187m (corresponding to the location of Ly emission at a redshift ). While the NB106 filter samples similarly “dark” sky regions, it is not well placed with respect to the broad -band filters – complicating the estimation of NB excess for individual sources.
3 The ZEN1 data set
Narrow –band observations of the HDFS WFPC2 pointing were obtained during ESO Period 69 (May 19th to September 17th 2002) employing the VLT/ISAAC facility. The total NB data set consists of s spatially dithered exposures. Imaging data were a) corrected for varying pixel response using twilight sky exposures, b) sky-subtracted having masked array regions containing objects detected above a specified ADU level, c) corrected for both high– and low–frequency spatial artefacts, d) shifted to a common pixel scale and coadded using a suitable pixel weighting and rejection algorithm. The applied data reduction techniques are broadly similar to those described in Labbé et al. (2003) for deep observations of the HDFS. A more complete description of the NB data reduction and analysis can be found in Willis and Courbin (2005).
The photometric zero point for the NB119 image was computed employing diameter aperture photometry of 47 bright, isolated sources common to the NB119 and FIRES –band images. Assuming that the SEDs of these calibration sources display no strong discontinuities, the –band flux density provides an accurate estimate of the flux density within the NB119 filter, i.e. . Source detection and photometry was performed on the NB119 image and the diameter detection apertures were transformed to the FIRES astrometric system to compute corresponding magnitudes.
The flux completeness limit of the NB119 and images was estimated by introducing and recovering artificial unresolved sources within each field. Adopting the 90% point source recovery threshold as the limiting magnitude in each band generates magnitude limits of and and corresponds to integrated signal–to–noise ratios (SNR) of 13.8 and 10 respectively. The magnitude limit corresponds to a total flux integrated across the NB filter of . In common with Labbé et al. (2003) we present aperture photometry throughout this paper. The correction required to convert photometric measures computed in apertures to apertures (which we assume to be ‘total’ measures) was determined to be 0.7 magnitudes via analysis of bright stars in the NB image.
Figure 3 displays NIR narrow band excess, expressed as , versus magnitude for all sources extracted from the total area covered by the optical and NIR data for the HDFS field. Note that all NB detections have a corresponding detection. Sources displaying and are flagged as potential emitting galaxies.

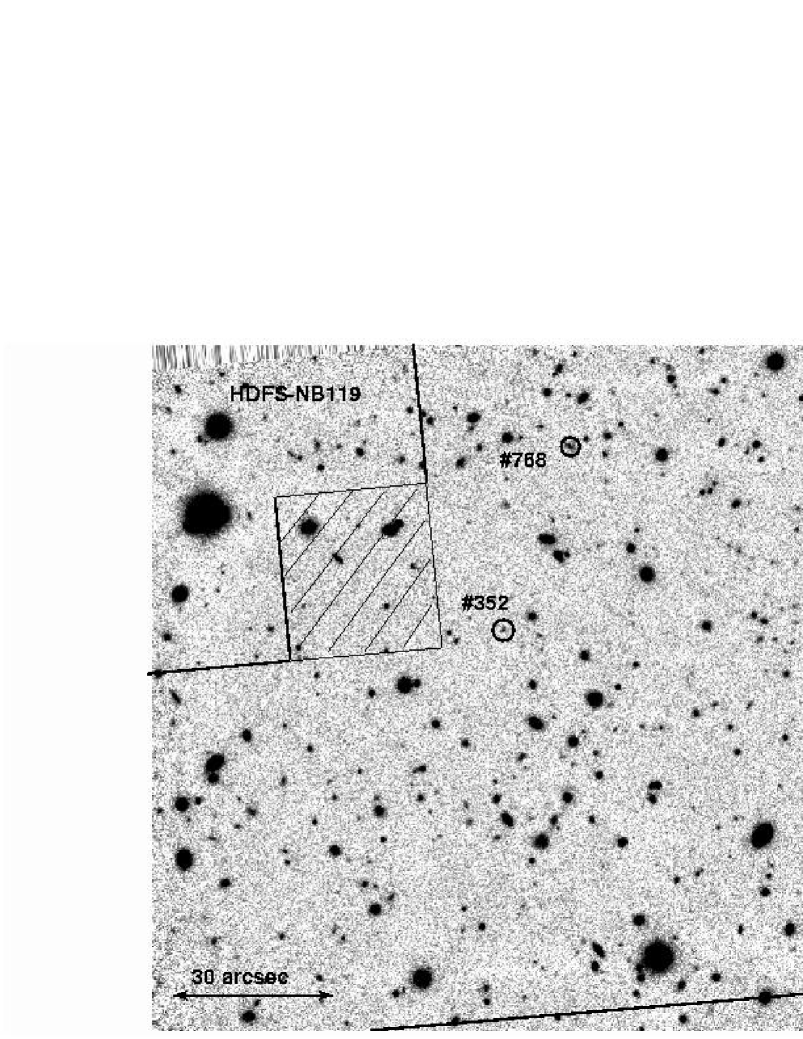
Two sources are identified by the above selection criteria, HDFS–352 and HDFS–768 – where the identification numbers refer to the HDFS photometric catalogue of Labbé et al. (2003). The photometric spectrum formed by the plus NB photometry of each object is displayed in Figure 4. In each case the addition of deep optical photometry is sufficient to exclude each NB excess detection as a potential source: each NB excess object is detected in all optical bands and the photometric redshift of each source (Rudnick et al. 2001) – (HDFS–352) and (HDFS–768) – is consistent with a NB excess arising from redshifted H and H emission respectively.

Although no candidate sources are detected within the HDFS survey area, the confirmation of two sources whose photometric redshifts are consistent with the observed NB excess arising from narrow line emission lends support to the assertion that the adopted selection criteria identify faint, narrow emission line galaxies.
4 A ZEN paradox: what is the significance of detecting no Ly emitters at ?
The Ly emission line selection function generated by the NB excess search technique is displayed in Figure 5 in terms of the co–moving volume sampled as a function of Ly emission luminosity for three values of the rest frame velocity width of the Ly-emitting source. For the case where the rest frame velocity width of putative sources is , the NB excess survey area samples a co–moving volume of to a Ly emission luminosity of .

The uncertain physical state of the IGM at complicates a detailed comparison of model Ly-emitting populations to the region of luminosity and volume parameter space sampled by the ZEN1 study (e.g. see Santos 2004). A more empirical approach is to consider known Ly-emitting sources and to transpose their properties to redshift . Hu et al. (2004) (hereafter H04) present a search for Ly-emitting galaxies at employing a narrow band filter centred on the wavelength 8150Å. Though the H04 study does not present the highest redshift Ly sources currently known (c.f. Kodaira et al. 2003), their study is based upon near complete spectroscopic follow-up observations – 19 out of 23 observed sources (from a total sample of 26 candidates) were confirmed as Ly at – and the overall design of their study is very close to the ZEN1 survey. H04 report a surface density of Ly emitting galaxies of 0.03 arcmin-2 to a Ly flux limit of ergs s-1 cm-2 from a total areal coverage of 700 arcmin2.
Within our adopted cosmological model, an unresolved source at a redshift is 2.7 times fainter than an identical source viewed . A further factor of 0.5 must be applied to account for the different fraction of total flux measured by the diameter apertures applied by H04 and the diameter apertures employed in the current study. The H04 flux limit therefore corresponds to an approximate limit of ergs s-1 cm-2 when transposed to a redshift and employing diameter apertures, i.e., assuming that no additional evolution occurs, the sources observed by H04 are sufficiently bright to be observed within ZEN1. Applying the surface density of confirmed Ly emitting galaxies to the areal coverage of the current NIR survey, indicates a probability to detect a galaxy of 0.12 – assuming no evolution between the two redshifts. This ‘volume shortfall’ indicates that the current NIR selected survey will have to be extended by more than eight times the currently sampled area in order to realistically probe the no evolution scenario.
The present ZEN1 survey has successfully demonstrated that the sensitivity required to detect putative Ly emitting galaxies emission has been achieved for the case where no evolution occurs between redshifts and . However, it is clear that, in order to place stronger limits on the space density of such sources, the areal coverage of the current study must be extended.
5 Continuing efforts
A number of observational programs are underway with the aim of detecting Ly-emitting galaxies using the narrow -band technique described above (see contributions from Smith et al. and Bland-Hawthorn et al. in these proceedings). We are currently undertaking ZEN2, a NB119 survey of three massive lensing clusters – AC114, A1869 and A1835. The gravitational lens effect provides a typical magnification across each ISAAC field of three and our observations have been designed to reach the same unlensed luminosity and volume sensitivity as achieved with ZEN1. Of particular interest however, are the regions of each cluster field that correspond to critical lines (regions of very high magnification) for sources at . These limited areas in each ISAAC image provide exceptionally deep sightlines and offer an important ‘keyhole’ through which to detect exceptionally faint emitters.
Therefore, with the completion of ZEN2 and existing NIR NB surveys (most notably DAZLE; Bland-Hawthorn et al. in these proceedings) the pursuit of Ly-emitting galaxies will have reached the stage where simple and robust galaxy evolution models can be tested directly.
References
- (1) Barton, E. J., Davé, R., Smith, J-D., et al., 2004, ApJL, 604, 1
- (2) Becker, R. H., Fan, X., White, R. L., et al., 2001, AJ, 122, 2850
- (3) Bouwens, R. J., Illingworth, G. D., Thompson, R. I., et al., 2004a, ApJ, 606, 25
- (4) Bouwens, R. J., Thompson, R. I., Illingworth, G. D., et al., 2004b, ApJL, 616, 79
- (5) Dickinson, M., Stern, D., Giavalisco, M., et al., 2004, ApJL, 600, 99
- (6) Eyles, L., Bunker, A., Stanway, E., et al., 2005, MNRAS in press [astro-ph/0302213].
- (7) Fan, X., Narayanan, V. K., Strauss, M. A., et al., 2002, AJ, 123, 1247
- (8) Gunn, J. E., Peterson, B. A., 1965, ApJ, 142, 1633
- (9) Haiman, z., 2002, ApJL, 576, 1
- (10) Hu, E. M., Cowie, L. L., McMahon, R. G., et al., 2002, ApJL, 568, 75
- (11) Hu, E. M., Cowie, L. L., Capak, P., et al., 2004, AJ, 127, 563
- (12) Kneib, J-P., Ellis, R. S., Santos, M. R., Richard, J., 2004, ApJ, 607, 697
- (13) Kodaira, K. et al. 2003, PASJL, 55 17
- (14) Labbé, I., Franx, M., Rudnick, G., et al., 2003, AJ, 125, 1107
- (15) Malhotra, S., Rhoads, J. E., Pirzkal, N., et al., 2005, ApJ, 626, 666
- (16) Moorwood, A., 1997, Proc. SPIE, 2871, 1146
- (17) Rhoads, J. E., Xu, C., Dawson, S., et al., 2004, ApJ, 611, 59
- (18) Rousselot, P., Lidman, C., Cuby, J.-G., et al., 2000, A&A, 354, 1134
- (19) Rudnick, G., Franx, M., Rix, H-W., et al., 2001, AJ, 122, 2205
- (20) Santos, M. R., 2004, MNRAS, 349, 1137
- (21) Stanway, E. R., Bunker, A. J., McMahon, R. G., et al., 2004, ApJ, 607, 704
- (22) Williams, R. E., Baum, S., Bergeron, L. E., et al., 2000, AJ, 120, 2735
- (23) Willis, J. P. and Courbin, F., 2005, MNRAS, 357, 1348