The effect of low mass substructures on the Cusp lensing relation
Abstract
It has been argued that the flux anomalies detected in gravitationally lensed QSOs are evidence for substructures in the foreground lensing haloes. In this paper we investigate this issue in greater detail focusing on the cusp relation which corresponds to images of a source located to the cusp of the inner caustic curve. We use numerical simulations combined with a Monte Carlo approach to study the effects of the expected power law distribution of substructures within CDM haloes on the multiple images.
Generally, the high number of anomalous flux ratios in the cusp configurations is unlikely explained by ’simple’ perturbers (subhaloes) inside the lensing galaxy, either modeled by point masses or extended NFW subhaloes. We considered in our analysis a mass range of for the subhaloes. We also demonstrate that including the effects of the surrounding mass distribution, such as other galaxies close to the primary lens, does not change the results. We conclude that triple images of lensed QSOs do not show any direct evidence for dark dwarf galaxies such as cold dark matter substructure.
keywords:
cosmology: theory – dark matter – galaxies: haloes – methods: numerical1 Introduction
Cold Dark Matter (CDM) simulations predict many more low mass satellite haloes than are actually observed in the Milky Way (Klypin et al. 1999, Moore et al. 1999). It seems that 10-15% of the mass was left in satellites with perhaps 1-2% at the projected separations of 1–2 Einstein radii () where we see most lensed images (e.g. Zentner & Bullock 2003, Mao et al. 2004); this is far larger than the observed fraction of 0.01–0.1% in observed satellites (e.g. Chiba 2002). Solutions to this mismatch were proposed in three broad classes: satellites are present but dark if star formation is prevented (Bullock, Weinberg & Kravtsov 2000), satellites are destroyed due to self-interacting dark matter (Spergel & Steinhardt 2000), or their formation is prevented by changing the power spectrum to something similar to warm dark matter with significantly less power on the relevant mass scales (e.g. Bode et al. 2001). These hypotheses left the major observational challenge of distinguishing dark satellites from non-existent ones. This became known as the CDM substructure problem.
It has been argued that a possible signature of the presence of dark matter substructures can be found in strong gravitational lensing of QSOs (Mao & Schneider 1998; Metcalf & Madau 2001; Chiba 2002; Metcalf & Zhao 2002; Dalal & Kochanek 2002: Kochanek & Dalal 2004). If a distant image source is close to a cusp (from inside) in a caustic curve, three of the images will be clustered together and the sum of their magnifications will be zero (Zakharov (1995), taking the negative parity image to have negative magnification). This relation holds for a wide class of smooth analytic lens models (Keeton et al. 2003); on the other hand all known observed lensed QSOs violate this relation. This has been explained with the presence of cold dark matter substructures within the lensing galaxy’s halo.
However, the discrepancy found in some systems may be due to microlensed stars rather than to cold dark matter substructures (Keeton et al. 2003), even if the most peculiar problem is the anomalous flux ratios in radio lenses. Radio sources are essentially unaffected by the ISM of the lens galaxy (see however Koopmans et al. 2003), true absorption appears to be rare, radio sources generally show little variability and most of the flux should come from regions too large to be affected by microlensing. Therefore dark matter subhaloes appear to be the most likely explanation.
By using low resolution simulation of galaxy formation Bradac et al. (2004) claimed that the level of substructures present in simulation produces violations of the cusp relation comparable to those observed. Amara et al. (2004) implanted an idealized model of a galaxy into the center of a high resolution galactic halo extracted from dissipationless N-Body simulations to test the effects of substructures on lensed images. Their findings contrast those of Bradac et al. (2004), since they found that the substructures produced in a CDM halo are not abundant enough to account for the observed cusp caustic violation. The results of Amara et al. (2004) were also confirmed in a recent work by Macciò et al. (2005). In the later work, in which a fully hydrodynamical simulation of galaxy formation is used, it is shown that the presence of a dissipative component greatly enhances the surviving probability of satellites, expecially close to the center of the galaxy. Nevertheless Macciò et al. (2005) also demonstrated that the impact on lensing of subhaloes in the mass range is very small. Even with a number of subhaloes about 8 higher of the observed one in this mass range, the number of multiple lensed QSOs that show a violation of the cups relation is less than 24%, in contrast with an observed one of about 60%. This means that if the violation of the cusp relation is due to substructures inside the primary lens, these must have a mass smaller than .
The aim of this work is to study the influence of subhaloes with mass on the cusp relation violation.
The outline of the paper is the following: first we briefly summarize the cusp relation, then in section 3 we present the lensing numerical simulations and our modeling for the primary lens, subhaloes and extra-haloes. Tests for our models and results for three different cusp configurations are presented in section 4. Section 5 is devoted to a short discussion on the fold relation. A discussion of the results and our conclusions are presented in section 6. Throughout this paper the single large halo that is causing the QSO multiple images is referred to as the primary lens. The additional small scale haloes (inside the host halo) are referred to as subhaloes or substructures. Haloes beyond the virial radius of the primary lens are referred to as extragalactic haloes. We adopt the standard CDM cosmological model with the following parameters , , and km s-1 Mpc-1.
2 The cusp relation
There are basically three configurations of four-image systems: fold, cusp, and cross (Schneider & Weiss 1992). In this paper we will mainly concentrate on the cusp configuration, that corresponds to a source located close to the cusp of the inner caustic curve. The behavior of gravitational lens mapping near a cusp was first studied by Blandford & Narayan (1986), Schneider & Weiss (1992), Mao (1992) and Zakharov (1995), who investigated the magnification properties of the cusp images and concluded that the sum of the signed magnification factors of the three merging images approaches zero as the source moves towards the cusp. In other words (e.g. Zakharov 1995) :
| (1) |
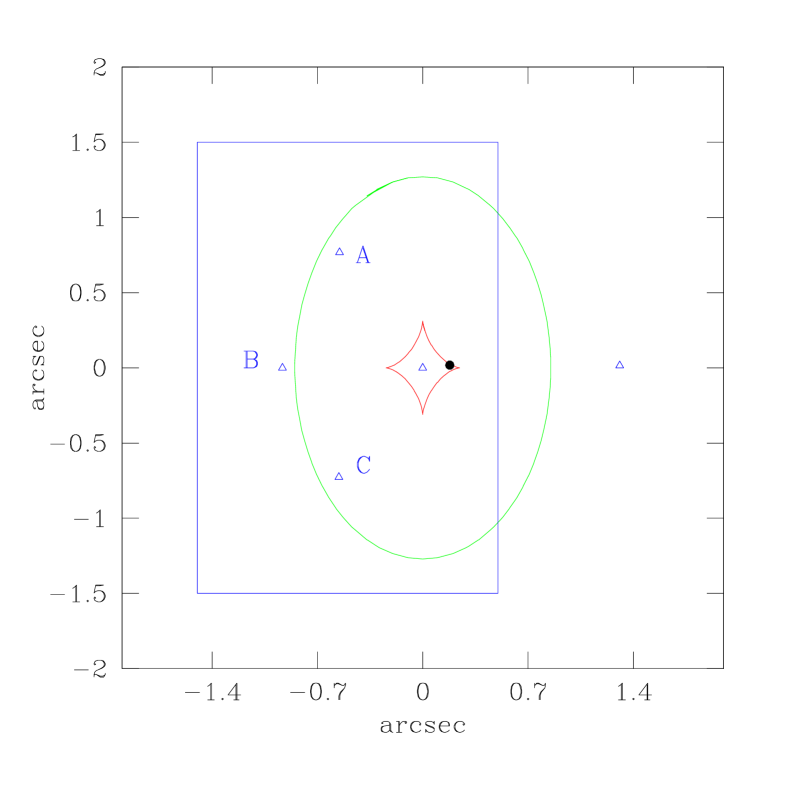
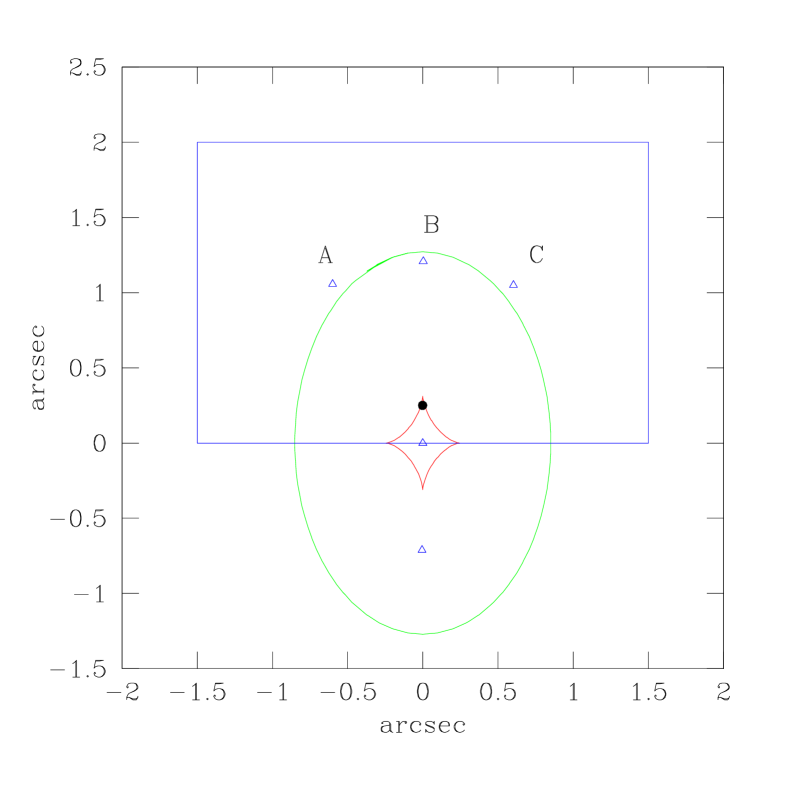
where is the unsigned sum of magnifications of all four images, and A,B & C are the triplet of images forming the smallest opening angle (see figure 7). By opening angle, we mean the angle measured from the galaxy center and being spanned by two images of equal parity. The third image lies inside such an angle. This relation is an asymptotic relation and holds when the source approaches the cusp from inside the inner caustic “astroid”. This can be shown by expanding the lensing map to third order in the angular separation from a cusp (Schneider & Weiss 1992). Small scale structure on scales smaller than the image separation will cause to differ from zero fairly independently of the form of the rest of the lens. Indeed, a substructure is more likely to reduce the absolute magnification for negative magnification images (Metcalf & Madau 2001, Schechter & Wambsganss 2002, Keeton et al. 2003) and to increase it for positive parity images.
3 Lensing Simulations
We use the lensmodel package (Keeton 2001)111The software is public available via web site: http://cfa-www.harvard.edu/castles modeling the main lens galaxy as a singular isothermal ellipsoid (SIE) and the substructures as NFW (Navarro, Frenk & White 1997) haloes. First, using the gravlens task, we find three lens configurations for which the cusp relation is roughly satisfied (figures 7, 10 and 16).
As second step a variable number of substructures is added to the main lens (see section 3.2 for details on their number density and physical properties). For this new lensing system (main lens plus subhaloes) we compute again positions and fluxes of the images (subhaloes mainly tend to modify fluxes more than positions, see Kochanek (2004) and section 4.1), obtaining a new value for the cusp relation . This procedure is repeated more than 20.000 times for each of three studied positions of the source (figures 7, 10 and 16): this allows us to compute the probability distribution of the value in presence of subhaloes (i.e. figure 8).
3.1 Primary Lens
The observed discrepancy in the flux ratios, compared with the expected universal relation from a cusp or fold singularity, suggests that it is an intrinsic difficulty for smooth lens models, not associated with a particular parameterization. For the scope of this paper it is sufficient to choose just a single smooth lens model for the primary lens. Therefore, we select, as a smooth lens model, a singular isothermal ellipsoid (SIE) (Kormann, Schneider, & Bartelmann 1994) to take advantage of its simplicity. This model has been widely used in lens modeling and successfully reproduces many lens systems (e.g. Keeton et al. 1998, Chiba 2002, Treu & Koopmans 2004). An isothermal profile for the total mass distribution of elliptical galaxies is well supported by the detailed dynamical studies of local ellipticals (Gerhard et al. 2001), individual lens modeling, and statistics (e.g. Maoz & Rix 1993; Kochanek 1995; Grogin & Narayan 1996).
The ellipsoidal primary lens has a mass equal to , it is oriented with the major axis along the y axis in the lens plane and has an ellipticity of 0.33. The redshifts of the lens and he source are fixed to and respectively, agreement with the typical observed ones (in this case we use PG1115+080 data, see Tonry 1998)
3.2 Subhaloes
Since it has been shown that the number density of subhaloes with mass is not sufficient to explain the observed number of violation in the cusp relation (Amara et al. 2004, Macciò et al. 2005), the aim of this work is to investigate the impact of substructures below this mass threshold that is fixed by the current resolution limits of numerical simulations.
We would like to emphasize that we are using only one lensing plane, this means that we will consider only effects due to substructures being at the same redshift of the main lens (see Chen, Kravtsov & Keeton 2003, Metcalf 2005 for an estimation of the effects of haloes along the line of sight). In order to evaluate the number density substructures in the mass range we have made some extrapolations based on results from high resolution N-body simulations. The mass function of subhaloes inside the virial radius of an halo is close to a power law (Diemand et al. 2004, DMS04 hereafter, Gao et al. 2004, Reed et al. 2005):
| (2) |
with a slope , so that we expect to have a factor more subhaloes inside the viral radius if we move our mass threshold from to .
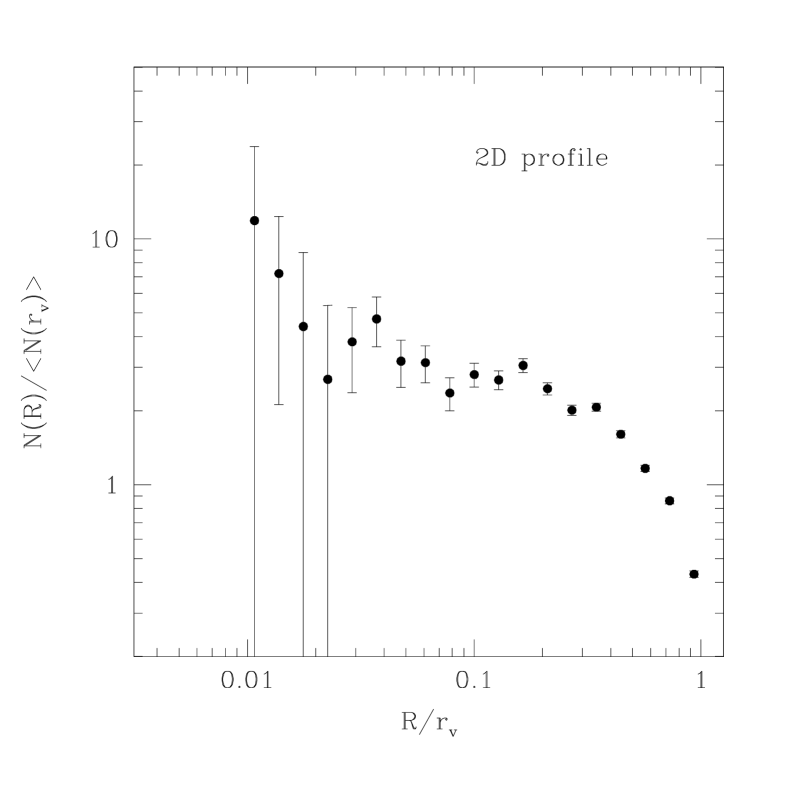
As said in the previous section such small haloes will affect the relation only if their distance from the images is of the same order or smaller than the distance between the images themselves. Therefore we need an estimation of the number of haloes inside a small area surrounding the images. This number will also depend on the distance of our area from the center, due to the fact that the number density of haloes increases approaching the center of the main halo (primary lens) as clearly shown in fig 1, which is based on numerical simulations of 4 galaxy size haloes (DMS04).
Consequently the number of subhaloes with a mass greater than inside an area at a distance from the center of the galaxy is:
| (3) |
where is the average number density of subhaloes with (being an arbitrary mass value) inside the virial radius and is the radial 2D number density of satellites at a projected distance from the center in units of (see figure 1). These last two quantities can be obtained directly from N-body simulations. In the following we will use results from DMS04 (table 1 of their paper, simulations G0-G3). Macciò et al. (2005) have shown that the presence of baryons inside subhaloes enhance the probability to find haloes close to the center of the galaxy with respect to results from dissipationless simulations. This is true for satellites with , which are massive enough to retain baryons inside their potential well and then form stars. Since we do not expect such effect for the mass scales involved in this work () we can use pure N-body simulation as starting point for our analysis.
Since the typical separation between images in lensed QSOs is roughly a few arcsec, we fix arcsec and arcsec2 ( hereafter). We remind that at a redshift of one arcsec corresponds to 4.55 kpc for the cosmological model adopted in this paper. Using eq. 3 and adopting a mass threshold for substructures of the number of subhaloes inside ranges from 4 to 12 (depending on the uncertainties on , see figure 1). For two haloes the surface mass density within the selected area is , this means a fraction of the total dark matter surface density in substructures, in good agreement with the results of Mao et al 2004.
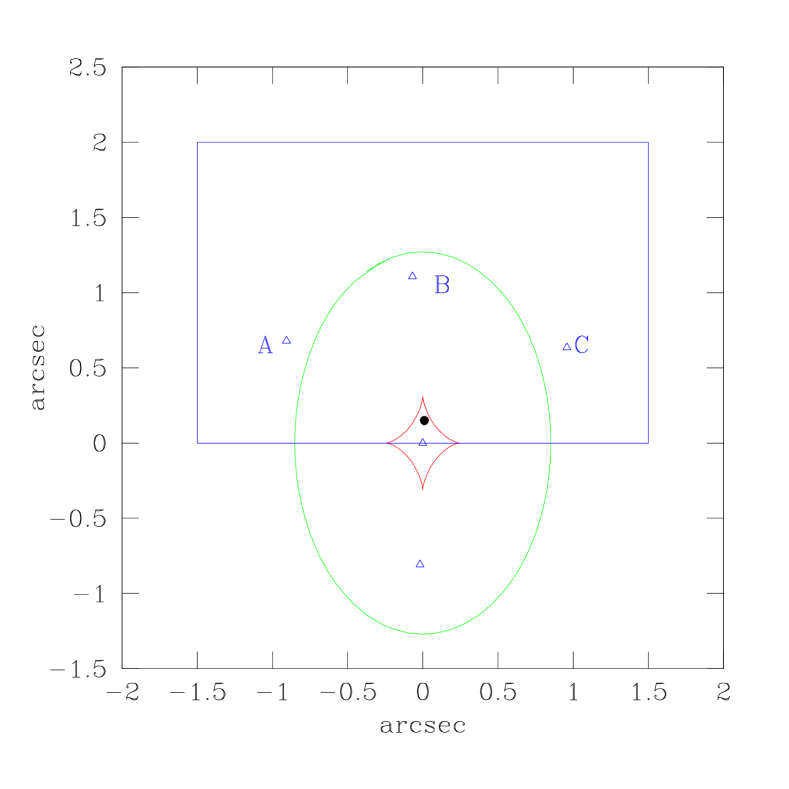
For each lensing configuration analyzed in this work we added a random number of substructures between to the primary lens with a random mass generated according to eq. 2 in the range . These subhaloes are then placed following the 2D density profile inside the area that encloses the three images (cfr the (blue) square in figure 7). We have modeled our subhaloes with an NFW (Navarro, Frenk & White 1997) density profile; for the subhaloes relevant for lensing substructure studied in this work, the NFW profile inferred from N-body simulation is the most natural choice, because on these mass scales the effect of baryons (that are able to modify the slope of the density profile for greater masses (Macciò et al. 2005)) is very tiny because the potential well of these haloes is not deep enough to retain them expecially in presence of a ionizing background. We have adopted different concentration parameters (see sec. 4.1) to mimic the scatter present in the mass-concentration relation (Bullock et al. 2001).
3.3 Extrahaloes
Lensing galaxies are not isolated object, since they usually belong to group of galaxies (Keeton et al. 2000). Moreover each galaxy has its own satellites galaxies with masses in the range . Consequently we have modeled the presence of these extrahaloes in the same way of the innerhaloes. In this work we call substructures or innerhaloes, haloes with mass that are close to the image position; we reserve the term extrahaloes for haloes with . We do not consider extrahaloes that for projection effects can lie inside the primary lens close to the images positions (i.e. Oguri 2005).
We considered three different categories of extrahaloes: i) haloes with mass and with a projected distance between and kpc, these represent the satellites galaxy of the primary lens (the expected number for these haloes can be estimated again form N-body simulation and it is roughly 6-8); ii) haloes with mass and distance kpc in order to mimic the presence of companion galaxies; iii) haloes with and kpc to take into account the possible presence of a nearby cluster of galaxies.
The number of extrahaloes has been fixed between 2-8 and 2-4 for the ii) and iii) case respectively, as suggested by observations/simulations (Metcalf 2005, Amara 2004). While the extrahaloes in case i) are placed in a circularly symmetric way around the center of the galaxy, the position of groups and clusters of galaxies must be modeled in an asymmetric way. Therefore we placed them only in the quadrant with positive coordinates in the lens plane (being the lens in ). We used SIE as lens model for extrahaloes to take into account the presence of baryons their-inside and we have generated 20.000 different configurations.
4 Results
In this section we present results of our Monte Carlo simulations. We have analyzed 3 cusp configurations: Config1 (figure 7), Config2 (figure 10) and Config3 (figure16). They mainly differ for the value of in the unperturbed case that grows from 0.01 for Config1 to 0.243 for Config3, due to a different position of the source inside the inner caustic curve.
4.1 Testing our model
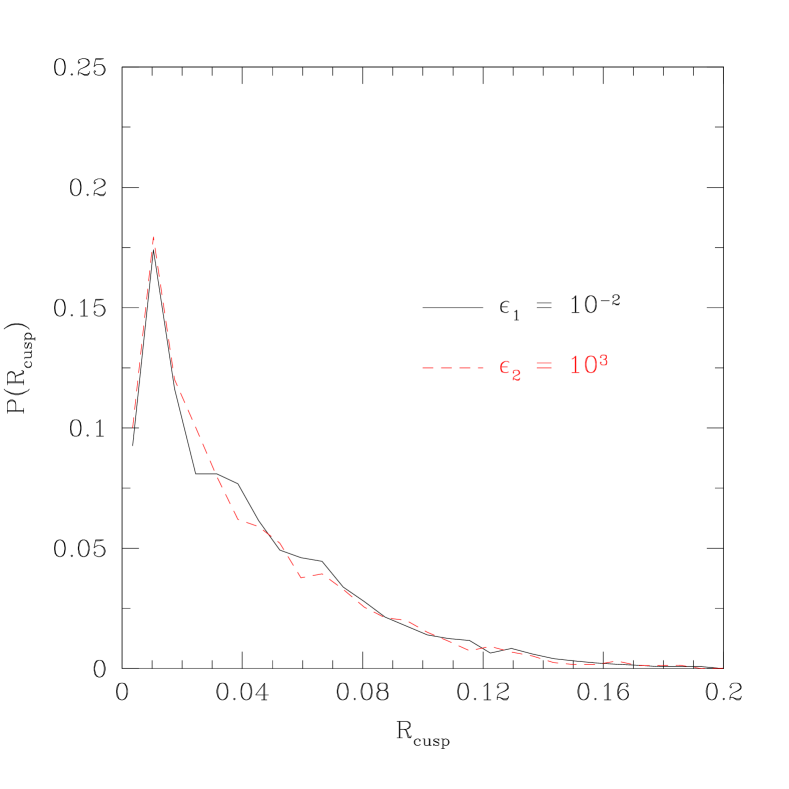
Before proceeding further in our analysis we present some tests on the parameter adopted in our lensing simulation. The presence of substructures acts both on positions and fluxes of the images. When a substructure is added the gravlens code adjusts the positions and fluxes of the images by minimizing the between the old (unperturbed) and new (perturbed) positions/fluxes. The value of depends on the error that we assign to the unperturbed positions and fluxes (usually these are the observational errors); this means that if the error on positions is smaller than the error on fluxes the code will change the latter ones more than moving the images to obtain a lower value for .
Therefore in principle the value of the perturbed is influenced by the error assigned to the position of the images. In figure 2 we clearly show that this effect is very small even for a big variation of the image position errors. This plot illustrates the probability distribution for (obtained using 20.000 realizations) when 4 substructures are added to the primary lens : the solid line is for an error on positions of arcsec () the dashed one for arcsec (i.e. the code has complete freedom in moving the images). The two distributions of the values are very similar, and this also confirms findings of other authors: the influence of substructures on the image positions is less strong than the one on fluxes (Kochanek 2004). We will adopt arcsec for the error on positions for all our simulations.
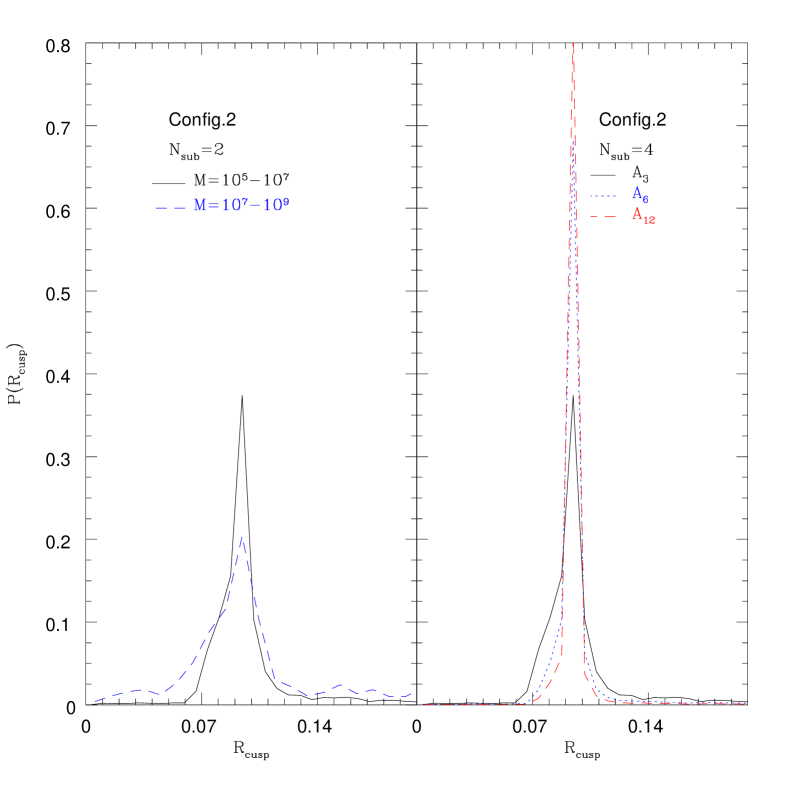
A correct determination of the subhaloes properties (see section 3.2) is a key ingredient in computing the value: figure 3 shows the influence of the number density and mass range of substructures on the relation. Both changing the area in which subhaloes are distributed (keeping fixed their number: left panel) or their mass range (right panel) leads to complete different results.
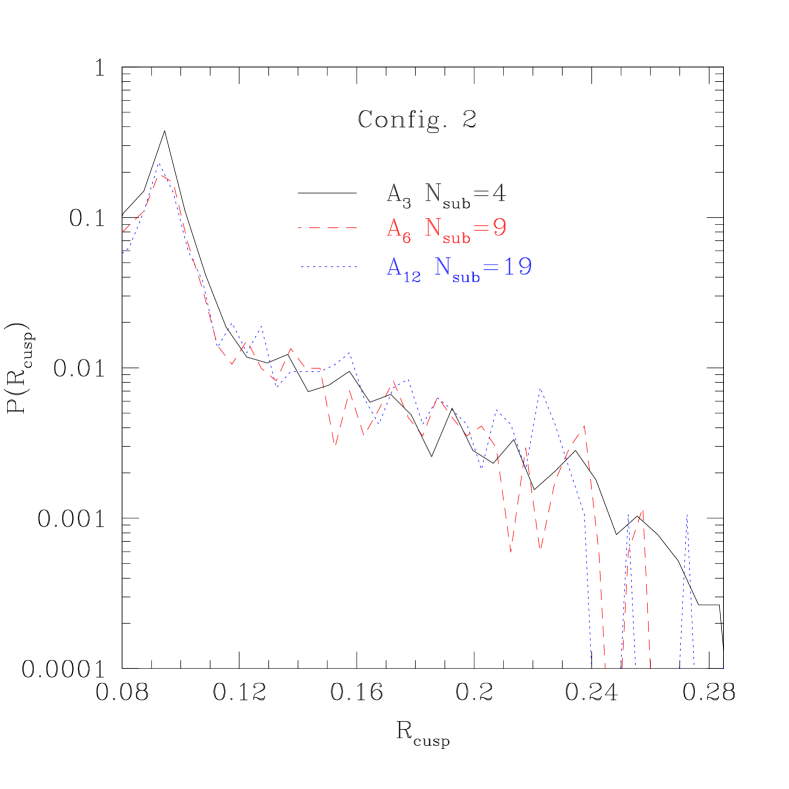
As second step we have tested if the subhaloes that live outside the small area () surrounding the images can substantially modify the relation. For this purpose we have defined three different areas for substructures for Config2: , and . The last one () is big enough to cover all the image positions. Changing the size of the area and his position in respect to the center of the lens, the number of substructures changes according to eq: 3. The number of subhaloes inside the three areas is 4, 9 and 19 respectively. Figure 4 shows our results. The probability distribution is weakly affected by the size of the area. This indicates that are the subhaloes close to the image positions the ones responsible for the relation modification.
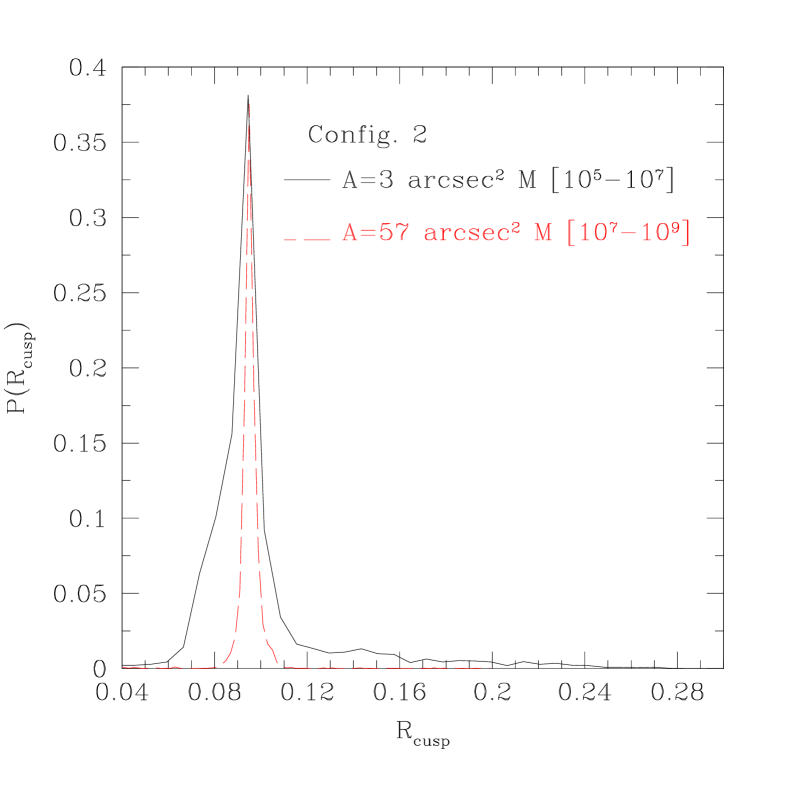
Figure 5 shows results for Config2 (figure 10) of the probability distribution for 3 subhaloes with mass inside (solid line) and for 8 subhaloes with inside an area of 57 arcsec2 ( with the exclusion of ). For this second population of substructures both the number density and the masses are over estimated by a large fraction. Nevertheless its effect on the cusp relation is very small and the probability distribution is close to a delta function centered on the unperturbed value.
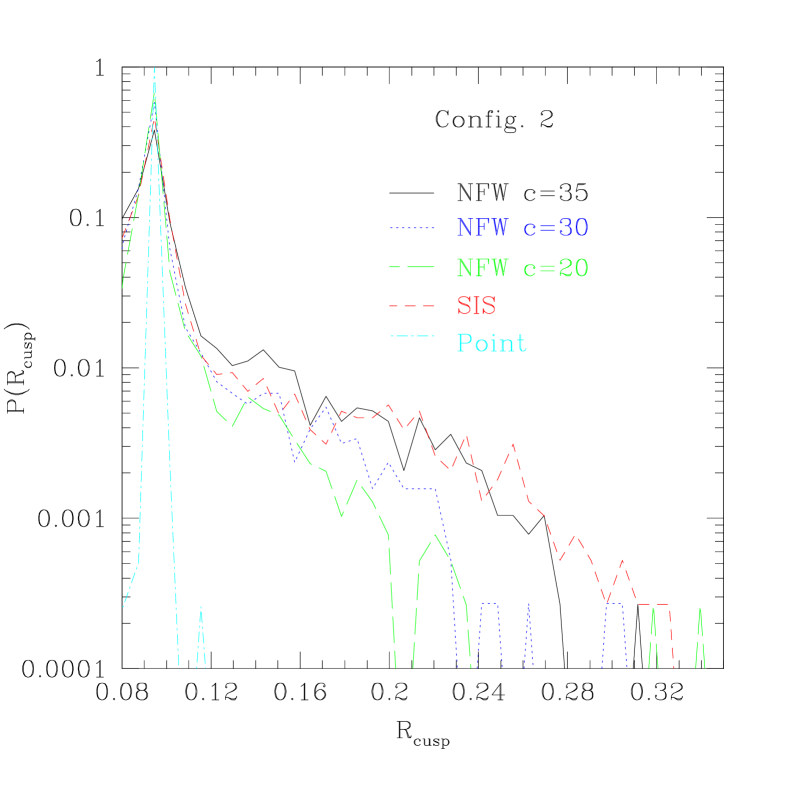
Modeling our subhaloes as NFW structures we have one more free parameter: the concentration. It is well know that the concentration correlates with the mass of the halo, even if a consistent scatter is present in this relation. Extrapolating results from Bullock et al 2001, the mean concentration in our mass range is around 33. In order to test the influence of the concentration of our subhaloes in modifying the relation we repeated our analysis keeping fix mass and position of the subhaloes and varying their concentrations. Results are shown in figure 6. As expected denser haloes have a stronger impact on the relation. We have also considered two other mass profiles for the subhaloes: SIS (singular isothermal sphere) and point like approximation. The first one, less favored by simulations, can be seen as an upper limit for the NFW profile, due to the fact that its inner slope for the density profile is proportional to . For this kind of subhalo model the probability is just slightly above the ones for NFW haloes with c=35, so we do not expect a big change in our results using SIS instead of NFW subhaloes. On the other hand the point mass approximation leads to an underestimate of the effect of subhaloes on since for a fixed mass a point-like object has a smaller Einstein radius than an NFW halo (Keeton 2003). In the following we have adopted a concentration parameter of 35 for our subhaloes in order to try to maximize their effect on the relation.
4.2 Configuration 1
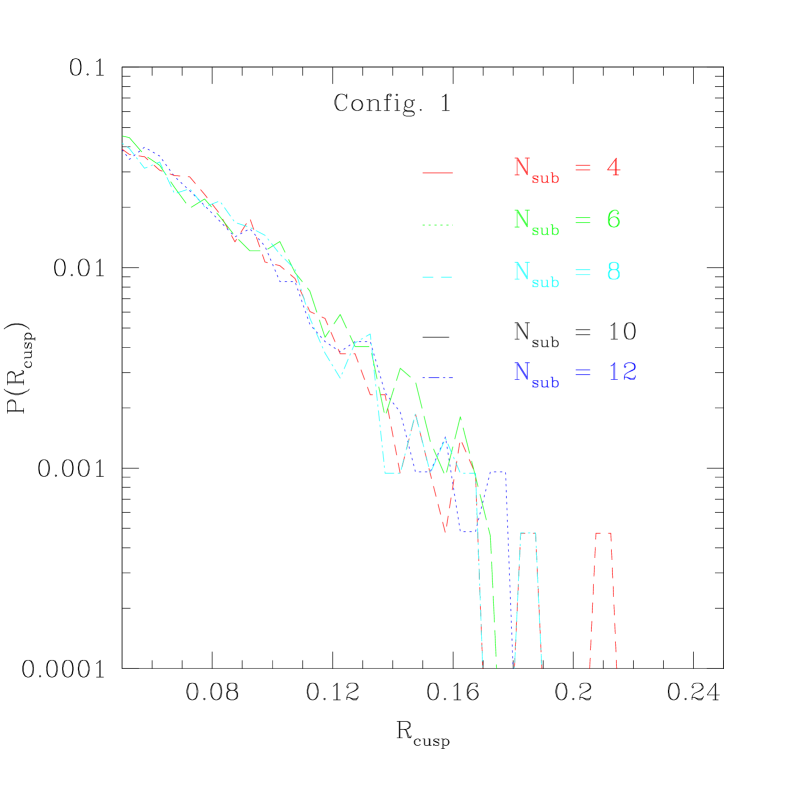
In the first configuration analyzed (Config1 hereafter) the source is close to the right cusp of the inner caustic curve (see fig 7) and the unperturbed value is 0.01. The critical and caustic curves refer to the unperturbed case but they are not different from perturbed ones at the level of resolution.
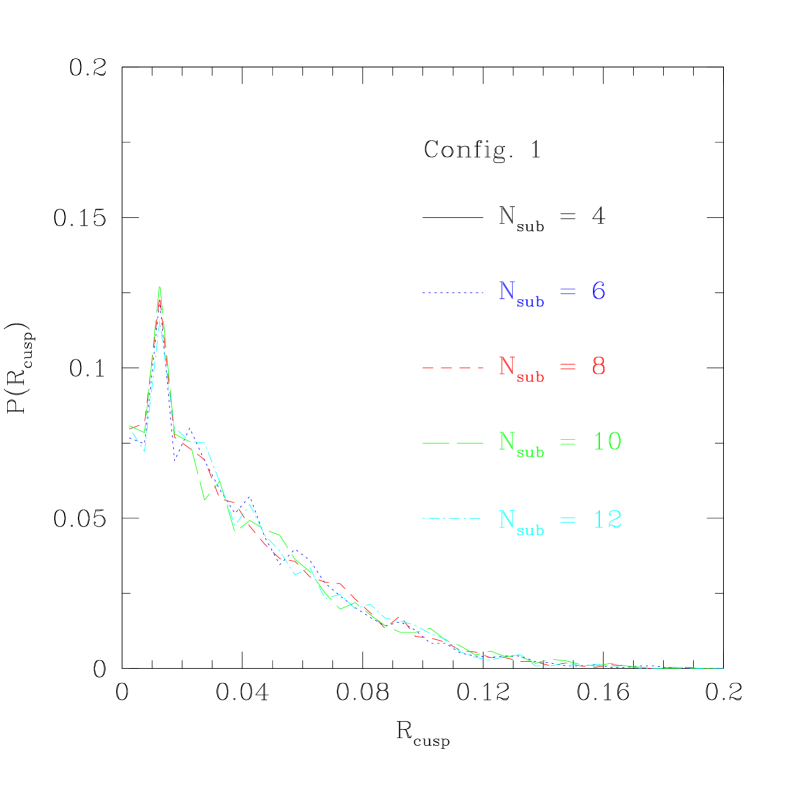
For this configuration we have generated 20.000 different lensing systems that include substructures according to eq: 3. In figure 8 is shown the probability distribution for for different numbers of substructures. The maximum of the probability is obtained for the unperturbed value (0.01) and the tail of the distribution extends to but for a very low number of configurations (less than 1.0%). Figure 9 shows in a logarithmic plot the tail of the distribution presented in figure 8: it is possible to note that an increase of the total number of substructures (from 4 to 6) does not substantially change the value of .
From figure 8 one see that in the 10% of the configurations the final value of is even less than the unperturbed value and it is closer to the theoretical expectation of (see next section on the second configuration for more details).
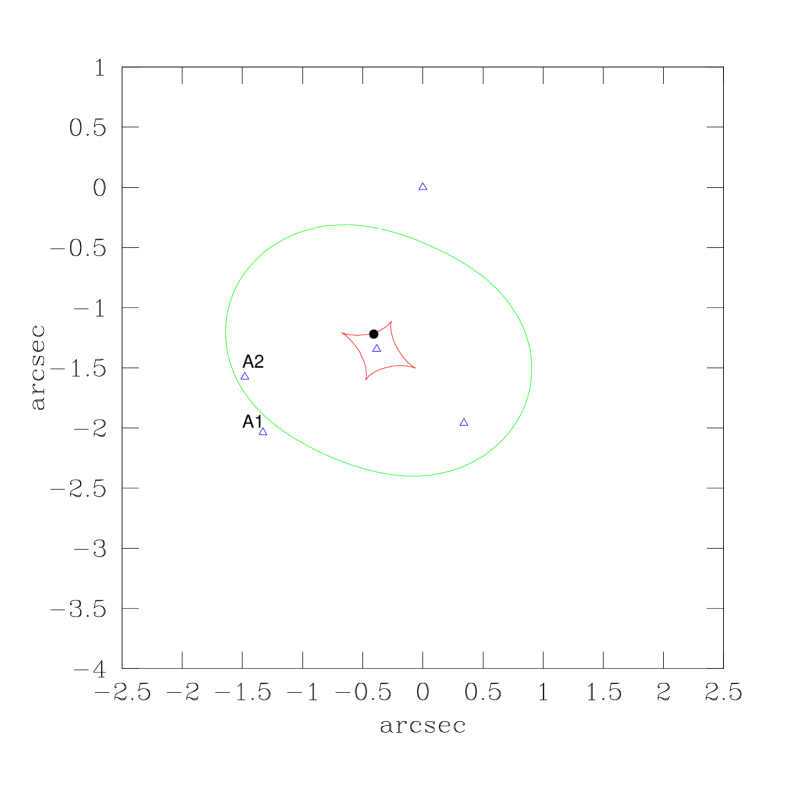
4.3 Configuration 2
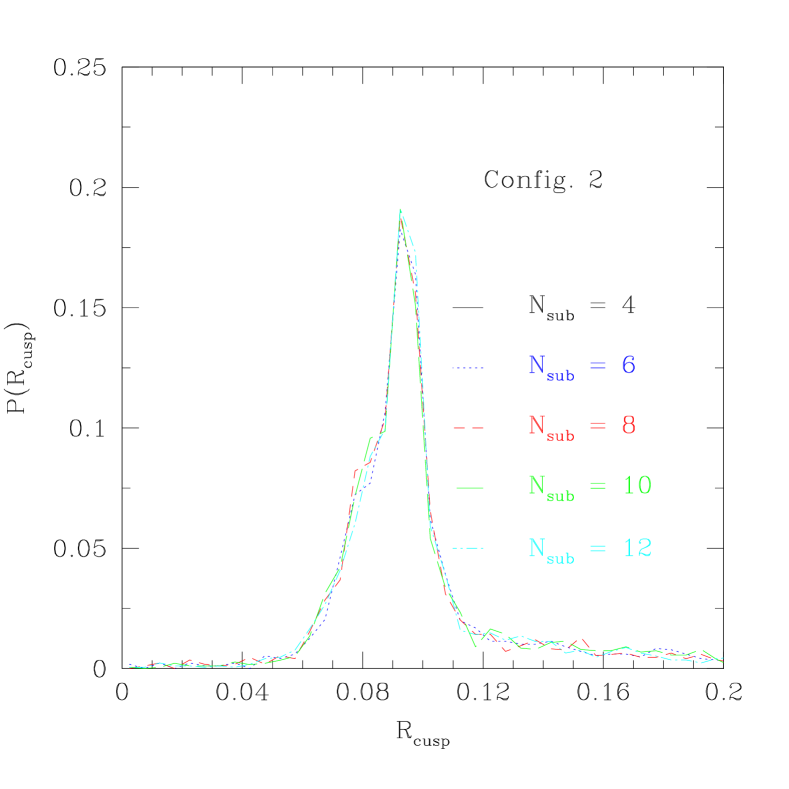
In this configuration (Config2 hereafter) the source is close to the upper cusp of the inner caustic curve (see fig 10) with an unperturbed value of .
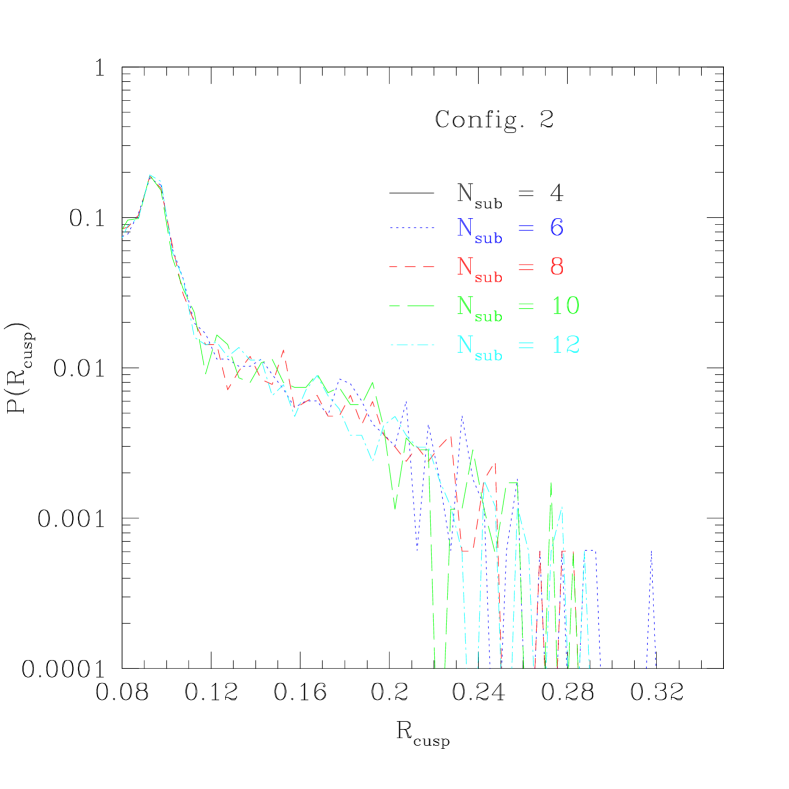
Figure 11 shows the analogous of figure 8 for Config2 and figure 12 shows the tail of the distribution for large values of . Even in this case the maximum of the probability distribution is centered on the unperturbed value. Here the distribution of the values of is more symmetric than for Config1 and it is more evident that the effect of substructures not only increase the value of the cusp ratio but can also reduce it.
To better illustrate this effect we have isolated one of the configurations in which we find a reduction of (figure 13). When the distribution of subhaloes is non symmetric in respect to the triplets of images and one of the perturbers is close to one of the external images the latter image results to be more magnified than the others. In the unperturbed configuration and this causes . On the other hand if the perturbers increase without changing considerably the magnification of the other images, this will enhance the sum pushing it closer to , giving a smaller (0.07 in the case of figure 13).
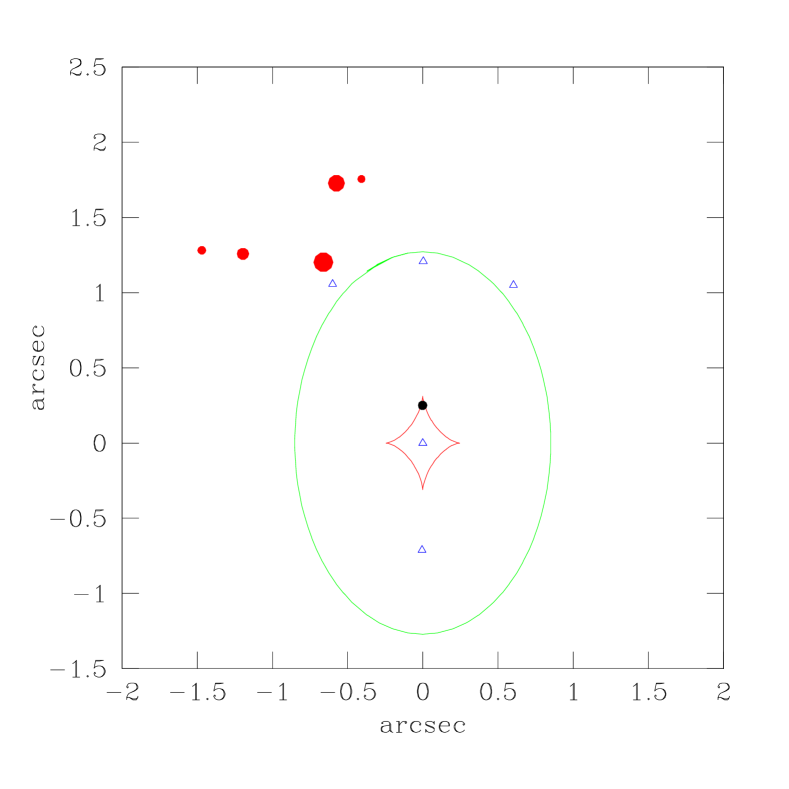
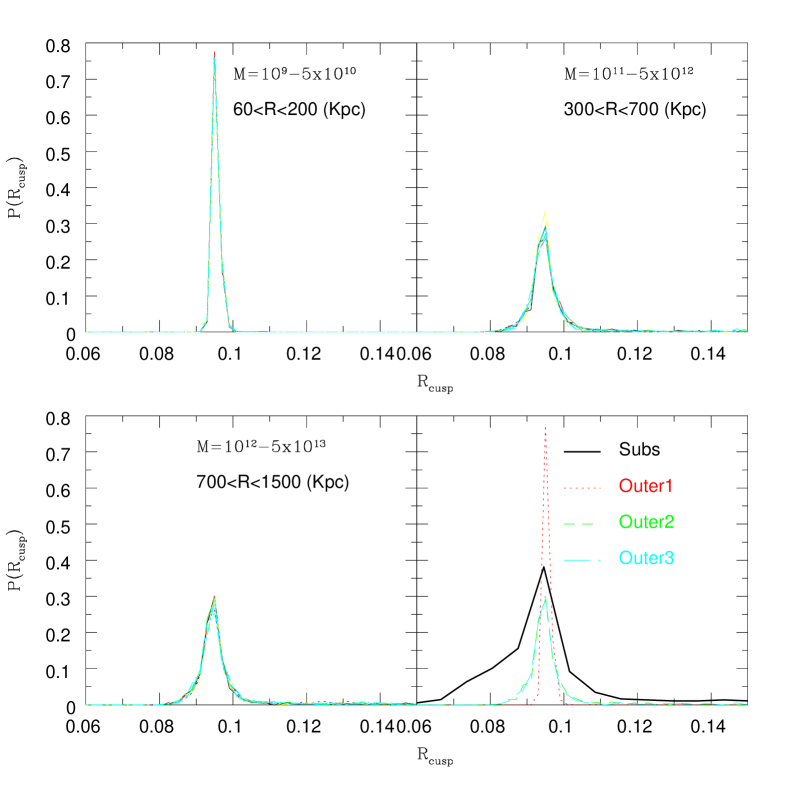
Figure 14 shows the effects of extra haloes on the value for Config2. For all the three extra-haloes mass ranges considered, the modifications in the cusp relation are very small and the value of is not very sensitive to the total number of extra-haloes we generated (results for different number of subhaloes are shown by different curves, which are almost overlapping in the various panels).
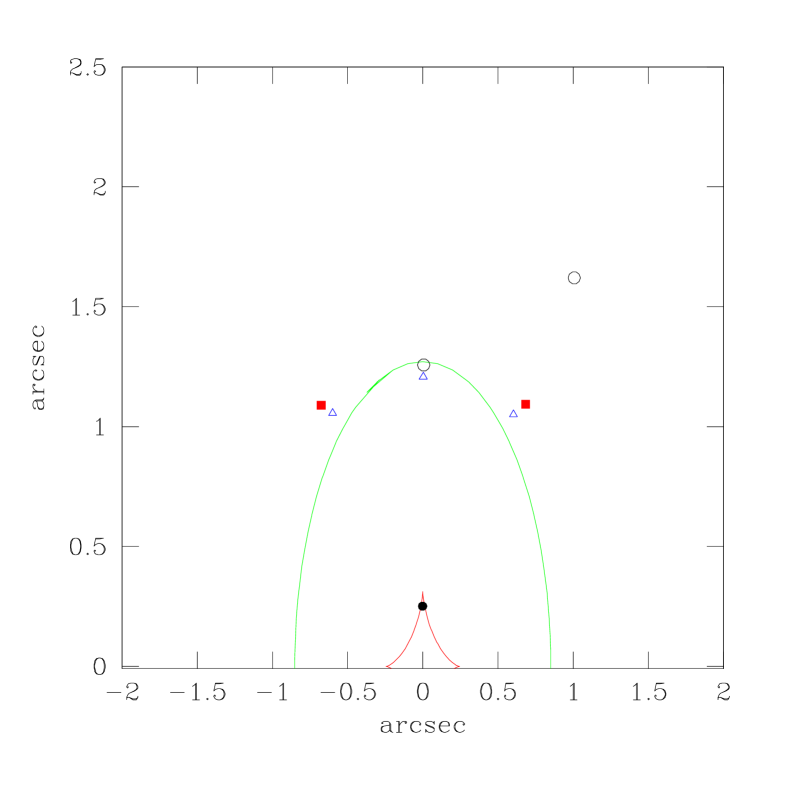
For this configuration we have performed one more test: we have modified by hand the fluxes of the three images in order to obtain an high value of (). Then we used the gravlens software to find positions and masses of two subhaloes (with masses ) with the constrain of simultaneously reproducing positions and fluxes of our modified images. We have found two configurations for subhaloes that are shown in figure 15. In the first case (solid squares) the mass of the substructures is roughly the same (), they are close to the external images with a distance of 0.08 arcsec and the perturbed value of is 0.387. In the second case (open circles) the mass of the subhalo close to the central image is with a distance of 0.06 arcsec, while is the mass of the second one that is far away from the central image, for a perturbed value of equal to 0.372.
The aim of this test is to show that there is nearly always the possibility to explain an anomalous flux ratio using subhaloes, but that their positions and masses must be tuned in a very precise way (i.e distances between images and subhaloes must be less than 0.08 arcsec). Most important, our Monte Carlo simulations show that the probability of obtaining such a fine tuning is very low. As a consequence we conclude that an explanation for the high number of observed anomalous flux ratios in lensed QSOs based on the presence of subhaloes in the mass range we have tested is very unlikely.
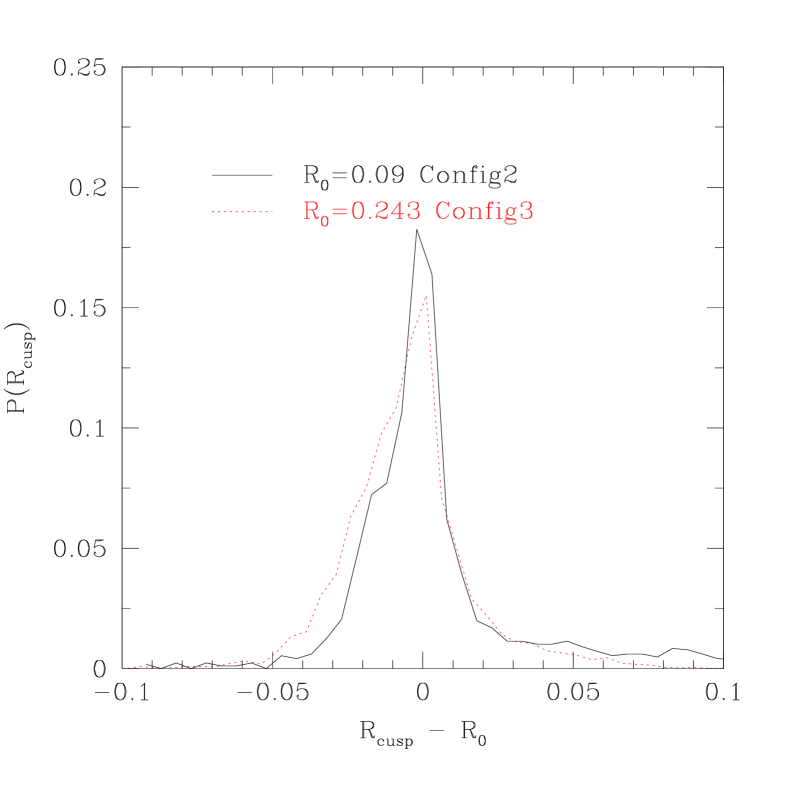
4.4 Configuration 3
In the last cusp configuration analyzed (Config3) the R-cusp relation is not completely satisfied even in the unperturbed case (, fig 16). Figure 17 shows the R-cusp probability distribution for Config2 and Config3 normalized to the unperturbed value. There are no appreciable differences between the two configurations. The probability distributions have almost the same width and the same maximum value () and both are centered on the respective unperturbed value. This means that the ability of substructures to modify the relation is nearly independent on the original value of the cusp ratio.
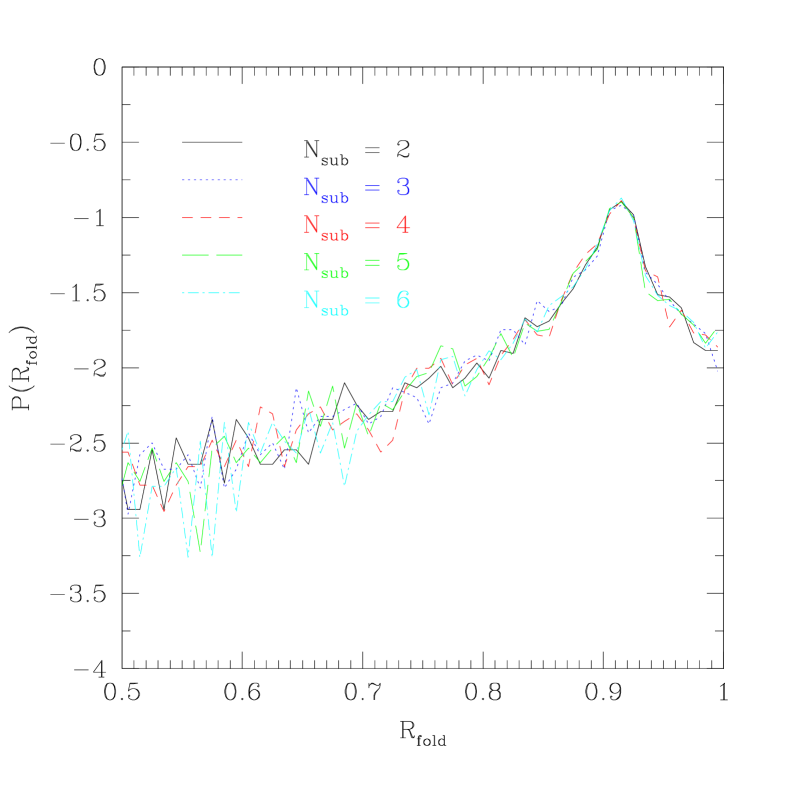
5 Fold Relation
For sake of completeness we have also considered a fold case similar to the configuration of the well known system PG1115 (Impey et al. 1998). In this case we define the fold relation as the ratio between the magnification of the closest pair on opposite sides of the critical curve (cfr fig 18):
| (4) |
By applying our procedure to this test fold case we found that it is easier to modify the value of the unperturbed with respect to the one of , as clearly shown in fig 19. In our computational procedure the position of the source can be changed by the gravlens code, in order to minimize the of the lens configuration. While this does not affect the relation it can be important in the fold case: as pointed out by Keeton, Gaudi and Petters (2005) the degree to which can differ from one for realistic smooth lenses depends, in addition to the angular structure of the lens potential, not only on the distance of the source from the caustic but also on its location along the caustic itself. So the the values we got for are due both to the effects of subhaloes and both to the shift along the caustics of the source.
Thus, it is not possible to conclude from alone whether observed flux ratios are anomalous or not.
6 Discussion & Conclusions
Quasars that are being gravitationally lensed into multiple images have recently been used to place limits on the surface density of cold dark matter subhaloes (Mao & Schneider 1998, Metcalf & Madau 2001, Chiba 2002, Metcalf & Zhao 2002, Dalal & Kochanek 2002, Chen Kravtsov & Keeton 2003, Bradac et al. 2004, Mao et al. 2004). Small mass clumps that happen to lie near the images affect the observed magnification ratios. The question arises as to whether these observations are compatible with distortions expected to occur from dark matter substructures and satellite galaxies within the CDM model. Recent results based on numerical N-body (Amara et al. 2004, Rozo et al. 2005) and hydro simulations (Macciò et al. 2005) have shown that it is hard to reconcile the observed high number of cups relation violation with the total amount of substructures predicted by the CDMmodel. These studies were limited by the present achievable numerical resolution that permits to resolve DM haloes down to masses .
In this work we have quantified the effects of smaller mass clumps () on the observed violation of the R cusp relation. We employed results from N-body simulations to estimate the expected number of subhaloes in this low mass range. Due to the small mass of the perturbers we have restricted our analysis only to those close (in 2D) to the images positions. For the mass range inspected in this work and for the typical distance between images (few arcsecs) this leads to a number of perturbers . All the subhaloes are modeled as NFW spheres and we have generated more than different lensing configurations, varying masses, positions and number of subhaloes.
The main finding of our work is that on a statistical basis this class of perturbers is not able to modify consistently the unperturbed R-cusp relation. Values of in the observed range () are obtained in only less than 1% of the analyzed systems. The ability of subhaloes in modifying the unperturbed value of is found to be independent from the value of itself.
These results are not in contradiction with the ones in the literature (Keeton et al. 2003, and more recently Miranda & Jetzer 2005 and references therein). As shown in figure 15 it is possible to use subhaloes in the mass range to obtain high values of case by case, but a tight fine tuning between the location of the images and masses/positions of the perturbers is needed .
In addition, we have also considered the impact of massive haloes placed outside the primary lens (from groups of galaxies to a close cluster) by modeling them in the same way of the subhaloes. Our simulations show, as expected, that their contribution in modifying the R cusp relation is tiny and almost negligible with respect to the effect of subhaloes.
Results from this work together with results from numerical simulations seem to be in disagreement with the standard picture which explains the anomalous flux ratio by means of dark matter satellites. Interestingly, while on dwarf galaxy scale there is an excess of dark matter subhaloes with respect to visible satellites, we have shown that the predicted level of substructures on smaller scales is not sufficient to explain the observed level of violation in the cusp relation.
Possible solutions to this problem can reside in microlensing for some of the lensing systems observed in the optical band (Metcalf 2005, Keeton et al 2005), or in the presence of haloes lying along the line of sight between the lens and the observer (Chen et al. 2003, Metcalf 2005), although total effect of this kind of perturbers is not yet clear.
Acknowledgments
We thank Chuck Keeton for making available the gravlens software and for his comments on an early version of this work. We also thank J. Diemand for making available his Nbody simulations and M. Bartelmann, Ph. Jetzer and R. Piffaretti for useful discussions. An anonymous referee is also thanked for his suggestions that improved the presentation of this work. Marco Miranda was partially supported by the Swiss National Science Foundation.
References
- [\citeauthoryearAmara2004] Amara, A, Metcalf, R.B., Cox, T.J. & Ostriker, J.P., 2004, astro-ph/0411587
- [\citeauthoryearBlandford & Narayan1986] Blandford R., Narayan R., 1986, ApJ, 310, 568
- [\citeauthoryearBode, Ostriker, & Turok2001] Bode P., Ostriker J. P., Turok N., 2001, ApJ, 556, 93
- [\citeauthoryearBradač et al.2004] Bradač M., Schneider P., Lombardi M., Steinmetz M., Koopmans L. V. E., Navarro J. F., 2004, A&A, 423, 797
- [\citeauthoryearBullock, Kravtsov, & Weinberg2000] Bullock J. S., Kravtsov A. V., Weinberg D. H., 2000, ApJ, 539, 517
- [Bullock et al.(2001)] Bullock, J. S., Kolatt, T. S., Sigad, Y., Somerville, R. S., Kravtsov, A. V., Klypin, A. A., Primack, J. R., & Dekel, A. 2001, MNRAS, 321, 559
- [\citeauthoryearChen, Kravtsov, & Keeton2003] Chen J., Kravtsov A. V., Keeton C. R., 2003, ApJ, 592, 24
- [Chiba 2002] Chiba, M. 2002, ApJ, 565, 17
- [Dalal & Kochanek 2002] Dalal, N. & Kochanek, C. S. 2002, ApJ, 572, 25
- [\citeauthoryearDiemand, Moore, & Stadel2004] Diemand J., Moore B., Stadel J., 2004, MNRAS, 352, 535
- [\citeauthoryearGao et al.2004] Gao L., De Lucia G., White S. D. M., Jenkins A., 2004, MNRAS, 352, L1
- [\citeauthoryearGhigna et al.2000] Ghigna S., Moore B., Governato F., Lake G., Quinn T., Stadel J., 2000, ApJ, 544, 616
- [\citeauthoryearGerhard et al.2001] Gerhard O., Kronawitter A., Saglia R. P., Bender R., 2001, AJ, 121, 1936
- [\citeauthoryearKeeton, Kochanek, & Falco1998] Keeton C. R., Kochanek C. S., Falco E. E., 1998, ApJ, 509, 561
- [Keeton et al.(2000)] Keeton, C. R., Christlein, D., & Zabludoff, A. I. 2000, ApJ, 545, 129
- [Keeton 2001] Keeton, C. 2001, preprint, astro-ph/0112350
- [Keeton, Gaudi, & Petters 2003] Keeton, C. R., Gaudi, B. S., & Petters, A. O. 2003, ApJ, 598, 138
- [Keeton 2003] Keeton, C. R. 2003, ApJ, 584, 664
- [Keeton 2005] Keeton, C.R., Burles, S., Schechter, P.L. & Wambsganss, J. 2005, ApJL submitted, astro-ph/0507521
- [Keeton et al.(2005)] Keeton, C. R., Gaudi, B. S., & Petters, A. O. 2005, ApJ, 635, 35
- [\citeauthoryearKlypin et al.1999b] Klypin A., Kravtsov A. V., Valenzuela O., Prada F., 1999, ApJ, 522, 82
- [\citeauthoryearKochanek1995] Kochanek C. S., 1995, ApJ, 453, 545
- [Kochanek et al. 2004] Kochanek, C.S., Schneider, P., Wambsganss, J., 2004, Part 2 of Gravitational Lensing: Strong, Weak & Micro, Proceedings of the 33rd Saas-Fee Advanced Course, G. Meylan, P. Jetzer & P. North, eds. (Springer-Verlag: Berlin), preprint astro-ph/0407232
- [Kochanek & Dalal 2004] Kochanek, C. S. & Dalal, N. 2004, ApJ, 610, 69
- [Koopmans et al.(2003)] Koopmans, L. V. E., et al. 2003, ApJ, 595, 712
- [\citeauthoryearKormann, Schneider, & Bartelmann1994] Kormann R., Schneider P., Bartelmann M., 1994, A&A, 284, 285
- [\citeauthoryearMaccio1998] Macciò A.V., Moore B., Stadel J. & Diemand J., 2005 MNRAS in press, astro-ph/0506125
- [\citeauthoryearMao & Schneider1998] Mao S., Schneider P., 1998, MNRAS, 295, 587
- [\citeauthoryearMao et al.2004] Mao S., Jing Y., Ostriker J. P., Weller J., 2004, ApJ, 604, L5
- [\citeauthoryearMaoz & Rix1993] Maoz D., Rix H., 1993, ApJ, 416, 425
- [\citeauthoryearMao1992] Mao S., 1992, ApJ, 389, 63
- [Metcalf 2002] Metcalf, R. B. 2002, ApJ, 580, 696
- [Metcalf & Madau 2001] Metcalf, R. B. & Madau, P. 2001, ApJ, 563, 9
- [Metcalf & Zhao 2002] Metcalf, R. B. & Zhao, H. 2002, ApJL, 567, L5
- [Metcalf(2005)] Metcalf, R. B. 2005, ApJ, 629, 673
- [Miranda2005] Miranda M. & Jetzer P., 2005, MNRAS submitted
- [\citeauthoryearMoore et al.1999] Moore B., Ghigna S., Governato F., Lake G., Quinn T., Stadel J., Tozzi P., 1999, ApJ, 524, L19
- [\citeauthoryearNavarro, Frenk & WhiteNavarro et al.1996] Navarro J. F., Frenk C. S., White S. D. M., 1996, ApJ, 462, 563
- [\citeauthoryearOguri2005] Oguri M., 2005, MNRAS, 361, L38
- [\citeauthoryearReed et al.2005] Reed D., Governato F., Quinn T., Gardner J., Stadel J., Lake G., 2005, MNRAS, 359, 1537
- [\citeauthoryearRozo et al.2005] Rozo E., Zentner A. R., Bertone G. F. & J. Chen, 2005, ApJ submitted, preprint astro-ph/0506573
- [\citeauthoryearSchechter & Wambsganss2002] Schechter P. L., Wambsganss J., 2002, ApJ, 580, 685
- [Schneider & Weiss 1992] Schneider, P. & Weiss, A. 1992, A&A, 260, 1
- [\citeauthoryearSpergel & Steinhardt2000] Spergel D. N., Steinhardt P. J., 2000, PhRvL, 84, 3760
- [\citeauthoryeartonry1998] Tonry, J.L., 1998, AJ, 115, 1
- [Treu & Koopmans(2004)] Treu, T., & Koopmans, L. V. E. 2004, ApJ, 611, 739
- [Zakharov(1995)] Zakharov, A. F. 1995, A&A, 293, 1
- [\citeauthoryearZentner & Bullock2003] Zentner A. R., Bullock J. S., 2003, ApJ, 598, 49