11email: capetti@to.astro.it 22institutetext: Universitá di Torino, Via Giuria 1, I-10125, Torino, Italy
22email: balmaverde@ph.unito.it
The host galaxy/AGN connection in nearby early-type galaxies ††thanks: Based on observations obtained at the Space Telescope Science Institute, which is operated by the Association of Universities for Research in Astronomy, Incorporated, under NASA contract NAS 5-26555.
This is the first of a series of three papers exploring the connection between the multiwavelength properties of AGNs in nearby early-type galaxies and the characteristics of their hosts. We selected two samples, both with high resolution 5 GHz VLA observations available and providing measurements down to 1 mJy level, reaching radio-luminosities as low as 1019 W Hz-1. We focus on the 116 radio-detected galaxies as to boost the fraction of AGN with respect to a purely optically selected sample. Here we present the analysis of the optical brightness profiles based on archival HST images, available for 65 objects. We separate early-type galaxies on the basis of the slope of their nuclear brightness profiles, into core and power-law galaxies following the Nuker’s scheme, rather than on the traditional morphological classification (i.e. into E and S0 galaxies). Our sample of AGN candidates is indistinguishable, when their brightness profiles are concerned, from galaxies of similar optical luminosity but hosting weaker (or no) radio-sources. We confirm previous findings that relatively bright radio-sources (L W Hz-1) are uniquely associated to core galaxies. However, below this threshold in radio-luminosity core and power-law galaxies coexist and they do not show any apparent difference in their radio-properties. Not surprisingly, since our sample is deliberately biased to favour the inclusion of active galaxies, we found a higher fraction of optically nucleated galaxies. Addressing the multiwavelength properties of these nuclei will be the aim of the two forthcoming papers.
Key Words.:
galaxies: active, galaxies: bulges, galaxies: elliptical and lenticular, cD, galaxies: nuclei, galaxies: structure1 Introduction
It is becoming increasingly clear that most (if not all) galaxies host a supermassive black hole (SMBH) in their centers (e.g. Kormendy & Richstone 1995). The tight relationships between the SMBH mass and the stellar velocity dispersion (Ferrarese & Merritt 2000; Gebhardt et al. 2000) as well as with the mass of the spheroidal component of their host galaxies (e.g. Marconi & Hunt 2003) clearly indicate that they follow a common evolutionary path. As recently demonstrated by Heckman et al. (2004) the synchronous growth of SMBH (traced by energy output of AGNs) and galaxies (evidenced by their star formation rate) is at work even now, in the nearby Universe. But despite this fundamental breakthrough in our understanding of the SMBH/galaxy system and the fact that historically the first evidences for the existence of SMBH were provided by the nuclear activity in form of an Active Galactic Nucleus (AGN), we still lack a clear picture of the precise relationship between AGN and host galaxies. For example, while spiral galaxies preferentially harbour radio-quiet AGN, early-type galaxies host both radio-loud and radio-quiet AGN. Similarly, radio-loud AGN are generally associated with the most massive SMBH as there is a median shift between the radio-quiet and radio-loud distribution, but both distributions are broad and overlap considerably (e.g. Dunlop et al. 2003).
In the last decade, thanks to HST imaging, a new picture of the properties of nearby galaxies also emerged. Nearly all galaxies have singular starlight distributions with surface brightness diverging as with (e.g. Lauer et al. 1995) and the distribution of cusp slopes in both stellar luminosity density and projected surface brightness is bimodal (Gebhardt et al. 1996; Faber et al. 1997). In some cases decreases only slowly toward the center and a steep cusp continues to the HST resolution limit; these systems are classified as “power-law” galaxies. In other objects the projected profile breaks to a shallow inner cusp with and these form the class of “core galaxies”. A small number of “intermediate” galaxies have been also identified (e.g. Ravindranath et al. 2001) that have cusp slopes with but the ensemble of cusp slopes of the spheroidal component of galaxies is still bimodal. Faber et al. examined how the central structure correlates with other galaxy properties, showing that luminous early-type galaxies preferentially have cores, whereas most fainter spheroids have power-law profiles. Moreover, cores are slowly rotating and have boxy isophotes, while power-laws rotate rapidly and are disky. This scheme fits nicely with the revision of the Hubble sequence proposed by Kormendy & Bender (1996).
Clearly, these recent developments provide us with a new framework in which to explore the connection between host galaxies and AGNs. In particular, early-type galaxies appear to be the critical class of objects, in which core and power-law galaxies coexist, i.e. where the transition between the two profiles classes occur.
This study must be limited to samples of relatively nearby galaxies. In fact the Nuker classification can only be obtained when the nuclear region, potentially associated to a shallow cusp, can be well resolved. The radius at which the break in the brightness profiles occurs are in the range 10 pc - 1 kpc; the most compact cores will be barely resolved already at a distance of 40 Mpc (where 10 pc subtend an angle of 005) even in the HST images. Furthermore, high quality radio-images are required for an initial selection of AGN candidates. As discussed in more details in Sect. 2 two such large samples of nearby early-type galaxies have been already studied at radio-wavelengths and they will represent the starting point for our analysis.
In order to explore the multiwaveleghts properties of these candidates AGN we will take advantage on the substantial coverage supplied by both the HST and Chandra archives when nearby galaxies are concerned. The high resolution and sensitivity of these instruments will enable us to isolate the nuclear emission, if present, in both the optical and X-ray band down to unprecedented low luminosity levels. This will open the possibility of building three-bands diagnostic diagrams comparing the radio, optical and X-ray emission, to identify genuine low luminosity AGN and to explore their spectral energy distributions.
The plan of this series of papers is as follows: in this first part we will define the samples to be examined, collect the available HST images, analyze the galaxies brightness profiles and compare our results with other samples studied in the past. In the two forthcoming papers we will firstly discuss the properties of objects with a core profile, while power-law galaxies will be discussed and compared in a third paper.
We adopt a Hubble constant of H km s-1 Mpc-1.
2 Sample selection and description
| Name | Alt. Name | V | mK | Gal. AV | Fradio | Fcore |
|---|---|---|---|---|---|---|
| UGC 0167 | NGC 0063 | 1197 | 9.2570.027 | 0.369 | 3.60.2a | |
| UGC 0968 | NGC 0524 | 2429 | 7.1630.012 | 0.274 | 1.40.1a | |
| UGC 5292 | NGC 3032 | 1652 | 9.6480.024 | 0.056 | 3.70.7a | |
| UGC 5617 | NGC 3226 | 1410 | 8.5700.037 | 0.075 | 3.60.2a | |
| UGC 5663 | NGC 3245 | 1456 | 7.8620.010 | 0.083 | 3.30.2a | |
| UGC 5902 | NGC 3379,M 105 | 951 | 6.2700.018 | 0.081 | 0.70.1a | |
| UGC 5959 | NGC 3414,ARP 162 | 1651 | 7.9810.014 | 0.081 | 5.00.2a | |
| UGC 6153 | NGC 3516 | 2902 | 8.5120.027 | 0.140 | 15.51.7a | |
| UGC 6297 | NGC 3607 | 1022 | 7.2760.021 | 0.069 | 2.60.1a | |
| UGC 6605 | NGC 3773,MRK 743 | 1052 | 10.6960.063 | 0.089 | 1.60.1a | |
| UGC 6742 | NGC 3870,MRK 186 | 981 | 10.8200.042 | 0.052 | 4.40.9a | |
| UGC 6834 | NGC 3928,MRK 190 | 1207 | 9.6740.025 | 0.065 | 7.61.0a | |
| UGC 6860 | NGC 3945 | 1500 | 7.5260.025 | 0.094 | 1.00.1a | |
| UGC 6877 | IC 0745,MRK 1308 | 1162 | — | 0.069 | 0.80.1a | |
| UGC 6946 | NGC 3998 | 1285 | 7.3650.010 | 0.053 | 832b | |
| UGC 6985 | NGC 4026 | 1173 | 7.5840.019 | 0.073 | 1.40.1a | |
| UGC 7005 | NGC 4036 | 1690 | 7.5620.019 | 0.078 | 2.90.2a | |
| UGC 7103 | NGC 4111 | 1006 | 7.5530.018 | 0.048 | 2.30.1a | |
| UGC 7142 | NGC 4143 | 1135 | 7.8530.009 | 0.042 | 6.70.3a | |
| UGC 7203 | NGC 4168 | 2392 | 8.4370.021 | 0.120 | 4.50.2a | |
| UGC 7256 | NGC 4203 | 1263 | 7.4060.014 | 0.040 | 12.50.4a | |
| UGC 7311 | NGC 4233 | 2417 | 8.7840.032 | 0.079 | 1.90.1a | |
| UGC 7329 | NGC 4250 | 2308 | 9.1400.027 | 0.069 | 6.41.0a | |
| UGC 7360 | NGC 4261,3C 270 | 2238 | 7.2630.028 | 0.060 | 8300400b | 315 |
| UGC 7386 | NGC 4278 | 804 | 7.1840.011 | 0.095 | 35111b | |
| UGC 7494 | NGC 4374,M 84 | 1004 | 6.2220.023 | 0.134 | 2800100b | 350 |
| UGC 7515 | NGC 4385,MRK 052 | 2172 | 9.7760.046 | 0.082 | 3.70.2a | |
| UGC 7575 | NGC 4435 | 887 | 7.2970.016 | 0.100 | 1.20.1a | |
| UGC 7614 | NGC 4459 | 1294 | 7.1520.011 | 0.153 | 0.80.1a | |
| UGC 7629 | NGC 4472,M 49 | 940 | 5.3960.025 | 0.074 | 9510 b | 57 |
| UGC 7654 | NGC 4486,M 87 | 1361 | 5.8120.019 | 0.074 | 71900400b | 4000 |
| UGC 7718 | NGC 4526 | 665 | 6.4730.020 | 0.074 | 3.10.2a | |
| UGC 7760 | NGC 4552,M 89 | 392 | 6.7280.024 | 0.136 | 1214b | |
| UGC 7797 | NGC 4589 | 2233 | 7.7580.023 | 0.093 | 21.00.7a | |
| UGC 7878 | NGC 4636 | 1112 | 6.4220.035 | 0.092 | 45.09.0b | 6 |
| UGC 7898 | NGC 4649,M 60 | 1231 | 5.7390.021 | 0.088 | 24.02.0b | 18 |
| UGC 8355 | IC 875 | 3051 | 10.2960.027 | 0.036 | 0.50.1a | |
| UGC 8499 | NGC 5198 | 2778 | 8.8960.023 | 0.077 | 1.50.1a | |
| UGC 8675 | NGC 5273 | 1316 | 8.6650.024 | 0.033 | 1.20.1a | |
| UGC 8745 | NGC 5322 | 2096 | 7.1600.027 | 0.045 | 201b | 14 |
| UGC 9655 | NGC 5813 | 2025 | 7.4130.031 | 0.182 | 2.10.1a | |
| UGC 9692 | NGC 5838 | 1450 | 7.5810.019 | 0.176 | 2.00.1a | |
| UGC 9706 | NGC 5846 | 1896 | 6.9490.026 | 0.182 | 5.30.3a | |
| UGC 9723 | NGC 5866 | 1034 | 6.8730.018 | 0.044 | 7.40.3a | |
| UGC 10656 | NGC 6278 | 2981 | 8.9940.017 | 0.204 | 1.20.1a | |
| UGC 12317 | NGC 7465,MRK 313 | 2046 | 9.5420.021 | 0.260 | 3.70.2a | |
| UGC 12329 | NGC 7468,MRK 314 | 2164 | 11.5750.066 | 0.282 | 1.40.1a | |
| UGC 12759 | NGC 7743 | 1725 | 8.4180.028 | 0.233 | 2.70.1a |
| Name | Alt. Name | V | mK | Gal. AV | Fradio | Fcore |
|---|---|---|---|---|---|---|
| NGC 1316 | Fornax A | 1548 | 5.5870.019 | 0.069 | 65800b | 26 |
| NGC 1380 | E358-G28 | 1621 | 6.8690.022 | 0.058 | 1.7a | |
| NGC 1399 | E358-G45 | 1217 | 6.3060.027 | 0.043 | 342b | 10 |
| NGC 2328 | E309-G16 | 913 | 9.9310.042 | 0.295 | 2.5a | |
| NGC 3258 | E375-G37 | 2598 | 8.3060.024 | 0.279 | 52b | 3.7 |
| NGC 3268 | E375-G45 | 2600 | 8.1530.029 | 0.341 | 22.8a | |
| NGC 3557 | E377-G16 | 2857 | 7.2030.017 | 0.327 | 299b | 10 |
| NGC 3706 | E378-G06 | 2827 | 7.9020.019 | 0.306 | 19b | 7.6 |
| NGC 4373 | E322-G06 | 3221 | 7.6510.022 | 0.265 | 12.7a | |
| NGC 4696 | E322-G91 | 2767 | 7.1420.024 | 0.376 | 1393b | 55 |
| NGC 5128 | Cen A | 390 | 3.9420.016 | 0.381 | 126000b | 6984 |
| NGC 5419 | E384-G39 | 4044 | 7.5180.032 | 0.239 | 390b | 15 |
| NGC 6958 | E341-G15 | 2566 | 8.4000.018 | 0.149 | 18.1a | |
| IC 1459 | E406-G30 | 1498 | 6.8050.025 | 0.053 | 1016b | |
| IC 3370 | E322-G14 | 2773 | 7.8580.021 | 0.309 | 6.4a | |
| IC 4296 | E383-G39 | 3613 | 7.5020.021 | 0.204 | 1604b | 210 |
| IC 4931 | E339-G23 | 5820 | 8.6620.030 | 0.234 | 0.9a |
For our purposes we must study a large sample of nearby objects for which radio observations combining relatively high resolution, high frequency and sensitivity are available, in order to minimize the contribution from radio-emission not related to the galaxy’s nucleus and confusion from background sources.
Two studies in the literature fulfill these requirements. Wrobel & Heeschen (1991) and Sadler et al. (1989) presented 5 GHz VLA radio-images of two samples of nearby early-type galaxies with a resolution between 3 and 5 and a flux limit of 1 mJy. The two samples were selected with a very similar strategy. More specifically, Wrobel (1991) extracted a northern sample of galaxies from the CfA redshift survey (Huchra et al. 1983) satisfying the following criteria: (1) , (2) photometric magnitude B 14; (3) heliocentric velocity 3000 km s-1, and (4) morphological Hubble type T -1, for a total number of 216 galaxies. Sadler et al. (1989) selected a southern sample of E and S0 galaxies brighter than magnitude 14, with , (the Parkes sample). They subsequently selected a subsample of 116 galaxies with the further restriction of to be observable with the VLA. The only substantial difference between the two samples is that Sadler et al. did not impose a distance limit. Nonetheless, the threshold in optical magnitude effectively limits the sample to a recession velocity of 6000 km s-1. Consequently their sample has a median recession velocity larger by a factor of 2 higher than for the Wrobel sample and it contains galaxies which are optically (and radio) brighter by an average factor of 4.
Here we focus on the radio-detected sources of both samples, building a radio-flux limited sample of AGN candidates. Having excluded three galaxies from the Local Group (Leo I and II, Ursa Minor), Wrobel & Heeschen detected 67 galaxies, while 49 were detected by Sadler et al. (1989). In the HST public archive we found images taken with WFPC2, NICMOS or ACS, for a total of 65 objects, 48 and 17 from the Wrobel sample (hereafter Sample I) and from the Sadler et al. sample (hereafter Sample II) respectively. These galaxies form our final sample.
In Tables 1 and 2 we provide the basic data for the selected galaxies namely the recession velocity (corrected for infall of the Local Group towards Virgo from the LEDA database), the K band magnitude from the Two Micron All Sky Survey (2MASS) (available for all but one source), the V band galactic extinction, the total radio- luminosity at 5 GHz, the radio-core flux – when this can be isolated in the VLA maps.
3 HST data and surface brightness profiles
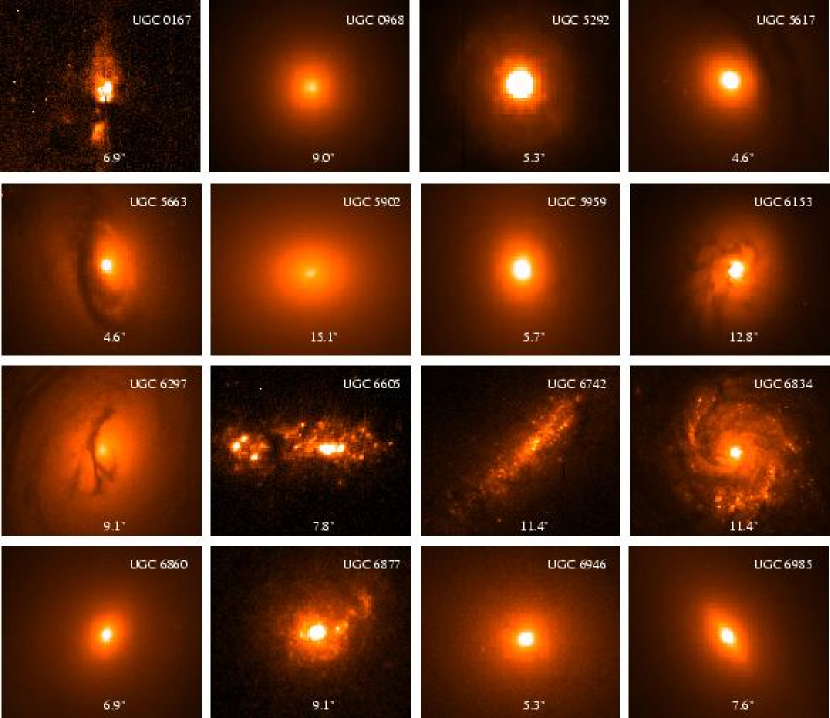
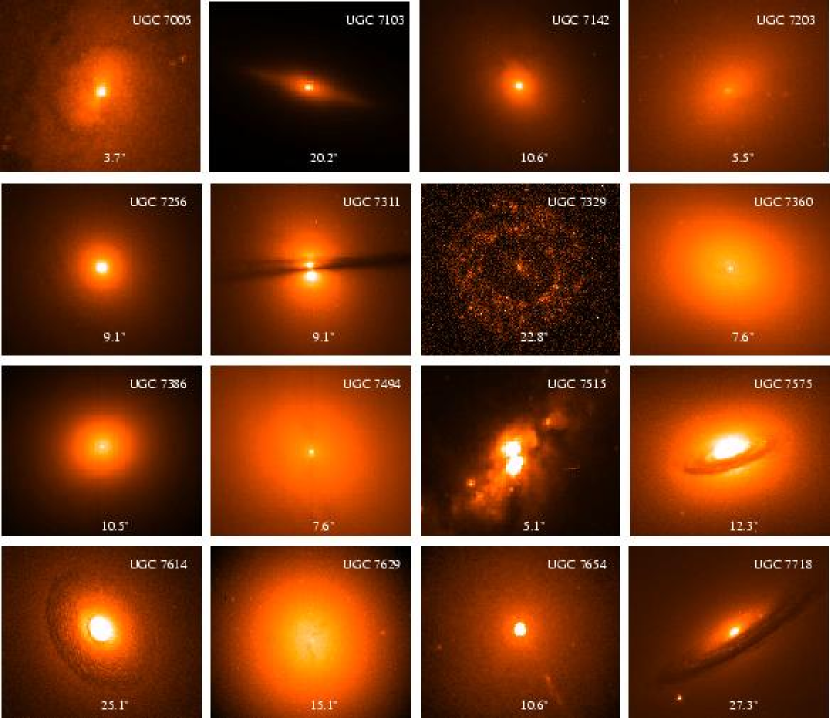
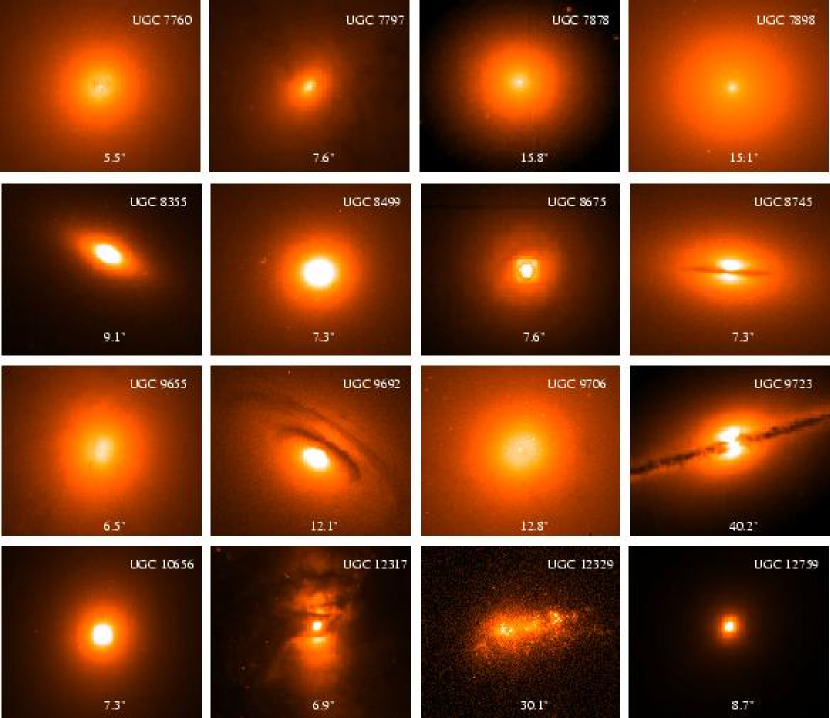
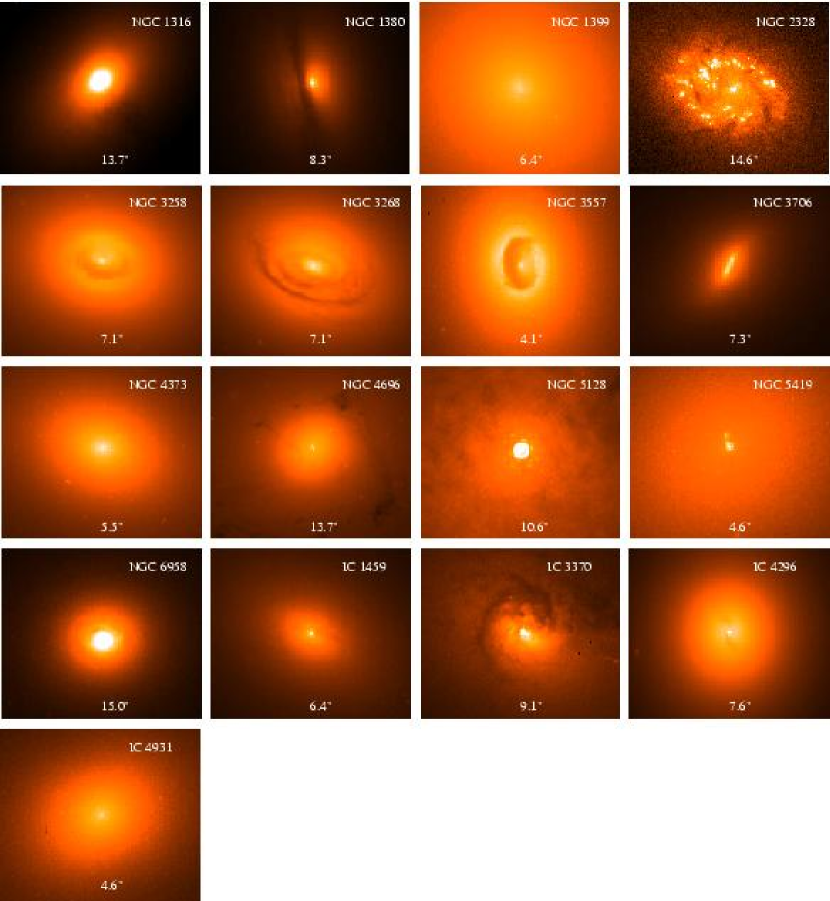
HST images of the selected galaxies were taken with a variety of instruments and filters. When multiple datasets are available for a given object, we give preference to those obtained with ACS or WFPC2 in the F814W or F555W filters to improve the uniformity of the images used. However, when significant dust structures are present in the optical, we used the infrared NICMOS images if present in the archive. All data were retrieved from the public HST archive and were calibrated by the standard On The Fly Re-processing (OTFR) system. In Tables 3 and 4 we give the instrument/filter combination for the images used to study the brightness profile which are presented in Fig. 1 through 4.
Several objects show peculiar morphologies on the HST scale which prevent any attempt to produce a fit to their surface brightness. These include spiral-like objects, objects with a clumpy morphology suggestive of star forming regions, and galaxies with severe dust obscuration. In three cases this is probably due to the fact that the only HST observations available were taken in the ultraviolet with the F300W filter. All galaxies discarded at this stage, 10 + 1 in sample I and II respectively, are marked with a dagger in Tables 3 and 4. It is interesting to note that all 11 complex galaxies have (with the exception of UGC 7329 with ), substantially fainter than the median of the regular galaxies ( ) .
When available we take the parameters describing the Nuker law fit from the literature. This is the case for 21 + 3 objects in the two sub-samples. For the remaining 30 objects we used IRAF task ’ellipse’ to fit elliptical isophotes to the galaxies (Jedrzejewski 1987). These include a few objects for which the classification was based on pre-refurbishment HST data from Byun et al. (1996)111During the preparation of this paper Lauer et al. (2004) published fit to the HST images of additional 7 objects of our sample. The classification in core and power-law coincide with those given in the Tables 3 and 4 with the only exception of NGC 3706: while they conclude that this is a core galaxy, we adopt a more conservative description as a complex profile. .
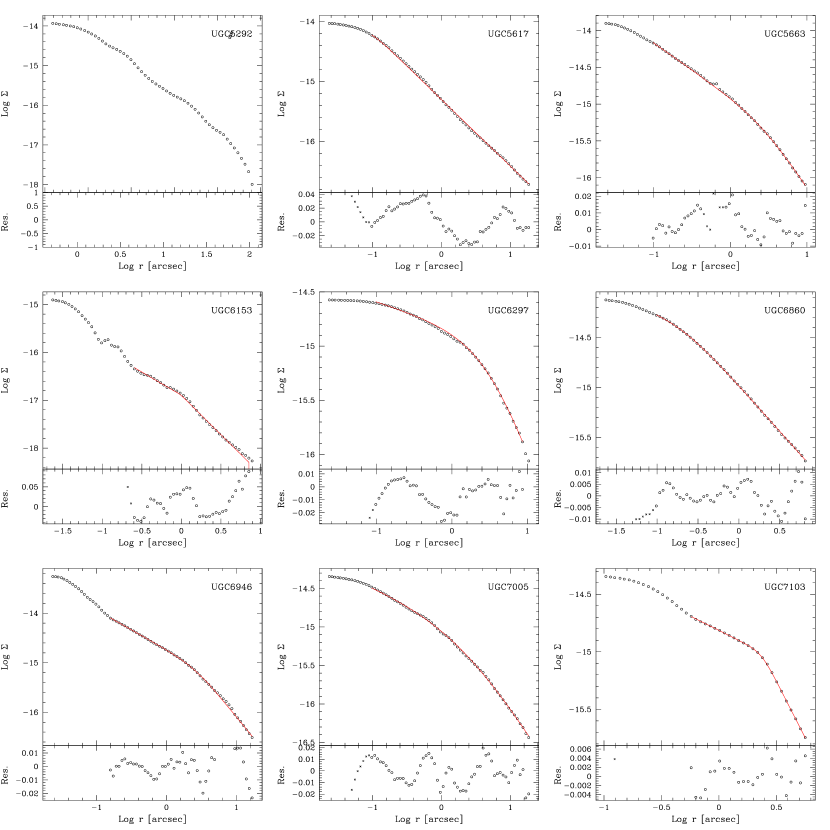
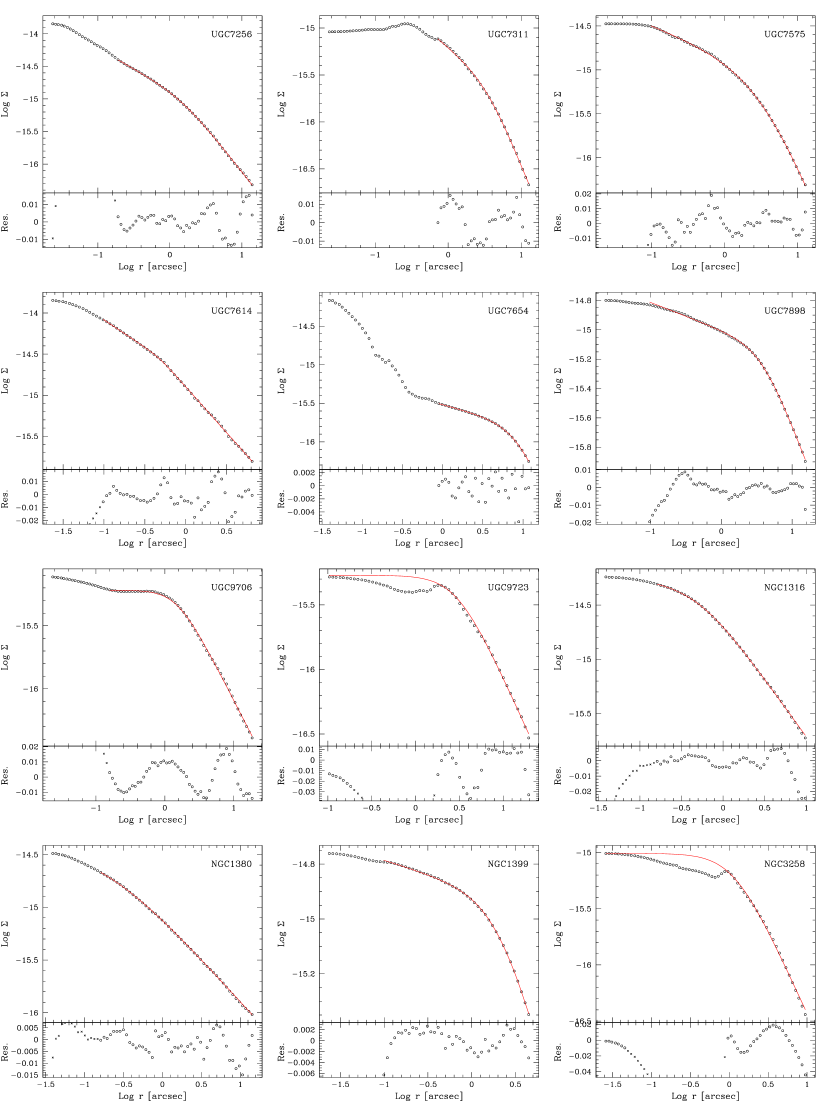
Prominent dust features are often present and they are masked before fitting; in the radial range corresponding to dust structures, we usually preferred to fix the isophotes center, position angle and ellipticity to the values of the last isophote not affected by dust, in order to stabilize the fit. When the dust feature cover a large azimuthal range (e.g. in the case of circumnuclear disks) no masking can be used and the resulting profiles will be necessarily affected. Similarly we masked all background stars or other spurious sources present in the field of view. The background was measured at the edges of images and subtracted. A few objects fill the whole available field of view; in these cases we treated the background level as an extra free parameter in the Nuker fitting. The background level is uncorrelated with all other parameters except for the large scale slope and it can be easily measured and accounted for, particularly in these well exposed images. The resulting one-dimensional major-axis (background subtracted) profiles are presented in Fig. 5 through 7. Errors in the surface brightness are not be displayed as they rarely exceed the 1% level.
On these profiles we performed a fit with a Nuker law in the form
The parameter measures the slope of the outer region of the brightness profile, is the break radius (corresponding to a brightness ) where the profile flattens to a smaller slope measured by the parameter . sets the sharpness of the transition between the inner and outer profile. All models were convolved with the appropriate one dimensional Point Spread Function profile before they are compared to the data.
We minimized the value of the , starting from a first guess eye fit and then exploring the value of over a uniform grid in the 5-dimensional parameter space. The grid was then refined in the region close to the minimum to reach an accuracy on each parameter of 0.01 and finally a downhill simplex minimization algorithm was applied to convergence. As the behaviour at the smaller radii might be affected by the details of the Point Spread Function used for the convolution of the models (such as PSF dependence of chip location, telescope breathing and so on) we preferred to exclude points with from the fit. In several objects the HST images show the presence of a prominent nuclear point source. In these cases we flagged the innermost points of the profile to an extent which depends on the point source intensity, usually the radius where the brightness profile shows the characteristic up-turn.
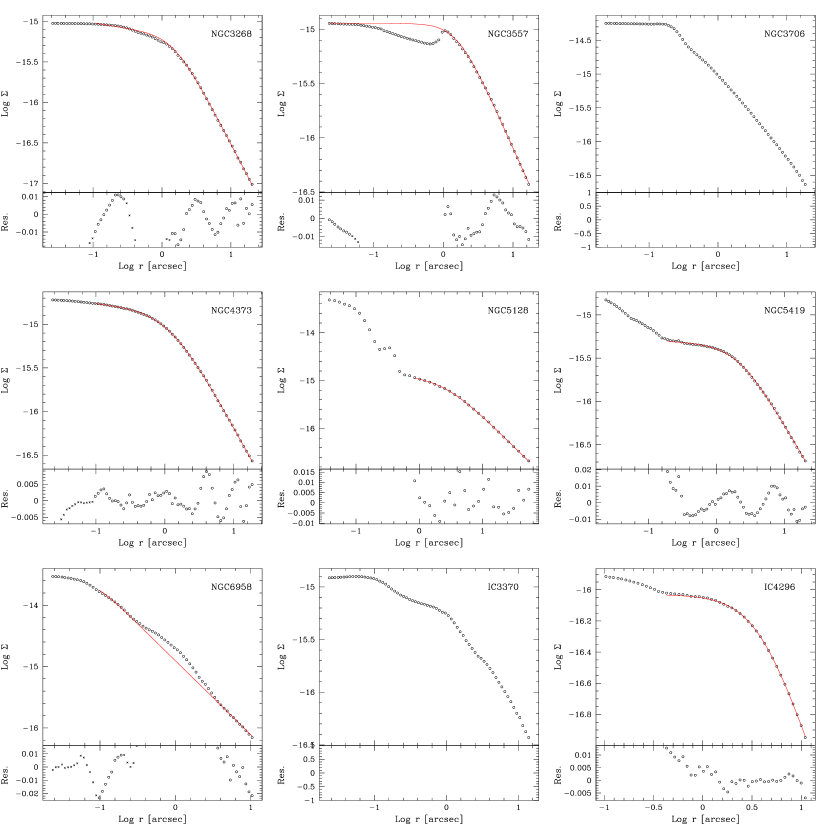
In Fig. 5 through 7 we superposed the best fit with a Nuker law to the actual data in the top panel, while the lower panel presents the residuals. Regions masked in the fitting procedure have their residuals marked with a cross instead of a circle.
Three galaxies show brightness profiles that cannot be reproduced by a Nuker law. These are marked in Tab. 3 and 4 as ’complex profiles’. This leaves us with 51 objects. In some cases, a good fit can only be obtained by flagging a range of radii; in most cases this is due to a depression in the brightness profiles that can be easily associated to dusty regions in the HST images. In other cases, localized region of excess are found over an otherwise well defined Nuker profile. Clearly there is some level of arbitrariness in separating complex profiles from those only slightly disturbed. To reflect this issue we mark with an ’?’ all sources (6) in which we flagged a significant portion of the brightness profile. However, in general, residuals show large scale fluctuations with amplitude of % over the whole profile, with only two exceptions reaching locally values of 5%. This implies that overall a Nuker law reproduces quite well the galaxies profiles.
The parameters derived from the Nuker fits are reported in Tab. 3 and 4. The brightness at the break radius has been converted to the standard Cousin-Johnson system and corrected for Galactic extinction. Break radii are in arcseconds.
Sources are separated into power-law and core galaxies adopting the standard values, i.e. are classified as core-galaxies, while are power-law galaxies. We also considered as power-law galaxies, following the scheme of Lauer et al. (1995), all those objects (6) in which no break in the brightness profile is seen at the HST resolution limit. More specifically, we included in this class the galaxies with , as the region below the break is not sufficiently sampled (when not simply unresolved) to provide an accurate estimate of . Potentially, these objects might be core galaxies located at a sufficiently large distance so that a compact shallow core cannot be resolved. Indeed, there is one core-galaxy in our sample, UGC 7760 (NGC 4552, M 89) with v=392 km s-1, with a well resolved core, corresponding to 13 pc, which would have been misclassified with this scheme if it was located at a larger distance. Thus we prefer in the remaining of the paper to mark this class differently from objects with well established power-law profiles. In the sample there also 3 galaxies (two among those analyzed in this work) with an intermediate value of . See Tab. 5 for a summary of the breakdown of the objects into the different classes.
Since we were forced to use several filters for the analysis of the surface brightness profile, there is the possibility that the description of a given galaxy changes when observed in different bands. However, the comparison of the parameters derived from Nuker fits on the same galaxy imaged with HST in different filters (Ravindranath et al. 2001) indicates that, although differences are present, the classification into power-law and core galaxies is independent on wavelength. Nonetheless, we prefer to explore this issue in more detail for our sample. The images used in this work range from the V to the H band. We here consider the 21 galaxies for which images taken in both these bands are available, to test the robustness of the Nuker classification over the largest breadth of wavelength. Nine objects must be discarded since their V band images are saturated (3), heavily affected by dust (4) or as the presence of a single image in the archive prevents cosmic-ray rejection (2). Of the 12 remaining objects, brightness profiles of 11 galaxies have been already presented in the literature (see the articles cited in Table 3, Lauer et al. (2004) and Faber et al. (1997)), leaving to us only the analysis of the V band image of UGC 7494 (M 84). No discordant Nuker classification has been found, further supporting its independence on the observing band.
| Name | Image | Ref. | Classification | |||||
| UGC 0167 | WFPC2/F300W | Complex | (1) | — | ||||
| UGC 0968 | NICMOS/F160W | 0.68 | 1.69 | 0.03 | 1.41 | 13.73 | (2) | Core |
| UGC 5292 | NICMOS/F160W | Complex profile | (1) | — | ||||
| UGC 5617 | WFPC2/F702W | — | 1.11 | — | 0.20 | 15.17 | (1) | Power-law* |
| UGC 5663 | WFPC2/F702W | 1.87 | 1.59 | 0.73 | 2.69 | 16.48 | (1) | Power-law |
| UGC 5902 | NICMOS/F160W | 1.82 | 1.45 | 0.18 | 1.58 | 12.80 | (2) | Core |
| UGC 5959 | WFPC2/F702W | 1.40 | 1.45 | 0.83 | 1.72 | 16.46 | (3) | Power-law |
| UGC 6153 | NICMOS/F160W | 42.60 | 1.64 | 0.97 | 1.61 | 13.97 | (1) | Power-law? |
| UGC 6297 | WFPC2/F814W | 1.51 | 1.97 | 0.23 | 3.22 | 15.86 | (1) | Core |
| UGC 6605 | WFPC2/F300W | Complex | (1) | — | ||||
| UGC 6742 | WFPC2/F814W | Complex | (1) | — | ||||
| UGC 6834 | WFPC2/F606W | Spiral | (1) | — | ||||
| UGC 6860 | WFPC2/F814W | — | 0.92 | — | 0.20 | 14.57 | (1) | Power-law* |
| UGC 6877 | NICMOS/F160W | Complex | (1) | — | ||||
| UGC 6946 | WFPC2/F547M | 2.94 | 1.75 | 0.80 | 2.61 | 16.76 | (1) | Power-law |
| UGC 6985 | NICMOS/F160W | 0.88 | 1.50 | 0.68 | 0.84 | 12.40 | (2) | Power-law |
| UGC 7005 | WFPC2/F547M | 0.89 | 1.46 | 0.36 | 1.98 | 17.08 | (1) | Interm. |
| UGC 7103 | NICMOS/F160W | 10.50 | 1.97 | 0.50 | 2.35 | 12.90 | (1) | Power-law |
| UGC 7142 | NICMOS/F160W | 1.26 | 2.18 | 0.59 | 3.11 | 14.26 | (2) | Power-law |
| UGC 7203 | WFPC2/F702W | 1.43 | 1.39 | 0.17 | 2.02 | 17.45 | (3) | Core |
| UGC 7256 | WFPC2/F814W | 2.13 | 1.41 | 0.62 | 1.50 | 15.33 | (1) | Power-law |
| UGC 7311 | WFPC2/F702W | 2.49 | 1.95 | 0.64 | 3.43 | 18.11 | (1) | Power-law? |
| UGC 7329 | WFPC2/F300W | Complex | (1) | — | ||||
| UGC 7360 | NICMOS/F160W | 2.38 | 1.43 | 0.00 | 1.62 | 13.58 | (2) | Core |
| UGC 7386 | NICMOS/F160W | 1.63 | 1.39 | 0.02 | 0.97 | 12.80 | (2) | Core |
| UGC 7494 | NICMOS/F160W | 2.15 | 1.50 | 0.13 | 2.39 | 13.35 | (2) | Core |
| UGC 7515 | WFPC2/F606W | Complex | (1) | — | ||||
| UGC 7575 | WFPC2/F814W | 1.25 | 2.13 | 0.33 | 3.45 | 16.22 | (1) | Interm. |
| UGC 7614 | WFPC2/F814W | 6.51 | 1.12 | 0.66 | 0.47 | 13.97 | (1) | Power-law |
| UGC 7629 | NICMOS/F160W | 1.89 | 1.29 | 0.04 | 2.63 | 13.52 | (2) | Core |
| UGC 7654 | NICMOS/F160W | 2.56 | 2.78 | 0.28 | 9.41 | 15.51 | (1) | Core |
| UGC 7718 | WFPC2/F814W | Dusty | (1) | — | ||||
| UGC 7760 | WFPC2/F555W | 3.03 | 1.06 | 0.00 | 0.49 | 15.24 | (4) | Core |
| UGC 7797 | NICMOS/F160W | 1.09 | 1.18 | 0.11 | 0.21 | 12.05 | (2) | Core |
| UGC 7878 | NICMOS/F160W | 1.69 | 1.56 | 0.13 | 3.44 | 14.60 | (2) | Core |
| UGC 7898 | WFPC2/F555W | 2.44 | 1.27 | 0.19 | 3.83 | 16.95 | (1) | Core |
| UGC 8355 | WFPC2/F702W | 0.85 | 1.81 | 1.07 | 1.87 | 17.65 | (3) | Power-law |
| UGC 8499 | WFPC2/F702W | 2.61 | 1.13 | 0.23 | 0.16 | 14.79 | (3) | Power-law* |
| UGC 8675 | NICMOS/F160W | 7.03 | 1.32 | 0.37 | 0.65 | 13.96 | (2) | Interm. |
| UGC 8745 | WFPC2/F814W | 1.11 | 1.45 | 0.00 | 0.68 | 14.59 | (4) | Core |
| UGC 9655 | WFPC2/F702W | 1.90 | 1.33 | 0.00 | 0.73 | 15.77 | (3) | Core |
| UGC 9692 | NICMOS/F160W | 4.35 | 2.57 | 0.93 | 4.35 | 14.84 | (2) | Power-law |
| UGC 9706 | WFPC2/F702W | 2.62 | 1.07 | 0.00 | 1.52 | 17.12 | (1) | Core |
| UGC 9723 | NICMOS/F160W | 2.50 | 1.51 | 0.00 | 2.99 | 13.61 | (1) | Core? |
| UGC 10656 | WFPC2/F702W | 0.76 | 1.62 | 0.55 | 0.60 | 15.69 | (3) | Power-law |
| UGC 12317 | WFPC2/F606W | Complex | (1) | — | ||||
| UGC 12329 | WFPC2/F814W | Complex | (1) | — | ||||
| UGC 12759 | NICMOS/F160W | 5.36 | 1.38 | 0.50 | 0.16 | 11.59 | (2) | Power-law* |
References: (1) this work, (2) Ravindranath et al. 2001, (3) Rest et al. 2001, (4) Carollo et al. 1997
* power-law galaxies with ; ? tentative classification.
| Name | Image | Ref. | Classification | |||||
| NGC 1316 | NICMOS/F160W | 1.88 | 1.06 | 0.13 | 0.52 | 11.54 | (1) | Core |
| NGC 1380 | NICMOS/F160W | — | 0.81 | — | 0.20 | 12.08 | (1) | Power-law* |
| NGC 1399 | WFPC2/F814W | 2.04 | 1.21 | 0.10 | 2.19 | 15.37 | (1) | Core |
| NGC 2328 | WFPC2/F814W | Spiral | (1) | — | ||||
| NGC 3258 | ACS/F814W | 2.10 | 1.51 | 0.00 | 1.15 | 15.59 | (1) | Core? |
| NGC 3268 | ACS/F814W | 2.49 | 1.64 | 0.13 | 1.51 | 15.87 | (1) | Core |
| NGC 3557 | WFPC2/F555W | 2.62 | 1.44 | 0.00 | 1.60 | 16.38 | (1) | Core? |
| NGC 3706 | WFPC2/F555W | Complex profile | (1) | — | ||||
| NGC 4373 | WFPC2/F814W | 1.69 | 1.45 | 0.08 | 1.19 | 15.25 | (1) | Core |
| NGC 4696 | WFPC2/F814W | 6.63 | 0.86 | 0.10 | 1.40 | 16.36 | (5) | Core |
| NGC 5128 | NICMOS/F222M | 1.68 | 1.30 | 0.10 | 2.56 | 11.98 | (1) | Core |
| NGC 5419 | WFPC2/F555W | 2.01 | 1.35 | 0.05 | 2.11 | 17.56 | (1) | Core |
| NGC 6958 | WFPC2/F814W | — | 1.22 | — | 0.20 | 13.63 | (1) | Power-law*? |
| IC 1459 | WFPC2/F814W | 0.81 | 2.04 | 0.02 | 1.82 | 15.15 | (4) | Core |
| IC 3370 | WFPC2/F555W | Complex profile | (1) | — | ||||
| IC 4296 | NICMOS/F160W | 2.14 | 1.90 | 0.00 | 1.44 | 13.89 | (1) | Core |
| IC 4931 | WFPC2/F814W | 2.08 | 1.46 | 0.09 | 0.99 | 15.74 | (5) | Core |
References: (1) this work, (4) Carollo et al. 1997, (5) Laine et al. 2003
* power-law galaxies with ; ? tentative classification.
| Class | # Sample I | # Sample II |
|---|---|---|
| Core galaxies | 16 + 1? | 10 + 2? |
| Power-law galaxies | 10 + 5* + 2? | 1* + 1? |
| Interm. galaxies | 3 | 0 |
| Complex profiles | 1 | 2 |
| Complex morphologies | 10 | 1 |
| Total | 48 | 17 |
? tentative classification; * power-law galaxies with
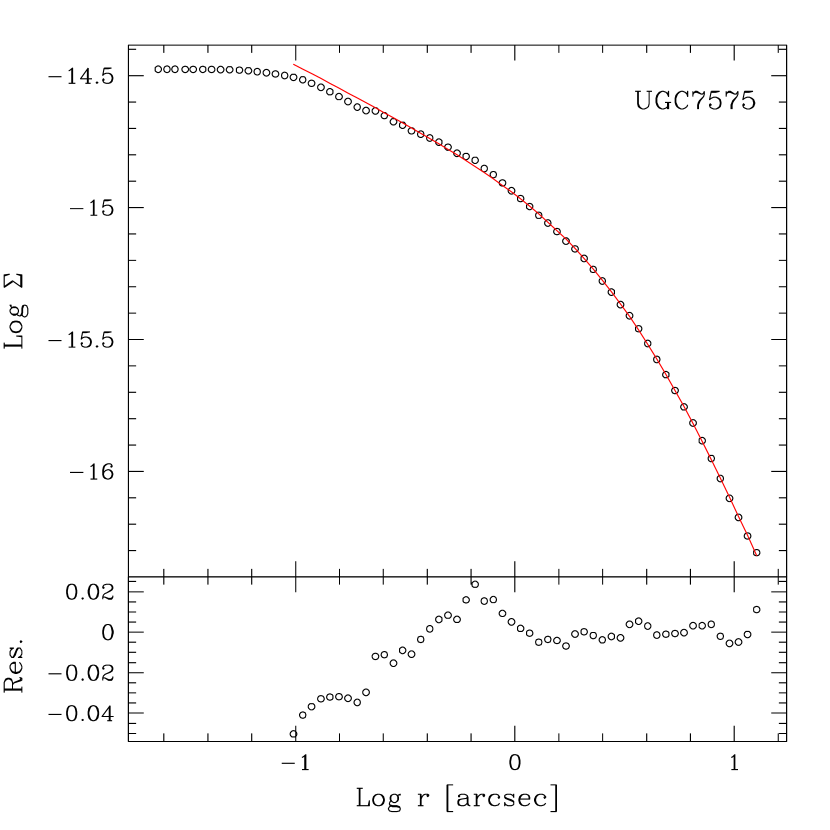
As discussed by several authors, a formal estimate of errors on the resulting Nuker parameters can not be performed (e.g. Byun et al. 1996). Since we are mostly interested in separating galaxies with shallow cusps from those with steep cusps, we explored how the variations of are reflected in the fit and in the residuals. We focus on UGC 7575, one of the two galaxies for which we found an intermediate value of . Its best fit (see Fig.6) shows residuals always smaller than , quite typical for all fitted galaxies. In Fig. 8 we present the Nuker fit obtained forcing to 0.43, a value 0.1 larger with respect to the best fit, leaving all other parameters free to vary. Large and systematic residuals appear toward the center, reaching 5% at 01. Although this does not provide us with a precise error estimate, it indicates that the error on are generally significantly smaller than 0.1, in agreement with the analysis performed by Byun et al. This implies that except for a few border-line objects our classification is robust.
4 Discussion

We are now in the position to explore how the multiwavelength properties of the galaxies of our sample are related to the brightness profiles and how they compare with results obtained on purely optically selected samples. In Fig. 9 we plot the absolute K band magnitude MK derived from 2MASS measurements222We preferred to use the K band luminosities, despite all previous studies have used optical measurements, since the near-infrared light is a better tracer of the stellar mass and less subject to the effects of extinction. Furthermore, 2MASS provides us with a uniform and accurate set of measurements. The conversion to e.g. the V band can be obtained using the average color for E galaxies, V-K = 3.3, see Mannucci et al. (2001). with the asymptotic slope . We recover the already known difference between core and power-law galaxies in terms of absolute magnitude. The most luminous galaxies are exclusively associated to core profiles. Nonetheless, core-galaxies are observed over a broad range of luminosity extending from down to , more than two magnitudes above and below the break in the luminosity function, M=-24.3 (Huang et al. 2003). Leaving aside the objects in which no break in the brightness profile is observed, the brightest power-law galaxy has . Therefore, there is a substantial overlap between the two classes as far as their luminosity is concerned.
The well defined correlation between break radius and surface brightness at the break, which have been described as a fundamental plane for the galaxies cores, is also recovered (see Fig. 10)333We converted surface brightness in the different filters into the V band using the average colors for E/S0 tabulated by Mannucci et al. (2001). The comparison with previous works (see e.g. Fig. 8 in Faber et al. and the compilation provided by De Ruiter et al. 2005) indicate that the vs relationship we obtain is in very good agreement from that seen in the other samples studied, purely optically selected. We conclude that our sample does not reflect any significant difference in the host galaxies with respect to the overall population of early-type galaxies, despite it has been selected imposing a minimum radio-flux level.
The only significant difference is the higher fraction of nucleated galaxies; this fraction varies considerably in previous studies e.g. from 15% in Laine et al. to 40% in Lauer et al. Although we defer the analysis of the nuclear properties to the forthcoming papers, we note that in our sample we detected an optical (or infrared) nucleus in of the objects. This is not at all unexpected, since our sample is deliberately biased to favour the inclusion of active galaxies.


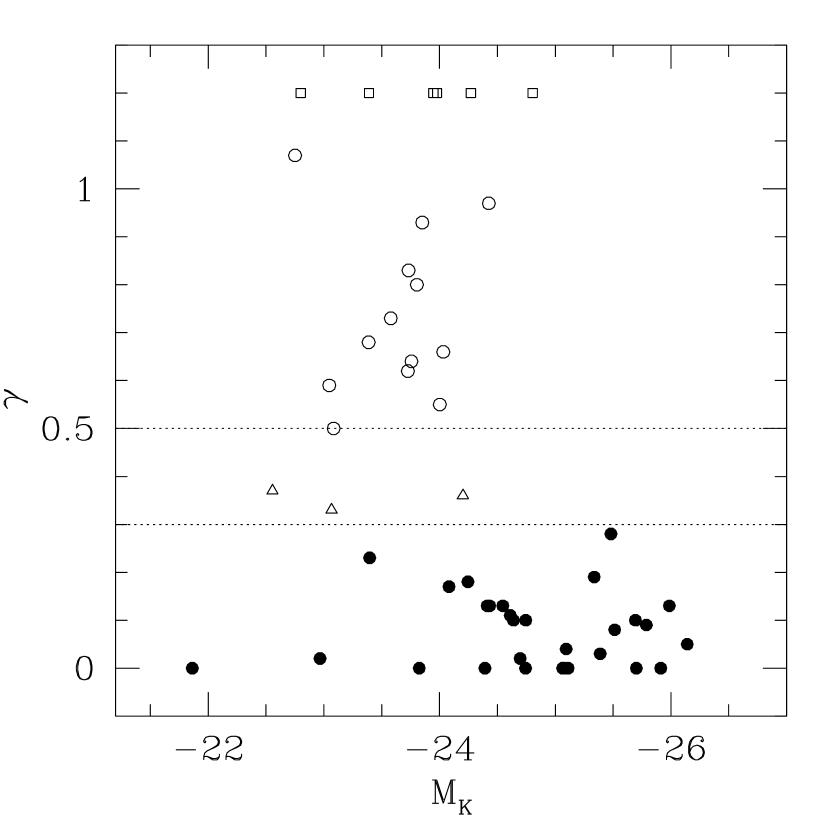
Concerning the relationship between host’s magnitude and radio-power this is visually presented in Fig. 11. Several authors in the past discussed this relationship (e.g. Auriemma et al. 1977) that can be described as a trend for which brighter galaxies have a higher probability to be strong radio-emitters with respect to less luminous galaxies. By separating core and power-law galaxies a clearer picture emerges. Only core-galaxies are radio-emitters at level larger than W Hz-1. This is in line with the result found by De Ruiter et al. (2005); their analysis of the brightness profiles of HST images of radio-galaxies extracted from the B2 sample, as well as from nearby 3C sources, shows that all host galaxies of these relatively powerful radio-sources have a core profile. Fig. 12 provides us with a different view of this same effect, by comparing with . It also shows that, when the two classes are separated, there is no dependence of the radio-luminosity on the value of , e.g. smaller values of in core galaxies are not associated to the brightest radio-sources.
However, below this threshold, the two populations of early-type galaxies cannot be readily differentiated. We are left with the ambiguity on what is the driving mechanism at the origin of this threshold in radio-luminosity for power-law galaxies: it can be due to an intrinsic difference with respect to core galaxies, but it might also be related to the difference in the host galaxy’s luminosity, since no strong radio-source ( W Hz s-1) is associated to a host with , regardless of the profile class.
Considering separately the two classes, the (optically) brightest core galaxies are indeed associated to the strongest radio-sources. However, this effect cannot be simply described as a correlation between Lr and MK since they show a very large spread, covering as much as 3 dex in radio-luminosity at a given magnitude. Furthermore, this trend does not extend to the lowest host magnitudes.
If we now consider the galaxies with intermediate nuclear slope and those in which no break in the brightness profile is seen (marked as triangles and squares respectively in Fig. 11) they are all relatively faint radio-sources, below the threshold for power-law galaxies discussed above. On the other hand, these objects are in the range of relatively low optical luminosity where few radio-bright objects are found.
5 Summary and conclusions
Aim of this series of three papers is to explore the connection between the host galaxies and the AGN activity in nearby early-type galaxies. The new developments in our understanding of the relationship between the supermassive black-holes and galaxies properties as well as in the structure of the central regions of nearby galaxies warrant to re-explore this classical issue in a new framework. In particular, early-type galaxies are the critical class of objects. The two classes defined on the basis of their brightness profiles (core and power-law galaxies) coexist in early-type galaxies and they host both radio-quiet and radio-loud AGN.
A robust classification of the brightness profile can only be obtained for nearby objects since the most compact cores ( pc) are barely resolved even in the HST images already at a distance of 40 Mpc. We then focus on two nearby samples of early-type galaxies well studied at radio-wavelengths in the past and more specifically on 116 galaxies (out a complete sample of 312 objects) that have been detected above the 1 mJy threshold in VLA images at 5 GHz by Wrobel (1991) and Sadler et al. (1989). Imposing a radio-flux limit boosts the fraction of AGN with respect to a purely optically selected sample and, at the same time, provides us with a crucial information (their radio-luminosity) on the nuclear activity of these objects. Due to their proximity and to the low radio-flux limit we will be able to explore the AGN properties in objects with a radio-power as low as W Hz-1 (or , equivalently, to erg s-1).
In this first paper we analyze the archival HST images for this radio-selected sub-sample. They are available for 65 objects. Having discarded 11 objects with a complex morphology, we fit elliptical isophotes and derive the brightness profile for the remaining galaxies. With only 3 exceptions these profiles are well reproduced by a Nuker law fit. We are then able to separate early-type galaxies on the basis of the slope of their nuclear brightness profiles (), into core () and power-law () galaxies; we also found 3 galaxies with an intermediate slope (). We preferred this classification with respect to the traditional morphological scheme (i.e. E and S0 galaxies) since it is well known that it is often difficult to unambiguously distinguish between these two classes of objects (van den Bergh 2004).
We recovered the already known difference in the luminosity between core and power-law galaxies, since the most luminous galaxies are exclusively core galaxies. Below , however, the two classes coexist and core galaxies are associated to objects as faint as . A well defined correlation between the radius and the surface brightness at the profile break, and , the “core fundamental plane”, is present also in our sample and it is indistinguishable from that seen in the other samples, purely optically selected, studied. Thus, our sample does not reflect any significant difference in the host galaxies with respect to the normal galaxies population.
Concerning the relationship between host’s magnitude and radio-power, we found that only core-galaxies are radio-emitters at level larger than W Hz-1, confirming the suggestions by De Ruiter et al. (2005). But below this threshold the two populations of early-type galaxies cannot be readily differentiated. Since no strong radio-source ( W Hz-1) is associated to a host with regardless of the profile class, we are left with the ambiguity on the origin of this threshold in radio-luminosity for power-law galaxies: it can be due both to a different nuclear structure of the two classes or to a difference in the host galaxy’s luminosity, since power-law galaxies only scarcely populate the high end of the optical luminosity distributions, where the brightest radio-sources are found.
The most significant difference concerning the optical properties of our sample with respect to previous studies is the higher fraction of nucleated galaxies, since we detected an optical (or infrared) nucleus in of the objects. This is not at all unexpected, since our sample is deliberately biased to favour the inclusion of active galaxies. Addressing the multiwavelength properties of these nuclei will be the aim of the two forthcoming papers of the series.
Acknowledgements.
This research has made use of the NASA/IPAC Extragalactic Database (NED) (which is operated by the Jet Propulsion Laboratory, California Institute of Technology, under contract with the National Aeronautics and Space Administration), of the NASA/ IPAC Infrared Science Archive (which is operated by the Jet Propulsion Laboratory, California Institute of Technology, under contract with the National Aeronautics and Space Administration) and of the LEDA database.References
- Auriemma et al. (1977) Auriemma, C., Perola, G. C., Ekers, R. D., et al. 1977, A&A, 57, 41
- Byun et al. (1996) Byun, Y.-I., Grillmair, C. J., Faber, S. M., et al. 1996, AJ, 111, 1889
- Dunlop et al. (2003) Dunlop, J. S., McLure, R. J., Kukula, M. J., et al. 2003, MNRAS, 340, 1095
- Faber et al. (1997) Faber, S. M., Tremaine, S., Ajhar, E. A., et al. 1997, AJ, 114, 1771
- Ferrarese & Merritt (2000) Ferrarese, L. & Merritt, D. 2000, ApJ, 539, L9
- Gebhardt et al. (2000) Gebhardt, K., Bender, R., Bower, G., et al. 2000, ApJ, 539, L13
- Gebhardt et al. (1996) Gebhardt, K., Richstone, D., Ajhar, E. A., et al. 1996, AJ, 112, 105
- Heckman et al. (2004) Heckman, T. M., Kauffmann, G., Brinchmann, J., et al. 2004, ApJ, 613, 109
- Huang et al. (2003) Huang, J.-S., Glazebrook, K., Cowie, L. L., & Tinney, C. 2003, ApJ, 584, 203
- Huchra et al. (1983) Huchra, J., Davis, M., Latham, D., & Tonry, J. 1983, ApJS, 52, 89
- Jedrzejewski (1987) Jedrzejewski, R. I. 1987, MNRAS, 226, 747
- Kormendy & Bender (1996) Kormendy, J. & Bender, R. 1996, ApJ, 464, L119+
- Kormendy & Richstone (1995) Kormendy, J. & Richstone, D. 1995, ARA&A, 33, 581
- Laine et al. (2003) Laine, S., van der Marel, R. P., Rossa, J., et al. 2003, AJ, 126, 2717
- Lauer et al. (1995) Lauer, T. R., Ajhar, E. A., Byun, Y.-I., et al. 1995, AJ, 110, 2622
- Lauer et al. (2004) Lauer, T. R., Faber, S. M., Gebhardt, K., et al. 2004, ArXiv Astrophysics e-prints
- Mannucci et al. (2001) Mannucci, F., Basile, F., Poggianti, B. M., et al. 2001, MNRAS, 326, 745
- Marconi & Hunt (2003) Marconi, A. & Hunt, L. K. 2003, ApJ, 589, L21
- Ravindranath et al. (2001) Ravindranath, S., Ho, L. C., Peng, C. Y., Filippenko, A. V., & Sargent, W. L. W. 2001, AJ, 122, 653
- Sadler et al. (1989) Sadler, E. M., Jenkins, C. R., & Kotanyi, C. G. 1989, MNRAS, 240, 591
- Slee et al. (1994) Slee, O. B., Sadler, E. M., Reynolds, J. E., & Ekers, R. D. 1994, MNRAS, 269, 928
- van den Bergh (2004) van den Bergh, S. 2004, ApJ, 601, L37
- Wrobel (1991) Wrobel, J. M. 1991, AJ, 101, 127
- Wrobel & Heeschen (1991) Wrobel, J. M. & Heeschen, D. S. 1991, AJ, 101, 148
Appendix A Notes on the individual sources
UGC 5292: the presence of a bright point source, combined with a complex large scale profile prevents the fitting of this source.
UGC 5663: despite the presence of extended patches of dust, the masking procedure allows us to derive its brightness profile which is well fitted by a Nuker law.
UGC 6153: dust patches cover a large fraction of the nuclear regions of this galaxy and a bright point source is present. Nonetheless, the profile is relatively well behaved and suggests a classification as power-law. The residuals larger than average for the other sources makes it tentative.
UGC 6297: the brightness profile is well reproduced by a Nuker law, despite the presence of dust filaments.
UGC 7311: the large scale edge-on dusty disk covers most of the galaxy for . However, we derived a much larger break radius () and concluded that the classification is robust.
UGC 7614: the presence of an inclined large scale disk induces relatively large fluctuations in the outer profile, but the relatively unperturbed morphology at small radii allows us a robust classification as a power-law galaxy.
UGC 7575: the situation for this object is similar to that of UGC 7614, with a large scale disk but little dust in the innermost 1″, leading to a clear power-law classification.
UGC 9723: in this object an almost exactly edge-on dusty disk is present, but nonetheless the spheroidal component can be accurately traced, after masking down to 2 ″. The break radius derived from the Nuker fit is substantially larger ″, suggesting a tentative core classification.
NGC 1316: despite the presence of extended patches of dust, the brightness profile is remarkably smooth and well fitted by a Nuker law.
NGC 1380: after masking the off-center dust lane, the brightness profile is smooth and well fitted by a power-law. No flattening is seen before the resolution limit.
NGC 3258: a circum-nuclear well defined dusty disk prevents the study of the brightness profile for . The innermost points of the profiles suggest the presence of a flat core. The best fit value is found for , i.e. apparently the profile breaks before the edge of the disk. Forcing the value of to 0.3 requires a strong monotonic increase of dust obscuration toward the center; at the surface brightness should be depressed by a factor 2.5, difficult to reach considering the presence of starlight in front of the disk. These considerations suggest a classification as a likely core galaxy.
NGC 3268: dust filaments cover the region between 025 and 12. Nonetheless the profile is characteristic of a core galaxy.
NGC 3557: the behaviour galaxy is very similar to NGC 3258, see above. Here the break radius is at , while the dusty disk has a radius of . The brightness deficit at the center in this case for would be of a factor 2.2, again suggesting a classification as a likely core galaxy.
NGC 3706: the central region of this galaxy has a peculiar morphology, being extremely elongated. The brightness profile has a steep outer slope, which increases below 04 (approximately the size of the elongated feature) then changing to a flat plateau. We conservatively classify this profile as complex.
NGC 5128: the fit has been performed on a dust-corrected image kindly provided by A. Marconi, obtained combining H and K band HST images of this source. The central 1″ is flagged due to the presence of a strong point source.
NGC 5419: The central 015 are flagged due to the presence of a point source. A fainter second point source (flagged in the fitting) is located close to the nucleus.
NGC 6958: this galaxy shows a well defined power-law decrease with a constant slope , after excluding a rather extended region with a light excess reaching 0.2 dex. No flattening is seen before the resolution limit.
IC 3370: dust patches cover a large fraction of the nuclear regions of this galaxy. The resulting profile is quite complex and no fit has been performed.
IC 4296: the circum-nuclear dusty disk seen in the optical HST images (Laine et al. 2003) affects only marginally the NICMOS image used by us. The central 04 are flagged due to the presence of a point source.