?1
J. Daszyńska-D.
On the nature of small amplitude peaks
in Scuti oscillation spectra
Abstract
The standard assumption in interpretation of stellar oscillation spectra from photometry is that the excited mode have low angular degrees, typically . Considering the case of FG Vir, the Scuti star with the richest known oscillation spectrum, we show that this assumption is not justified for low amplitude peaks. The identifications have been found for 12 dominant peaks from pulsation amplitudes and phases. However, we show that for the rest of the peaks (55), whose amplitudes are typically below 1 mmag, much higher ’s are most likely. We argue that improving amplitude resolution to the micromagnitude level, as expected from space observations, is not likely to be rewarded with a credible mode identifications because the spectra will be dominated by high- modes of unknown azimuthal order, .
keywords:
Stars: Scuti variables – Stars: oscillation – Stars: individual: FG Vir1 Introduction
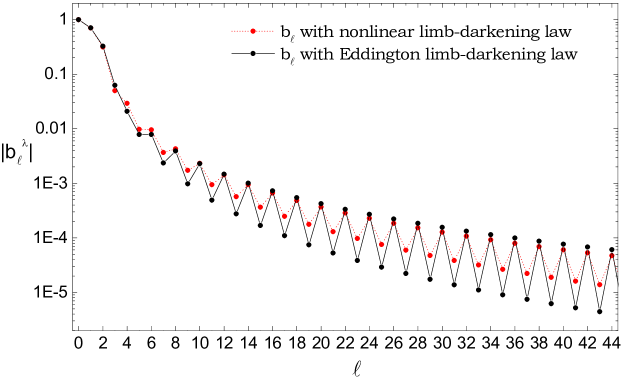
The argument invoked for limiting possible identification to degrees is based on the fact that, at the same intrinsic pulsation amplitude, the disc-averaged amplitude is significantly reduced at higher ’s. The disc-averaging factor, , which involves the limb-darkening law, jumps between and (see Fig. 1). However, the argument is problematical especially in the case of oscillation spectra exhibiting peaks differing drastically in amplitudes. There are many examples of oscillation spectra for opacity driven pulsators where the amplitudes differ by more than two orders of magnitude. This difference corresponds to going from to in the value. In addition, if is sufficiently large so that the geometrical effect dominates then there is the factor in front of in the expression for the light amplitudes.
Possibility of detecting high degree modes from photometry was already discussed by Balona & Dziembowski (1999), who considered various types of pulsators on the upper main sequence as well as stars in the Cepheid instability strip.
In this short report, we focus on FG Vir star, which is the most multimodal Scuti pulsator known so far. According to the recent paper of Breger at al. (2005), there are 67 independent peaks detected in this star covering the fequency range from about 6 up to about 45 c/d. In order to decipher this rich oscillation spectrum, we need at least some idea about the spherical harmonic of the excited mode. We know that high degrees must be involved, because there is just not enough low degree modes in certain overdense ranges of the spectrum. Moreover, not all low degree modes must be excited. Simple nonlinear simulations suggest that pulsational instability is saturated by a random subset of unstable modes, which may include only a part of the low degree modes (Nowakowski 2005).
In the frequency spectrum of FG Vir, twelve modes were detected both in photometry and spectroscopy (radial velocity). For all of them the amplitude and phase data lead to identification (Daszyńska-Daszkiewicz et al. 2005). Unfortunately, for the remaining 55 peaks the data do not allow for a unique determination. Below, we present a speculation what ’s of those modes are most likely.
2 Mode instability and saturation
The range of observed modes in the FG Vir oscillation spectrum extends from about 6 up to about 45 c/d. Model calculations predict p-mode instability extending only up to about 30 c/d and up to . Above these limits, only f-modes with between 70 and 200 are unstable. The instability ranges for p1 and f-modes are shown in Fig. 2. For all calculations, we chose the model with the following parameters: , , and solar chemical composition. The same model was used by Daszńska-Daszkiewicz et al. (2005) in their analysis of the data on the 12 dominant peaks. At low degrees, the mode driving arises mainly in the HeII ionization zone. With increasing the mode degree, the driving source moves toward the upper layers and ultimately at it takes place mostly in the H ionization zone.

What is the upper limit of mode degree at specified photometric amplitude? The answer depends on the intrinsic mode amplitude, , and on the amplitude resolution in the photometric data sets, . In Breger et al. (2005) data it is 0.2 mmag. Unfortunately, we do not have a credible theory predicting intrinsic amplitudes for multimode pulsators. Everything what we have at the moment are preliminary assesments based on simulations made by Nowakowski (2005). His simulations suggest that the main amplitude limiting effect is not a resonant mode coupling but rather a collective saturation of the opacity driving mechanism. If this is a case, then modes in a wide range of degrees are on equal footing. Except that, of course, there are more high modes that low modes. These simulations also show that the terminal state of pulsation is a random realization out of many possibilities.
We had to exclude the f-modes with high ’s from our consideration because at the 0.2 mmag amplitude, the linear model, which we used, fails in the H ionization zone. Note, however, that this problem does not invalidate interpretation of the high frequency peaks in terms of such modes.
3 Visibility of modes with high
For our estimates of observable amplitudes, we first assumed that the intrinsic amplitudes, , of all modes are the same and equal to amplitude of the dominant mode, , which was identified from photometric and spectroscopic data as . The value of this intrinsic amplitude, , was estimated in our recent paper (Daszyńska-Daszkiewicz et al. 2005). The adopted inclination angle was , which is close to the value given by Mantegazza & Poretti (2002). We considered modes with and c/d and all possible azimuthal orders, .
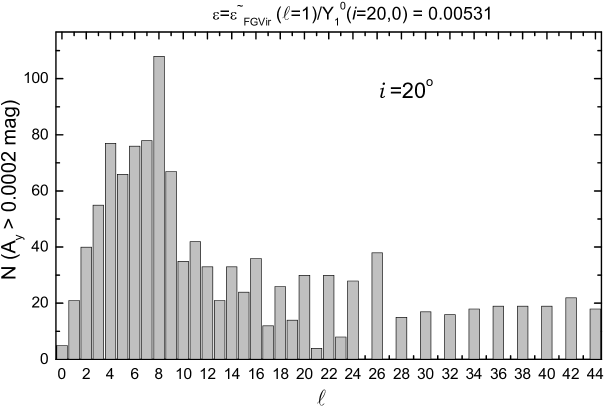
In Fig. 3 we plot the number of modes at a given degree with photometric amplitudes in the Strömgren passband, exceeding 0.2 mmag. This value corresponds to the amplitude resolution in FG Vir oscillation spectrum (Breger et al. 2005). We can see that most modes have harmonic degrees from about to . The rapid decrease of the mode number around results from stabilization of p1 modes. The faster decline for odd modes is a consequence of much smaller factor than for even modes. We presented the results only for one inclination angle, , but the influence of is small, except very near to the pole-on direction ().
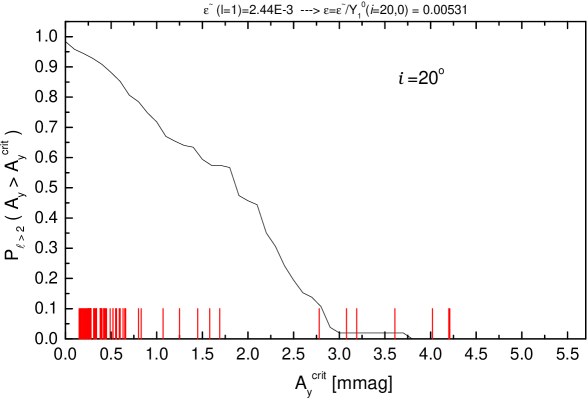
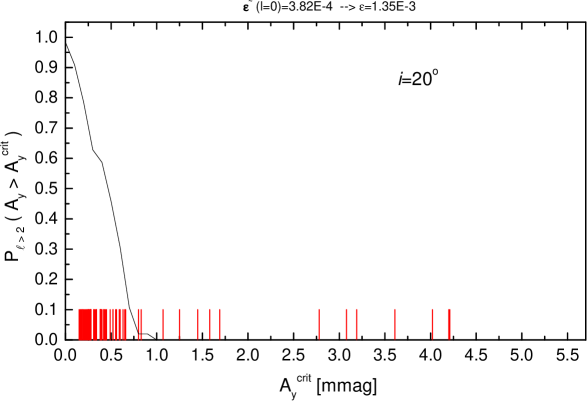
The number of modes can be directly translated into the probability. In Fig. 4 we depict the probability that the observed modes are at different threshold (critical) amplitudes. In the abscissa, we marked also the photometric amplitudes of all modes detected in FG Vir except . We may see that at below the 2 mmag amplitude, the modes most likely have . The fact that four of such modes we identified as may indicate either unlikely coincidence or that that the selection mechanism favours low degree modes. Another option, which we regard more likely, is that the typical intrinsic amplitudes are somewhat lower than we have assumed. Fig. 5 shows the similar results but obtained upon assuming the intrinsic amplitude five times less . This value corresponds to the peak of FG Vir which we identified as . We can see that now the value of decreases much more rapidly, but still most of the peaks have a high probability to be modes.
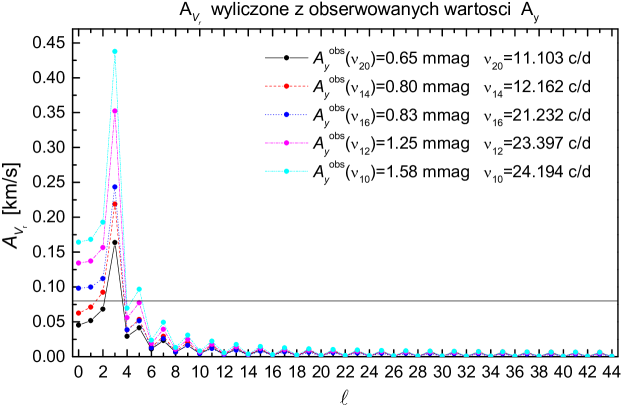
There are many modes in FG Vir oscillation spectrum which are seen in photometry but not in spectroscopy. What should be the amplitude of the radial velocity for such modes? For a few of them, we calculated the radial velocity amplitude at a given observed amplitude in photometry. The result is presented in Fig. 6. We may see that some of such modes should have been detected by spectroscopy if they had . Note also, that mode should be most easily detectable in the radial velocity. If had been equal 3 all the modes should have been detected.
4 Conclusions
We have shown that the oscillation spectrum of FG Vir cannot be explained in terms of low- modes alone. Above frequency of 30 c/d only high degree () f-modes are unstable. Also below 30 c/d most of the observed modes must have . Our simulations, in which we assumed the same intrinsic amplitudes, showed that the most likely degrees are .
The immediate conclusion from our work is pessimistic. Scuti stars seem not a good target for space observations. At the expected micromagnitude threshold, the oscillation spectra will be dominated by high degree modes of unknown azimuthal order, mode identification will be impossible task, thus the frequencies will not be useful for seismic probing. However, we should not forget about our underlying assumption that the intrinsic amplitude are the same for all modes. The assumption may not be justified and we are curious what will the space data tell us. In any case, these data will teach us about the mode selection mechanism in multimode pulsators.
Acknowledgements.
The work was supported by the Polish MNiI grant No. 1 P03D 021 28.References
- (1) Balona, L. A., Dziembowski W. A., 1999, MNRAS 309, 221
- (2) Breger, M., Lenz, P. Antoci, V., et al., 2005, A&A 435, 955
- (3) Daszyńska-Daszkiewicz, J., Dziembowski, W. A., Pamyatnykh, A. A., Breger, M., Zima, W., Houdek, G., 2005, A&A 438, 653
- (4) Mantegazza, L., Poretti, E., 2002, A&A 396, 911
- (5) Nowakowski, R., 2005, PhD Thesis, Copernicus Astronomical Center, Warsaw, Poland