MIPS J142824.0+352619: A Hyperluminous Starburst Galaxy at
Abstract
Using the SHARC-II camera at the Caltech Submillimeter Observatory to obtain 350m images of sources detected with the MIPS instrument on Spitzer, we have discovered a remarkable object at with an apparent Far-Infrared luminosity of . Unlike other sources of comparable luminosity selected from mid-IR surveys, MIPS J142824.0+352619 lacks any trace of AGN activity, and is likely a luminous analog of galaxies selected locally by IRAS, or at high redshift in the submillimeter. This source appears to be lensed by a foreground elliptical galaxy at , although the amplification is likely modest (). We argue that the contribution to the observed optical/Near-IR emission from the foreground galaxy is small, and hence are able to present the rest-frame UV through radio Spectral Energy Distribution of this galaxy. Due to its unusually high luminosity, MIPS J142824.0+352619 presents a unique chance to study a high redshift dusty starburst galaxy in great detail.
Subject headings:
galaxies: evolution – galaxies: formation – galaxies: starburst1. Introduction
The IRAS satellite discovered a population of dusty Ultraluminous Infrared Galaxies (ULIRGS;LL⊙; Soifer et al., 1987; Sanders et al., 1988) in the local Universe that we now know to be significant at high redshift as well. Followup studies of sub-millimeter galaxies (SMGs) found in SCUBA and MAMBO surveys (e.g. Smail et al., 1997; Eales et al., 1999; Scott et al., 2002; Borys et al., 2003; Greve et al., 2004) have shown that ULIRG activity peaks near (Chapman et al., 2005), with a space density about times higher than locally. While these distant galaxies play a central role in the course of galaxy evolution, limited photometry at wavelengths where they emit most strongly restricts detailed characterization of their stellar, nuclear, dust, and evolutionary properties.
This is due in large part to a lack of sensitivity by instruments operating at Mid/Far-IR wavelengths. While IRAS and ISO were able to detect a number of sources, many fall into the Hyper-luminous regime (HLIRGS; LL⊙), of which a notable example is IRAS-F15307+3252 (z=0.93; Cutri et al., 1994). This high luminosity tail is dominated by systems with an active galactic nucleus (AGN) (e.g. Veilleux et al., 1999; Tran et al., 2001), but there may be a selection effect at work here; the fraction of hot dust due to an AGN can be much higher than in starbursting galaxies, meaning that the emission peaks at shorter wavelengths, closer to the IRAS bands. Indeed, followup studies of these systems with SCUBA have shown them to be faint or invisible at long sub-mm wavelengths (Deane & Trentham, 2001; Farrah et al., 2002). In contrast, sources at higher redshift selected in the sub-mm by SCUBA, although harboring an AGN, probably have extreme luminosities driven by intense star-formation (Alexander et al., 2005). Again this may be due to a selection effect, since hot AGN at high redshift will be biased away from the long-wavelength SCUBA channels.
In both cases, the luminosities and dust temperatures are based on assumptions on the shape of the Spectral Energy Distribution (SED), which are drawn from a handful of bright IRAS selected galaxies in the nearby Universe (and hence not necessarily representative of high galaxies). Altogether, we are left with an incomplete picture of luminous dusty sources between , where IRAS and ISO detected sources taper off, and before SCUBA sources peak. The problem is compounded by the fact that many such sources lie in the so-called ‘redshift desert’, which optical spectrometers have difficulty probing.
One goal of the Spitzer Space Telescope (Werner et al., 2004) is to fill in this redshift interval with unbiased samples of luminous IR galaxies. Combining the increased sensitivity afforded by the Multi-band Imager for Spitzer (MIPS; Rieke et al., 2004) with wide area Legacy and GTO imaging surveys, we now have large samples of Far-IR selected galaxies. Ground-based sub-mm observations in the 350/450m windows are a particularly valuable complement, since at , they probe at or near the peak of the SED (typically at rest frame m), allowing tighter constraints on luminosity and dust temperature. To that end, we have initiated a program of 350m sub-mm follow-up of MIPS selected sources using the SHARC-II camera (Dowell et al., 2003) at the Caltech Submillimeter Observatory (CSO). Here we report a striking detection of a starburst dominated HLIRG at .
In the discussion that follows, any calculation requiring cosmology assumes , and H0=71 km s-1 Mpc-1.
2. Field Description and Selection Criteria
Through a Spitzer GTO program (PI: Soifer), 24, 70 and 160m images of the NOAO Deep Wide-Field Survey (NDWFS; Jannuzi & Dey, 1999) Boötes field were obtained using the MIPS camera in February 2004. The 9.3 deg2 survey reached sensitivity levels of roughly 0.1, 7, and 15 mJy at 24, 70, and 160m respectively.
This field boasts an impressive collection of multi-wavelength data: radio imaging for part of the field, including the region around the source presented here, is available from a moderately deep (Jy) and high angular resolution (1.5′′ FWHM) VLA 1.4 GHz observation (Higdon et al., 2005). Another GTO program surveyed the entire field with the IRAC camera, providing deep imaging at 3.6, 4.5, 5.8, and 8.0m (Eisenhardt et al., 2004). Combined with the NDWFS optical data, and our own photometry obtained from the WIRC camera at Palomar for the target discussed here, the wavelength coverage is sufficient to fully characterize the rest frame through band SED up to . The third Spitzer GTO component to the Boötes observations involves IRS spectroscopy of 24m selected sources (PI: Weedman), which included the object presented here.
To select sources for 350m SHARC-II observations, we used a list of MIPS sources that were detected in all three bands and were confirmed to have unambiguous optical counterparts. We further culled the list by selecting only those that appeared compact and red in the optical images (compared to the field). These additional conditions are expected for SMGs at higher redshift (e.g. Borys et al., 2004). For commonly used ULIRG SEDs (i.e. Arp 220 and HR10), varies from at to at . Our goal was to select targets that could be detected at confidence with SHARC-II in under 1 hour of good weather conditions, and hence we used a flux cut of mJy. These conditions imply that any source found should have a luminosity near L⊙. This paper concentrates on the target from this list which has the brightest 160m flux: MIPS J142824.0+352619. Although the NDWFS standard is to use the band to derive the position and name111The NDWFS catalogs, and a description of the naming conventions are available at http://www.noao.edu/noao/noaodeep/index.html, we use the band image which has the highest signal-to-noise ratio of all the available data on this object. For completeness, the J2000 coordinates are: 14h28m2407 +35°26′194.
3. Targeted observations of MIPS J142824.0+352619
3.1. Sub-mm imaging and photometry
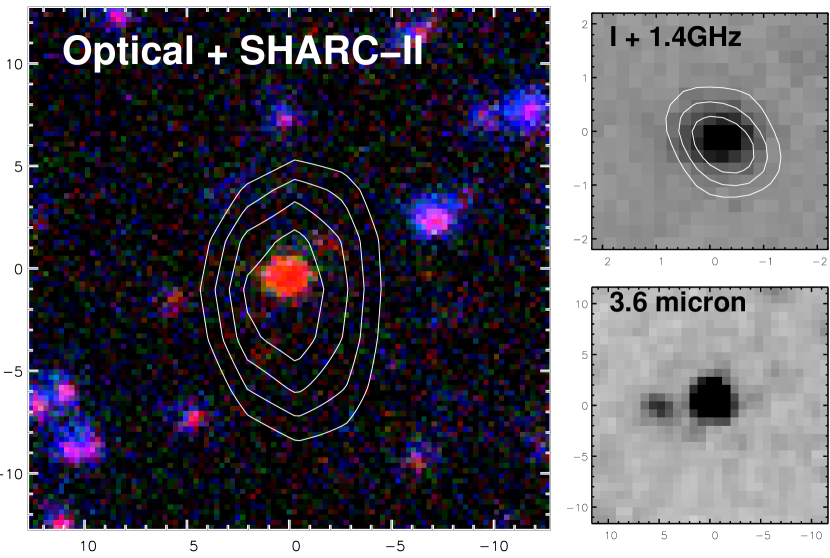
Observations using the SHARC-II camera were carried out at the CSO on UT 2004 June 06. Atmospheric opacity was low, with . Pointing and flux calibration were performed on the nearby source Arp 220, and data reduced using the crush software package (Kovacs, 2005). Instrumental fluxes were measured within 20′′ apertures (corresponding to the width of the SHARC-II beam), and scaled by a factor derived from the same aperture on the calibration images. In Fig. 1, we plot the 350m contours on a false-color optical image.
The SHARC-II detection probes near the peak of the SED, but to constrain its shape further into the Rayleigh-Jeans portion of the spectrum, longer wavelength observations are required. On UT 2004 August 28, one hour of photometry data at both 850 and 450m were obtained in good weather () using SCUBA (Holland et al., 1999) on the James Clerk Maxwell Telescope (JCMT). The data were reduced using surf (Jenness & Lightfoot, 1998) and flux calibrated against CRL 2688. Since the source was observed while setting late in the semester, these data were obtained before and during sunset when calibration uncertainties at 450m (due to the sensitivity of the dish to temperature) render that channel’s data unusable. At 850m, this is not a problem, and the measured flux is accurate to about 5%.
3.2. Spectroscopic observations
Desai et al. (2005) present the Spitzer IRS spectrum for MIPS J142824.0+352619, and determine a redshift of . Despite the many strongly detected PAH features, the relatively low resolution of the spectrometer prevents the determination of a more accurate redshift. With this spectrum as a guide, we used the NIRSPEC instrument on Keck II to search for H. Although the conditions were not photometric (overcast skies and a seeing of ′′), we are able to clearly detect it (Fig. 2) and derive a redshift of by fitting Gaussians jointly to H and the flanking [NII] lines. The H line width is km s-1 (FWHM), but we caution that this may be an overestimate since it may contain contributions from the [NII] lines which were difficult to de-convolve due to the low signal-to-noise of the spectrum.
While the Near- and Mid-IR spectroscopy find an object at , optical observations uncover something else. A spectrum taken with the Keck-DEIMOS instrument on UT 2005 May 06 reveals the presence of a galaxy identified by MgII(2800), the Calcium H and K lines, as well as common blended features (see Fig. 2). These features suggest it is an elliptical galaxy. No line features from the galaxy are seen, although there is generally positive flux near Å where [OII](3727) would be expected. However, the spectrum is much noisier on the redder end, and we cannot say with confidence whether this feature is a real line, or simply a noise excursion. The galaxy is likely lensing the background source, and is a complication we address in §4.1.

4. Determining the SED of MIPS J142824.0+352619
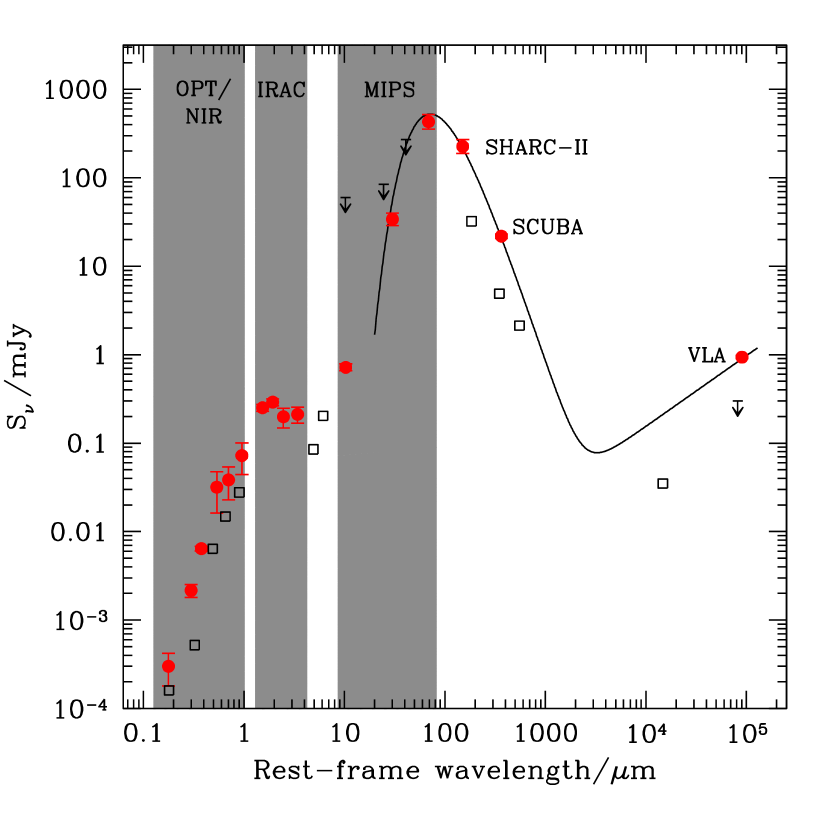
We present a summary of the measured photometry in Table 1 and Fig. 3. Concentrating on the Far-IR portion, we find that the MIPS, SHARC-II, and SCUBA observations are well fit by a modified blackbody of the form , where is the usual Planck function, and describe the redshift, dust temperature and emissivity respectively. The degeneracy (e.g. Blain et al., 2003) reflects the fact that a hot dust source at high redshift has the same SED shape as a colder one at lower redshift. From our multi-wavelength spectroscopy, it is clear that the Far-IR emission is coming from the galaxy, and hence we are able to derive a dust temperature of and emissivity . The Far-IR luminosity, integrated between rest-frame 8 and 1000m is , placing it squarely in the hyperluminous classification. Of course, this could be complicated by lensing, which we now discuss.
| Wavelength | Flux | InstrumentaaMOSAIC-1 is the wide-field optical imager on the Mayall 4m at KPNO, and WIRC is the NIR camera on the Palomar 5m. |
|---|---|---|
| 445 nm | Jy | MOSAIC-1 |
| 658 nm | Jy | MOSAIC-1 |
| 806 nm | Jy | MOSAIC-1 |
| 1.22m | Jy | WIRC |
| 1.63m | Jy | WIRC |
| 2.19m | Jy | WIRC |
| 3.6m | Jy | IRAC |
| 4.5m | Jy | IRAC |
| 5.8m | Jy | IRAC |
| 8.0m | Jy | IRAC |
| 24m | mJy | MIPS |
| 70m | mJy | MIPS |
| 160m | mJy | MIPS |
| 350m | mJy | SHARC-II |
| 850m | mJy | SCUBA |
| 20cm | mJy | VLA |
Note. — Optical fluxes are taken from directly the NDWFS catalog, and are measured in 5′′ apertures. IRAC fluxes are measured using the same sized aperture, and and are corrected to total magnitudes by using the IRAC PSF.
4.1. Lensing of MIPS J142824.0+352619
The radio emission should be a good proxy to the location of the Far-IR emission (e.g. Barger et al., 2000; Chapman et al., 2001; Ivison et al., 2002), and we find that the peak of the radio emission is only 0103 away from the band centroid. Furthermore, Iono et al. (2005) use the SMA to obtain a ′′ resolution image of this source at 890m, and find that it is within 0403 of the optical position. Hence we argue that the alignment between the source and lens is very strong. Adding the VLA/SMA uncertainty in quadrature with the optical astrometric accuracy, we estimate that the observed positional offset between the source and lens is 05.
The foreground elliptical is not the source of the Far-IR emission, but how much does it contribute in the observed optical–Near-IR? MIPS J142824.0+352619 is an extremely red object (ERO), having an color of (Vega). Since the ERO criterion matches the observed colors of ellipticals at , and since the DEIMOS spectrum is consistent with a K+A galaxy, it is possible that the foreground elliptical dominates the observed Near-IR emission. However, bright submm galaxies can exhibit similar colors due to extreme extinction (e.g. Wehner et al., 2002; Frayer et al., 2004; Webb et al., 2004), and hence the lensed source is also a good candidate.
To see if we can place constraints on the relative contributions of the source and lens, we employ a Singular Isothermal Sphere (SIS) to represent the foreground elliptical. In this simple model, the relevant angular scale is roughly twice the Einstein radius (), which is the separation between the two images of the lensed source (in the case where the unlensed separation between the source and lens is ) or between the lens and the single image of the source which results when the unlensed separation is . The ′′ resolution of the radio and SMA images makes it impossible to distinguish between the two lensing scenarios, but we can use the 05 upper limit between the SMA/radio position and the optically detected source as a limit on . This in turn places a limit on the velocity dispersion of the lensing elliptical: the SIS model gives km s-1 and hence we derive km s-1.
Using the Near-IR Faber-Jackson scaling relation (Fig. 11 of Alighieri et al. (2005)), the absolute rest-frame band magnitude for an elliptical with km s-1 is M. In flux units, this corresponds to 33Jy. Since the rest-frame band at corresponds directly to the IRAC 4.5m channel, we see (via Table 1) that the foreground elliptical contributes significantly less in the Near-IR than the background source, by at least a factor of .
This agrees, at least qualitatively, with the observed optical-IRAC SED, which does not show strong evidence of being composed of multiple objects. Using the photometric redshift code developed by the Boötes-IRAC team (Brodwin et al., 2006), we obtain an estimate of , in good agreement with the spectroscopic result for the background object. Note however, that the absorption lines seen in the optical spectrum are rather deep, hence the foreground galaxy is likely dominating the emission shortward of m. This would suggest that the background source is even redder than what is observed.
The faint red source 5′′ east of MIPS J142824.0+352619 (see Fig. 1) could not be a second image of the source under the SIS model since the brighter image (when two are present) is furthest from the lens. However, we note that the three highest signal-to-noise images, , 3.6m, and 4.8m, demonstrate a flux ratio of 9, 10, and 11 respectively between MIPS J142824.0+352619 and this companion. The uncertainty for each ratio is , meaning that it is conceivable that the objects have the same colors (and by inference are the different images of the same lensed source). Deeper imaging and spectroscopy would be required to verify this.
4.1.1 Estimating the lensing amplification
Although the well constrained Far-IR SED provides an accurate apparent luminosity, the value of the lensing amplification, , is needed to derive its true brightness. For an ideal point source, varies from being infinite if the source is directly behind the lens, to at the 05 upper limit to the observed angular separation between source and lens. However, MIPS J142824.0+352619 is not a point source. We can use the Stefan-Boltzmann law to estimate its physical size assuming that the object is a spherical blackbody. In practical units, the diameter of the galaxy using this relation is . This results in a source size of kpc (05), where we have now included the unknown lensing factor explicitly in the luminosity. Downes et al. (1993) used this approach to estimate source sizes on the order of 400 pc for typical IRAS selected ULIRGs. If MIPS J142824.0+352619 is inherently similar, then the lensing must be very strong, with . However, even 400 pc corresponds to an non-negligible fraction of the Einstein radius (400pc = 47 mas at ). This argues against a high lensing factor for MIPS J142824.0+352619.
Furthermore, ULIRG sizes on kpc scales are not uncommon. Chapman et al. (2004) used high resolution radio imaging to show that SCUBA selected galaxies are extended over scales as large as 4 kpc. If MIPS J142824.0+352619 is indeed extended, then the overall lensing amplification is low, since the bulk of the emission would be due to parts of the galaxy that are not significantly lensed. In such a scenario, differential lensing would affect the observed properties of the source. For instance, the stars and dust may dominate in distinct parts of the galaxy, meaning that the overall amplification for each component may be different. However, the Far-IR and radio emission should arise from the same parts of the galaxy, so it is reasonable to assume a common lensing amplification and use those flux estimates to characterize the dust properties of the background source.
5. Discussion
The source of energy powering Far-IR luminous objects is typically attributed to AGN or starburst activity, and in this section we use the available data to determine the relative contributions from both processes to MIPS J142824.0+352619.
Our K dust temperature estimate is comparable to the mean K derived via sub-mm observations of nearby IRAS selected star-forming galaxies (Dunne et al., 2000); the dust temperatures attributed to AGN are much larger (K). Furthermore, Desai et al. (2005) find that the mid-IR spectra is dominated by PAH features, which usually indicate a star-burst power source since they are easily destroyed by the hard radiation field of an AGN (e.g. Lutz et al., 1998). Finally, we find that the ‘q’ parameter (Condon, 1992) which relates the Far-IR and radio luminosity agrees well with values derived for star-forming galaxies in the local Universe : Condon (1992) derives for local galaxies while MIPS J142824.0+352619 has .
If the observed optical/Near-IR flux is indeed dominated by the source, we note that the SED lacks any prominent break near 4000Å. This suggests that the optical spectrum is due to a young (Myr) obscured stellar component, and hence supports the star-formation case. It would also be further evidence against a strong AGN component, as the stellar bump is clearly seen near 1.6m (rest-frame).
Altogether it seems much more likely that the source is powered by vigorous star-formation. These results do not preclude the presence of an AGN in MIPS J142824.0+352619, but only suggest that starburst activity dominates the Far-IR properties of the source. Using our derived Far-IR luminosity and adopting the relation in Kennicutt (1998), we estimate a star formation rate of SFRM⊙yr-1. Note that the empirical luminosity-temperature (L-T) relationship presented in Blain et al. (2003) for sub-mm galaxies shows that the average luminosity for a source of 43K is L⊙. If MIPS J142824.0+352619 obeys this trend, then the inferred lensing amplification is , and the SFR still at least several hundred solar masses per year.
6. Summary
At , MIPS J142824.0+352619 allows us to gain insight on the population of luminous dusty galaxies between . The agreement with the radio/Far-IR correlation and the lack of broad or high excitation spectral lines suggests that MIPS J142824.0+352619 is a starburst-dominated galaxy. Although its observed extreme luminosity is likely enhanced from lensing by a foreground galaxy at , the amplification is likely not higher than . Hence MIPS J142824.0+352619 is a bright ULIRG not dissimilar to those selected by IRAS in the local Universe, or by SCUBA at . As such, MIPS J142824.0+352619 provides a unique opportunity to study in detail the properties of a dusty starburst galaxy at moderate redshift. This object is also interesting since the Near-IR and IRS spectroscopy verify that it lies in the relatively unexplored spectroscopic desert. For future studies, observations of the CO molecular lines would be valuable in determining the gas content in which the stars are forming. More urgently, high spatial resolution optical and Near-IR imaging is essential to understand and correct for the lensing characteristics of this galaxy.
References
- Alexander et al. (2005) Alexander, D. M., Smail, I., Bauer, F. E., Chapman, S. C., Blain, A. W., Brandt, W. N., Ivison, R. J. 2005b, ApJ, accepted
- Alighieri et al. (2005) Alighieri, S. D. S., et al. 2005, A&A, accepted
- Barger et al. (2000) Barger, A. J., Cowie, L. L., & Richards, E. A. 2000, AJ, 119, 2092
- Blain et al. (2003) Blain, A. W., Barnard, V. E., & Chapman, S. C. 2003, MNRAS, 338, 733
- Borys et al. (2003) Borys, C., Chapman, S., Halpern, M., & Scott, D. 2003, MNRAS, 344, 385
- Borys et al. (2004) Borys, C., Scott, D., Chapman, S., Halpern, M., Nandra, K., & Pope, A. 2004, MNRAS, 355, 485
- Brodwin et al. (2006) Brodwin, M. 2006, ApJ, in prep.
- Chapman et al. (2001) Chapman, S. C., Richards, E. A., Lewis, G. F., Wilson, G., & Barger, A. J. 2001, ApJ, 548, L147
- Chapman et al. (2004) Chapman, S. C., Smail, I., Windhorst, R., Muxlow, T., & Ivison, R. J. 2004, ApJ, 611, 732
- Chapman et al. (2005) Chapman, S. C., Blain, A. W., Smail, I., & Ivison, R. J. 2005, ApJ, 622, 772
- Condon (1992) Condon, J. J. 1992, ARA&A, 30, 575
- Cutri et al. (1994) Cutri, R. M., Huchra, J. P., Low, F. J., Brown, R. L., & vanden Bout, P. A. 1994, ApJ, 424, L65
- Deane & Trentham (2001) Deane, J. R., & Trentham, N. 2001, MNRAS, 326, 1467
- Desai et al. (2005) Desai, V., et al., 2005, ApJ, submitted
- Dowell et al. (2003) Dowell C.D., et al., 2003, SPIE, 4855, 73
- Downes et al. (1993) Downes, D., Solomon, P. M., & Radford, S. J. E. 1993, ApJ, 414, L13
- Dunne et al. (2000) Dunne, L., Eales, S., Edmunds, M., Ivison, R., Alexander, P., & Clements, D. L. 2000, MNRAS, 315, 115
- Eales et al. (1999) Eales, S., Lilly, S., Gear, W., Dunne, L., Bond, J. R., Hammer, F., Le Fèvre, O., & Crampton, D. 1999, ApJ, 515, 518
- Eisenhardt et al. (2004) Eisenhardt, P. R., et al. 2004, ApJS, 154, 48
- Farrah et al. (2002) Farrah, D., Serjeant, S., Efstathiou, A., Rowan-Robinson, M., & Verma, A. 2002, MNRAS, 335, 1163
- Frayer et al. (2004) Frayer, D. T., Reddy, N. A., Armus, L., Blain, A. W., Scoville, N. Z., & Smail, I. 2004, AJ, 127, 728
- Greve et al. (2004) Greve, T. R., Ivison, R. J., Bertoldi, F., Stevens, J. A., Dunlop, J. S., Lutz, D., & Carilli, C. L. 2004, MNRAS, 354, 779
- Higdon et al. (2005) Higdon, J. L., et al. 2005, ApJ, 626, 58
- Holland et al. (1999) Holland W., et al., 1999, MNRAS, 303, 659
- Iono et al. (2005) Iono, D., et al., 2005, ApJ, submitted
- Ivison et al. (2002) Ivison, R. J., et al. 2002, MNRAS, 337, 1
- Jannuzi & Dey (1999) Jannuzi, B. T., & Dey, A. 1999, ASP Conf. Ser. 191: Photometric Redshifts and the Detection of High Redshift Galaxies, Edited by Ray Weymann, Lisa Storrie-Lombardi, Marcin Sawicki, and Robert Brunner, 191, 111
- Jenness & Lightfoot (1998) Jenness T. & Lightfoot J. F., 1998, in Albrecht R., Hook R., Bushouse H., eds, ASP Conf. Ser. Vol. 145, Astronomical Data Analysis Software and Systems VII. Astron. Soc. Pac., San Francisco, p. 216
- Kennicutt (1998) Kennicutt, R. C. 1998, ARA&A, 36, 189
- Kovacs (2005) Kovacs, A. 2005, Ph.D. Thesis, Caltech
- Lutz et al. (1998) Lutz, D., Spoon, H. W. W., Rigopoulou, D., Moorwood, A. F. M., & Genzel, R. 1998, ApJ, 505, L103
- Rieke et al. (2004) Rieke, G. H., et al. 2004, ApJS, 154, 25
- Scott et al. (2002) Scott, S. E., et al. 2002, MNRAS, 331, 817
- Sanders et al. (1988) Sanders, D. B., Soifer, B. T., Elias, J. H., Madore, B. F., Matthews, K., Neugebauer, G., & Scoville, N. Z. 1988, ApJ, 325, 74
- Soifer et al. (1987) Soifer, B. T., Sanders, D. B., Madore, B. F., Neugebauer, G., Danielson, G. E., Elias, J. H., Lonsdale, C. J., & Rice, W. L. 1987, ApJ, 320, 238
- Smail et al. (1997) Smail, I., Ivison, R. J., & Blain, A. W. 1997, ApJ, 490, L5
- Tran et al. (2001) Tran, Q. D., et al. 2001, ApJ, 552, 527
- Veilleux et al. (1999) Veilleux, S., Kim, D.-C., & Sanders, D. B. 1999, ApJ, 522, 113
- Webb et al. (2004) Webb, T. M. A., Brodwin, M., Eales, S., & Lilly, S. J. 2004, ApJ, 605, 645
- Wehner et al. (2002) Wehner, E. H., Barger, A. J., & Kneib, J.-P. 2002, ApJ, 577, L83
- Werner et al. (2004) Werner, M. W., et al. 2004, ApJS, 154, 1