The Excitation of Extended Red Emission: New Constraints on its Carrier from HST Observations of NGC 702311affiliation: Based on observations made with the NASA/ESA Hubble Space Telescope, obtained at the Space Telescope Science Institute, which is operated by the Association of Universities for Research in Astronomy, Inc., under NASA contract NAS 5-26555. These observations are associated with program #9471.
Abstract
The carrier of the dust-associated photoluminescence process causing the extended red emission (ERE) in many dusty interstellar environments remains unidentified. Several competing models are more or less able to match the observed broad, unstructured ERE band. We now constrain the character of the ERE carrier further by determining the wavelengths of the radiation that initiates the ERE. Using the imaging capabilities of the Hubble Space Telescope, we have resolved the width of narrow ERE filaments appearing on the surfaces of externally illuminated molecular clouds in the bright reflection nebula NGC 7023 and compared them with the depth of penetration of radiation of known wavelengths into the same cloud surfaces. We identify photons with wavelengths shortward of 118 nm as the source of ERE initiation, not to be confused with ERE excitation, however. There are strong indications from the well-studied ERE in the Red Rectangle nebula and in the high- Galactic cirrus that the photon flux with wavelengths shortward of 118 nm is too small to actually excite the observed ERE, even with 100% quantum efficiency. We conclude, therefore, that ERE excitation results from a two-step process. The first step, involving far-UV photons with E 10.5 eV, leads to the creation of the ERE carrier, most likely through photo-ionization or photo-dissociation of an existing precursor. The second step, involving more abundant near-UV/optical photons, consists of the optical pumping of the previously created carrier, followed by subsequent de-excitation via photoluminescence. The latter process can occur many times for a single particle, depending upon the lifetime of the ERE carrier in its active state. While none of the previously proposed ERE models can match these new constraints, we note that under interstellar conditions most polycyclic aromatic hydrocarbon (PAH) molecules are ionized to the di-cation stage by photons with E 10.5 eV and that the electronic energy level structure of PAH di-cations is consistent with fluorescence in the wavelength band of the ERE. Therefore, PAH di-cations deserve further study as potential carriers of the ERE.
Subject headings:
dust, extinction – ISM: individual (NGC 7023) – ISM: lines and bands – radiation mechanisms: nonthermal – reflection nebulae1. Introduction
1.1. Definitions
Extended Red Emission (ERE) results from a dust-related optical photoluminescence process in the interstellar medium. Such processes are excited through the absorption of higher-energy photons by a suitable carrier, followed by emission of photons at lower energy. If the photoluminescence arises from such a single-step process, we will refer to the energizing process as excitation. In some instances, the carrier itself is the result of an earlier photo-process, e.g. photo-ionization or photo-dissociation, which by itself does not result in luminescence. Since the creation of this carrier is a necessary precondition for later photoluminescence, we will call the enabling process initiation. In this paper, we will investigate whether the ERE is the result of a single-step photo-excitation or the consequence of a two-step process, in which ERE initiation is followed by ERE excitation.
1.2. Background
The ERE was first observed in the peculiar bi-polar Red Rectangle nebula (Cohen et al., 1975; Schmidt et al., 1980). Soon after its initial discovery, ERE was shown to be present in many other dusty interstellar environments, albeit at mostly lower intensities, e.g. in reflection nebulae (Witt et al., 1984; Witt & Boroson, 1990), HII regions (Perrin & Sivan, 1992; Darbon et al., 2000), carbon-rich planetary nebulae (Furton & Witt, 1990, 1992), as well as the diffuse interstellar medium of the Milky Way (Gordon et al., 1998) and other galaxies (Perrin et al., 1995; Pierini et al., 2002). The ERE intensity in many dusty sources is proportional to the local density of the illuminating radiation field. This provides a strong argument in favor of the suggestion that the ERE is a photoluminescence process.
The spectroscopic signature of the ERE is a broad (60 to 100 nm FWHM), unstructured emission band, typically extending from 540 nm to beyond 900 nm in wavelength. The peak wavelength of the ERE band varies from somewhat longward of 600 nm to beyond 800 nm in response to varying environmental conditions, in particular the density of the illuminating ultraviolet (UV) radiation field (Smith & Witt, 2002). This is a defining characteristic of the ERE which distinguishes it from other emission features with essentially invariable emission wavelengths.
At high Galactic latitudes, the intensity of the ERE is comparable to that of the dust-scattered diffuse galactic light (DGL), which has led to an estimated lower limit of the ERE quantum yield of % and the conclusion that the ERE carrier must be a major contributor to the absorption part of interstellar extinction at UV/visible wavelengths in the Milky Way (Gordon et al., 1998). Its ubiquitous presence in radiation environments ranging in density over more than five orders of magnitude testifies to the relative robustness of the ERE carrier. More details about ERE studies done over the past three decades may be found in a recent review by Witt & Vijh (2004).
1.3. Past Studies of ERE Excitation/Initiation
None of the current models for interstellar dust (e.g. Draine, 2004; Zubko et al., 2004) predict ERE, nor do they provide a satisfactory post-facto explanation for the observed characteristics of the ERE. As reviewed by Witt & Vijh (2004), numerous ad-hoc models have been proposed to account for the ERE. Most of them suggest ERE carriers in the form of large molecular structures or nanometer-sized grains, in which electronic excitations by shorter-wavelength photons are followed by efficient electronic radiative transitions across a bandgap of eV. Well-studied examples of such processes are fluorescence and phosphorescence in organic molecules and the photoluminescence in semiconductor nanoparticles. Such particles may be able to meet the constraints posed by the observed spectral characteristics, including their environment-dependent variations, and by the inferred quantum efficiency (Smith & Witt, 2002). However, all carrier models proposed so far suffer from the following dilemma.
The excitation of fluorescence or photoluminescence generally occurs with optimum efficiency at energies just slightly above the bandgap energy. The difference between the optimum excitation energy and the energy at which the luminescence emerges, the so-called Stokes shift, is typically of the order of 1 eV or less in typical photoluminescent agents. At first glance, this does not appear to be the case for the ERE in view of two previous studies of the excitation requirements of the ERE. The first study by Witt & Schild (1985), based upon multi-band surface brightness photometry of several reflection nebulae, concluded that either near-UV photons in the vicinity of the 217.5 nm absorption peak in the extinction curve and/or far-UV photons at wavelengths shortward of 150 nm provided the correct match for the required excitation to result in the observed spatial distribution of the ERE in these objects. These results provided the first indication that ultraviolet rather than optical photons are responsible for ERE initiation/excitation.
The second study related to ERE excitation by Darbon et al. (1999) compiled the records of positive ERE detections as well as the results of negative searches for ERE in a large number of nebulae and related them to the effective temperatures of the exciting stars. While ERE is present in abundance (with few exceptions) among nebulae illuminated by stars with , not a single nebula with stars of exhibits ERE, although dust is present with significant optical depths in the nebulae associated with the latter group of stars. Stars with have spectral energy distributions (SEDs) with a far-UV cutoff near 170 nm, corresponding to an energy of 7.3 eV, while stars with have their corresponding far-UV flux cutoff near 110 nm, corresponding to photon energies of 11.2 eV (Kurucz et al., 1974). The results of Darbon et al. (1999) can thus be interpreted to mean that photons with energies within the range between 7.3 eV and 11.2 eV represent the minimum photon energy required to start the ERE process.
The results of Witt & Schild (1985) are fully consistent with this conclusion. However, the Darbon et al. (1999) results eliminate the 217.5 nm absorption peak of the interstellar extinction curve as a possible source of ERE excitation, because stellar atmospheres still have significant flux at this wavelength, yet they are not found to be able to excite ERE.
The results discussed above suggest a Stokes shift in excess of 6 eV for the ERE process, a highly unlikely condition for single-step photoluminescence excitation. Another, more likely possibility is that the far-UV photons simply initiate the ERE by creating and maintaining the emitter, for example by photo-ionization or -dissociation of a precursor, which could then be capable of photoluminescence upon excitation by abundant lower-energy photons with a more normal Stokes shift.
1.4. Outline of this Paper
To decide among these possibilities, it is essential to determine the wavelength of the ERE initiation as accurately as possible. This must be followed by a comparison of the number density of photons with wavelengths shortward of this limit in a given system with the number density of ERE photons generated within the system. If the latter is greatly in excess of the former, a two-step initiation/excitation process is the most likely explanation. The observations reported in this paper provide a basis for a determination of the critical wavelength of ERE initiation/excitation. We employ the fact that the ERE appears in narrow filamentary structures (e.g. Witt & Malin, 1989) on the surfaces of molecular cloud clumps in reflection nebulae, in particular in the bright reflection nebula NGC 7023. We assume that the physical width of a cloud edge as seen in the light of the ERE is determined by the depth of penetration of the photons giving rise to this particular nebular emission. We will compare these penetration depths with those of photons of known wavelengths giving rise to the appearance of the same cloud edges in the light of photo-excited 1-0 S(1) H2 vibrational fluorescence at 2.12 µm(Lemaire et al., 1996; Field et al., 1998; Takami et al., 2000; An & Sellgren, 2003) and in the light of scattered radiation in the z-band. In NGC 7023, the former is the result of photo-excitation in the Lyman and Werner bands in H2 (Takami et al., 2000; Lemaire et al., 1999), which occurs near 110 nm and shortward in wavelength, while the latter is the result of simple scattering by dust at the effective wavelength of observation near 900 nm. The penetration depths of the respective exciting radiations are inversely proportional to the respective extinction coefficients for the exciting radiations, with local gas/dust densities canceling when ratios are considered. The unknown wavelength region of ERE initiation can then be estimated from the derived ratios of extinction coefficients, taking into account the opacity sources present in the nebular environment.
Section 2 of this paper presents the observations and reductions; in S ection 3 we present the results. The discussion of the implicationsof our results are contained in Section 4. In particular, we apply the wavelength constraint for ERE initiation to two well-studied ERE sources to assess the likelihood of a two-step excitation process for the ERE. This is followed by a set of conclusions in Section 5. An appendix provides details about the method of calculating the UV/optical absorption spectra of a sample of representative PAH di-cations.
2. Observations and Data Reduction
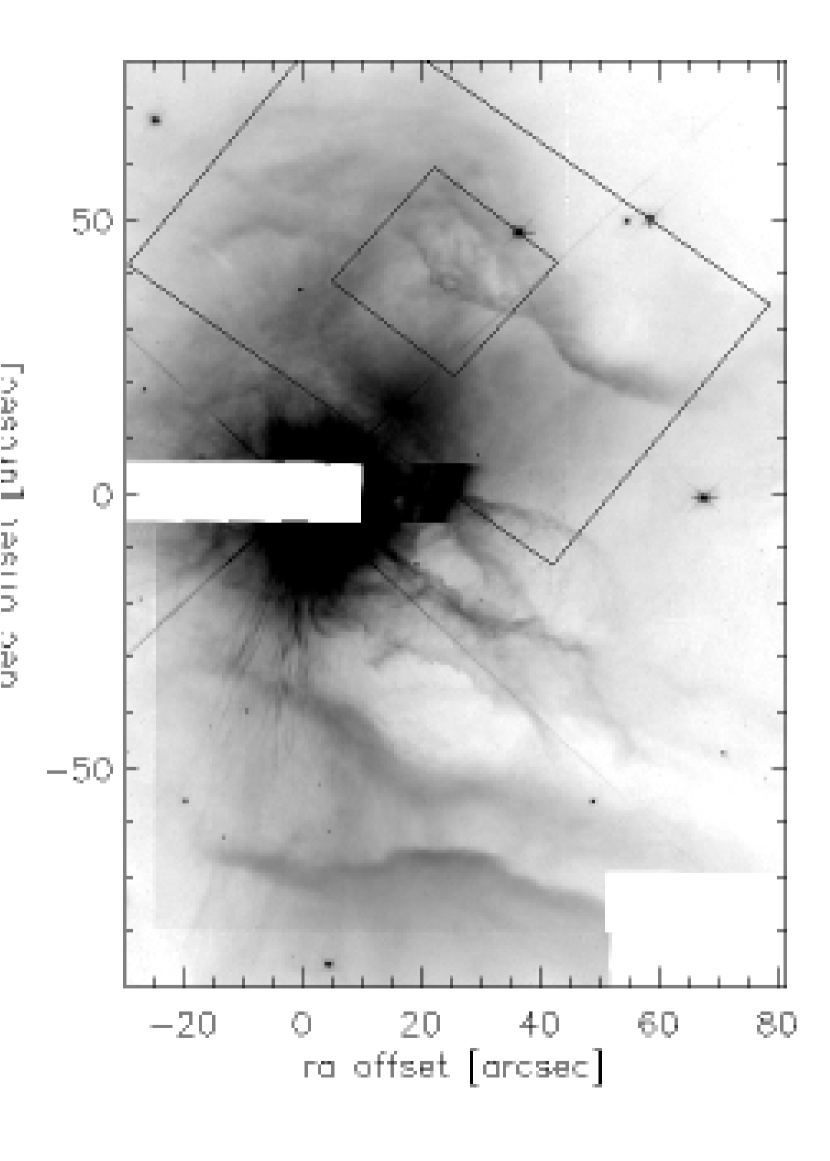
The prominent northwest (NW) filament in NGC 7023 (see Figure 1) was imaged with the Advanced Camera for Surveys (ACS) and the Near Infrared Camera and Multi Object Spectrometer (NICMOS) on the Hubble Space Telescope (HST) as part of HST program #9741. The ACS images were taken in F475W, F625W, F850LP, and F656N which correspond to SDSS g, SDSS r, SDSS z, and H filters. The centers of the ACS images were offset to avoid the bright central star of NGC 7023. The three broad-band ACS images were taken to allow for the creation of a continuum-subtracted ERE image and the narrow band F656N filter to measure the contribution from scattered H emission to this ERE image. The origin of the scattered H radiation is the H emission line in the spectrum of the central illuminating star, HD 200775. The NICMOS images were taken with the NIC2 camera and the F212N and F215N filters which measure the 1-0 S(1) H2 emission line wavelength range and associated red continuum at 2.121 and 2.15 respectively.
The observations in each ACS filter were taken split between two images with a large enough dither to fill in the gap between the two chips. The total exposure times were 1000, 1000, 1200, and 1560 s for the F475W, F625W, F850LP, and F658N filters, respectively. The two images per filter were combined with the online multidrizzle and additionally processed using LACOSMIC (van Dokkum, 2001) to identify cosmic rays which were not removed with multidrizzle. Residual cosmic rays are present in the final mosaics, especially in the gap between the two ACS chips where we only have a single measurement. These residual cosmic rays do not affect our measurements as they rely on structures much larger than a cosmic ray.
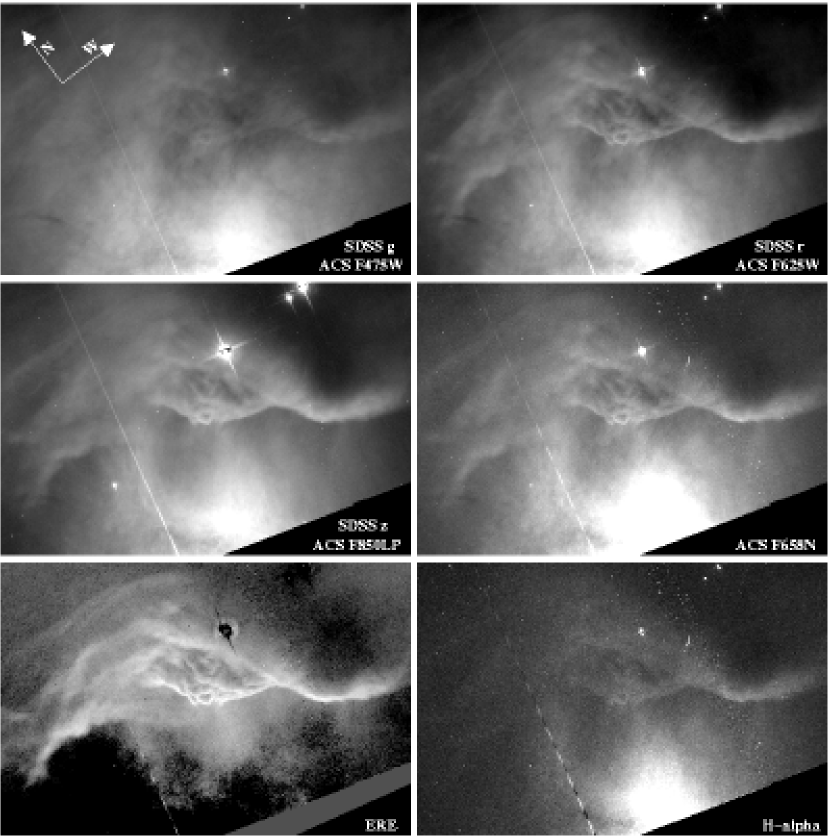
A region extracted from the ACS images focusing on the NW filament is shown in Fig. 2 for all four observed filters and the continuum-subtracted ERE and H images. The ERE image was created by first creating a continuum image due to dust scattered light using a linear combination of the F475W and F850LP images. These two filters have central wavelengths (474 nm and 905 nm, respectively) to the blue and red of the ERE peak seen in this filament which is at 650 nm (Gordon et al., 2000). The resulting continuum image was subtracted from the observed F625W image to produce the ERE image. The success of the continuum subtraction can be seen by the much reduced strength of the clump southwest of the filament (brightest extended source in all four observed ACS bands). This clump is composed of only scattered light as it has a linearly decreasing spectrum arcross the three broad ACS bands as measured in a 30x30 pixel box centered on the clump. The H image was created by subtracting the F625W image from the F658N image after scaling the F625W image by the ratio of fluxes of stars measured in both images.
The prominence of ERE in this filament is clearly seen as the F625W image is much sharper than the F475W and F850LP images. If the F625W image were dominated by scattered light and not ERE, it would have an intermediate appearance between the F475W and F850LP. One possible reason for this sharper appearance could be H emission. This is not the case as the sharpness of the continuum-subtracted H image more closely matches the F425W and F850LP images than the F625W or ERE images. Note that the H image has the same morphology as the scattered-light dominated F425W and F850LP images. This is because the central star of NGC 7023, HD 200775, has a strong H emission line (Gordon et al., 2000). Thus, the continuum-subtracted H image traces the scattered H light of the central star, not H emission from extended gas in the nebula.
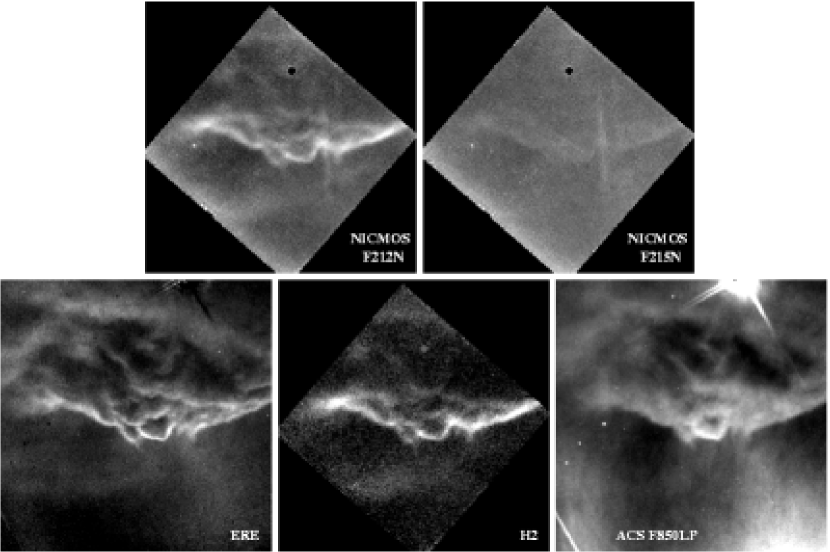
The observations in the two NICMOS filters were taken split between 4 images with a spiral dither pattern. The total exposure times were 352 s in both the F212N and F215N filters. The 4 separate images were combined using custom scripts to allow for careful masking of bad pixels and the coronographic spot. A single star was present in each image allowing for accurate registration between images and to the ACS observations. The mosaics of the F212N and F215N observations are shown in the top row of Fig. 3 displayed with the same scale. It is clear from these two images that this filament has very strong H2 emission which was known from existing near-infrared spectroscopy (Gordon et al., 2000). The H2 image was created by subtracting the calibrated F215N image from the calibrated F212N image. The accuracy of the subtraction of the continuum can be easily seen as the stellar image disappears completely as well as the diffraction spikes from the central star of NGC 7023. In addition to the NICMOS images, the continuum-subtracted ERE and ACS F850LP images are shown for the same region in Fig. 3.
3. Results
3.1. The ERE, H2, and z-Band Morphology of NW Filaments
We examined the filamentary morphology of the NW photon-dominated region (PDR) in NGC 7023 on two spatial scales. The first scale is defined by the more limited field of view of NICMOS and focuses on the complex, multi-filament structure in the center part of the NW PDR in NGC 7023 shown in Figure 3. Our observations of the 1-0 S(1) emission from molecular hydrogen are limited to this field of view, and we are presenting this image together with the ERE and z-band images limited to this field. The wider field of view of the ACS defines the second scale shown in Figure 2; it includes the southern and northern extensions of the filaments in Figure 3, for which we can compare the ERE structure only with the corresponding structure in the z-band. The data shown in Figures 2 and 3 represent the highest-resolution images of the NGC 7023 NW PDR to date. The location of these images within the larger extent of NGC 7023 is indicated in Figure 1.
The structure of the NW PDR shown in the more limited field of NICMOS (Figure 3) is highly complex and consists of a series of narrow filaments with typical widths of 1 arcsec when viewed in the light of ERE and the light of H2. These filaments are fully resolved in both images. The angular resolution is marginally higher in the ACS images compared to the NICMOS images. This is based on comparisons of stellar images which yielded ratios FWHM(ACS)/FWHM(NICMOS) = 0.93, with stellar images having diameters with FWHM of 0.1025 and 0.1102 arc seconds, respectively. When viewed in the z-band, which is dominated by dust-scattered light, the same structures appear much more diffuse, although they were imaged with the same angular resolution. This comparison suggests that the sharpness of the structures as seen in ERE and H2 is not a result of a limited physical extent of the structures, e.g. thin sheets viewed edge-on, but that they have a physical width that is wider than indicated by the ERE and H2 filament images. The narrow ERE and H2 filaments, therefore, may represent just the edges of more extended molecular cloud clumps illuminated by the central B3Ve star in NGC 7023, HD 200775.
There is independent evidence from the interferometric HCO+ observations by Fuente et al. (1996) for the existence of at least two but possibly four high-density molecular clumps in our field of view that can be distinguished on the basis of their differing radial velocities. In particular, the extended filament that begins on the right-hand side of Figure 2 and turns upward, passing near the embedded star (star K in the map of An & Sellgren, 2003), appears to be a coherent structure moving at 2.4 km s-1, while the group of narrow filaments shown in Figure 3 closest to the illuminating source belongs mostly to a structure moving at 4.0 km s-1. The apparent complexity of the filamentary structure of the NW PDR is most likely the result of the line-of-sight superposition of several independently moving molecular clouds, whose surfaces facing HD 200775 are currently being photo-dissociated.
A comparison of the morphology of the H2 and ERE filaments in Figure 3 reveals two significant facts. One, the ERE filaments appear to be about as sharp as the corresponding H2 filaments. We will investigate this aspect further in Section 3.3; for now we can conclude that the radiation initiating the H2 fluorescence and the ERE, respectively, apparently faces similar optical depths per unit mass of molecular cloud environment. Two, the spatial correlation between the distribution of the ERE and the H2 emission in Figure 3 is not exceptionally strong. ERE is present wherever H2 emission is seen, but there are bright ERE filaments, especially in the upper part of Figure 3, for which the corresponding H2 features are either much weaker in intensity or absent altogether. A similar qualitative relationship between ERE and H2 emission has previously been noted by Field et al. (1994) in a study of the reflection nebula NGC 2023 and was confirmed in a more detailed study of NGC 7023 by Lemaire et al. (1996).
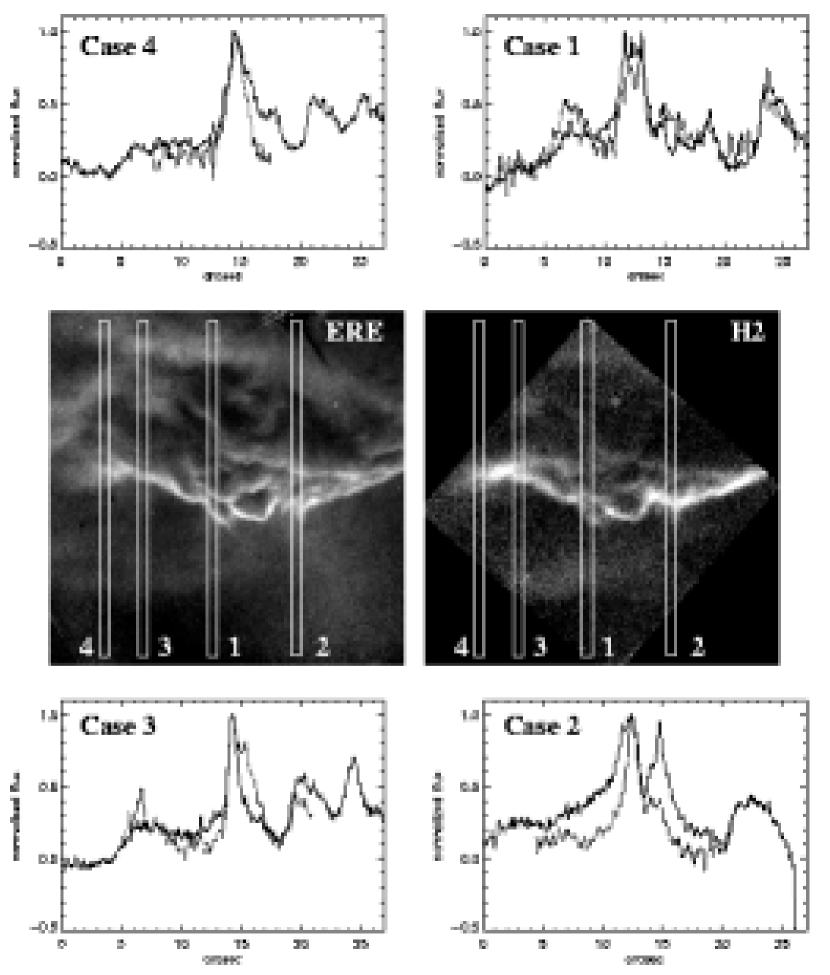
When comparing the detailed profile shapes and positions of ERE and H2 filaments, we can identify four classes, illustrated in Figure 4. These can be described as follows. Case 1 represents locations where ERE and H2 exhibit nearly identical structures, agreeing both in width and relative surface brightness. Out of 36 cuts examined, seven fall into this category. Class 2 includes cases (17/36) where the first H2 filament is very narrow and recessed with respect to the corresponding ERE filament. A second ERE filament is not matched by H2 in terms of its surface brightness. We believe these to be instances of H2-self-shielding. Case 3 represents instances (9/36) where the H2 filament is broader than the corresponding ERE filament, while Case 4 illustrates the rather rare (3/36) circumstance where the H2 filament is narrower than the ERE filament and peaks slightly in front of the ERE filament.
The near-absence of H2 emission (Case 2) in regions exhibiting bright ERE cannot be explained by differences in line-of-sight extinction. We just concluded that both types of emission appear to be initiated by photons of similar energy; the resulting outgoing 1-0 S(1) H2 emission faces an opacity only 1/8 as large as the resulting ERE, the former occurring in the near-IR. Hence, if one type of emission should be missing due to extinction, it would be the ERE, not the H2 emission, contrary to our observations. As noted by Field et al. (1994) and Lemaire et al. (1996), this result provides a strong argument against models, in which the ERE carrier is initiated chemically by hydrogenation of carbonaceous dust in the hot atomic hydrogen gas found in H2 photo-dissociation fronts (Witt & Schild, 1988; Duley & Williams, 1990). Lack of carriers also cannot be the explanation for the absence of H2 luminescence; H2 molecules are the principal constituents of molecular clouds in the ISM. If H2 luminescence is weak or absent in a dense molecular cloud, H2 molecules are not sufficiently excited. As a result, H2 remains molecular and the hot HI atoms required for hydrogenation of carbonaceous dust are not available. If ERE is observed to be bright in such regions, its origin must be in processes other than hydrogenation.

We notice that ERE filaments in the NW PDR that lack H2 counterparts of corresponding surface brightness tend to be broader than those that have bright H2 counterparts. If this broader, more diffuse appearance is a reflection of the penetration depth of the radiation initiating the ERE, this then indicates that the density in the ERE filaments lacking H2 counterparts is substantially lower. Under these conditions, the UV pumping efficiency as measured by the number of 1-0 S(1) photons emitted per incident photon in the wavelength range 110.8-91.2 nm is significantly reduced (Draine & Bertoldi, 1996), because dust is absorbing an increasing fraction of the photons needed for the excitation of H2. This is because molecular hydrogen is unable to be re-formed on the surfaces of dust grains as quickly under lower-density conditions, the rate being proportional to the product of the dust density and the density of atomic hydrogen. As we had seen earlier, the ERE carrier is part of the dust and a likely competitor for photons in the far-UV range. Thus, with competition lacking from molecular hydrogen, the ERE carrier is able to absorb a greater fraction of the available photons under lower-density conditions. We illustrate the dependence of the dust optical depth of a PDR and the efficiency of converting absorbed far-UV photons into near-IR photons in the 1-0 S(1) H2 transition in Figure 5, calculated from relations provided by Draine & Bertoldi (1996). The dust optical depth of the PDR is measured from the front of the molecular cloud to the point at which 50% of the H2 is photo-dissociated.
It appears likely, therefore, that the lack of a detailed spatial correlation between ERE filaments and the 1-0 S(1) emission of H2 is a result of density variations by about one order of magnitude between high-density filaments, where both ERE and H2 are bright, and lower density cloud faces, where the ERE is dominant.
3.2. Determination of RV in NW Filaments
When viewing the filaments in the light of different emission mechanisms, e.g. the fluorescent 1-0 S(1) vibrational emission of H2 at 2.12 µm and the much more diffuse appearance of the same structures in the light of dust-scattered light in the z-band (Figure 3), we are comparing the relative penetration into the cloud surfaces of the respective exciting radiations. In the case of the fluorescent H2 emission, the exciting radiation is Lyman and Werner band photons absorbed by H2 molecules at wavelengths nm. The opacity restricting the transfer of such photons into the cloud faces is most certainly extinction by dust and, depending on local density conditions, self-shielding by H2 (Draine & Bertoldi, 1996). In the z-band, dust extinction is the only significant opacity source. The relative penetration depth along a given line-of-sight from the central star into a molecular cloud is determined by the inverse ratio of these two opacities. Taking into account the possible contribution by H2 self-shielding to the opacity, the ratio of the widths of the H2 and the z filaments at identical locations, then, is an upper limit to the ratio of the dust opacities at the two effective wavelengths involved, 110.8 nm and 900 nm, respectively. This ratio can now be used to identify the appropriate dust extinction curve for the molecular cloud fronts in the NGC 7023 NW PDR.


Cardelli et al. (1989, hereafter CCM) showed that the wide range of extinction curves encountered in different galactic environments can be reproduced as a family of functions dependent upon a single parameter, the ratio of total-to-selective extinction, RV, as illustrated in Figure 6. The low-density diffuse ISM in the Milky Way is most commonly represented by CCM curves with R while dense molecular cloud material exhibits CCM extinction curves with RV in the range from 5 to 6. As long as we adopt the CCM formalism, these curves can be distinguished from each other by measuring a single ratio of extinctions at two widely separated wavelengths. As we noted before, such extinction ratios can be estimated from the relative penetration depth at the respective wavelengths. We measured the FWHM of the H2 and z-band filaments (Figure 3) at 22 positions where such measurements could be carried out without interference from blends by closely spaced H2 filaments, whose z-counterparts would merge into a single profile. A histogram of the measurements of the ratio of FWHM(z)/FWHM(H2) is shown in Figure 7 by a dotted line. The average of the measured ratios of FWHM(z)/FWHW(H2) is . In Figure 8 we show the ratio of the dust extinction cross sections at 110.8 nm and 900 nm, the latter being the effective wavelength of the z-band, as a function of RV for CCM extinction curves, and we have entered our measured ratio as a horizontal bar. We conclude from this figure that a CCM extinction curve with R is a good estimate for the dust extinction curve in the molecular clouds making up the NW PDR in NGC 7023. If H2 self-shielding is a significant contributor to the total extinction for the H2-exciting radiation, this value of RV is a lower limit. The fact that R is very typical of dust in molecular cloud environments (R) suggests, however, that H2 self-shielding is a minor contributor to the opacity for the H2-exciting radiation in the filaments measured in this experiment.
3.3. Width of the ERE Filaments
Employing the same rationale as in the previous section, we now compared the relative widths of the ERE and z filaments in Figures 2 and 3 in identical locations. A total of 41 measurements were made in the larger field (Figure 2) and 26 such measurements were made in the smaller field (Figure 3). A histogram of the resulting ratios FWHM(z)/FWHM(ERE) is shown in Figure 7 (solid line). The two sets of measurements resulted in average ratios of FWHM(z)/FWHM(ERE) of and , respectively, with a weighted average of . Comparing this value to the corresponding ratio of FWHM(z)/FWHM(H2) , we conclude that on average the ERE filaments are about 10% broader than the corresponding H2 filaments, if they are present, and that the opacity facing the radiation that initiates the ERE is on average, therefore, about 10 % less than the opacity encountered by the radiation that excites the H2 1-0 S(1) radiation.

3.4. Wavelength of ERE Initiation
In order to identify the wavelengths of the radiation that appears to be required for ERE initiation, we plotted a CCM extinction curve for R, plus two dotted extinction curves representing the uncertainty limits in the RV value, found to be appropriate for the dust in the molecular material in NGC 7023, in Figure 9. Assuming a ratio A(z)/A(V) = 0.59 for the R case, we place our measured ratio of FWHM(z)/FWHM(ERE) onto this graph as a horizontal line at A()/A(V) = 1.43. This constraint implies that only those wavelength ranges in which the extinction exceeds this horizontal limit exhibit adequate dust opacity to be consistent with our data in Figure 7. Resulting from the multi-valued nature of the extinction curve, this identifies two spectral regions: the range from 250 nm to 189 nm, where the horizontal line crosses the 217.5 nm bump in the extinction curve, and the region shortward of 118 nm in the far-UV, where the far-UV rise of the extinction curve reaches values in excess of our opacity constraint. Thus, similar to the investigation by Witt & Schild (1985), our method alone does not result in the identification of a unique spectral region responsible for ERE initiation, but it clearly excludes near-UV or optical radiation shortward of the ERE band from consideration.

We can now narrow down the choice between the two UV spectral ranges identified above by applying the results of Darbon et al. (1999) as a further constraint. In short, Darbon et al. (1999) found that stars with can excite ERE and very commonly do, while stars with do not. We entered the FUV cut-offs of the SEDs of atmospheres with these two temperatures in Figure 9 as two vertical lines. The long-wavelength limit of the spectral region in which ERE is initiated radiatively is defined by the point at which our applicable extinction curve enters from below the cross-hatched area limited by the three constraint lines. For R, this wavelength is 118 nm, corresponding to a photon energy near 10.5 eV. Therefore, the application of the constraints by Darbon et al. (1999) eliminates the 217.5 nm extinction band as the source of excitation of the ERE. Our new constraint based upon the penetration of the exciting radiation into the cloud face considerably narrows the acceptable wavelength range for ERE initiation allowed by the Darbon et al. (1999) results, however. Both sets of constraints are consistent with the possibility that photons with wavelengths between 118 nm and 91.2 nm, the latter limit being set by the competing absorption by HI, can contribute to ERE initiation.
4. Discussion
Having obtained a fairly accurate estimate of the wavelengths of the photons needed to initiate the ERE will be critical for determining further details of the ERE process as well as the identity of the ERE carrier. As we stated earlier, our present observations do not allow us to determine whether photons with eV are required to excite the ERE carrier, with (at best) one ERE photon resulting from each absorption of each far-UV photon, or whether the presence of far-UV photons is merely required for the creation of the ERE carrier, e.g. by either photo-ionization or photo-dissociation of an ERE-precursor, followed by pumping of the newly created ERE carrier by lower-energy optical photons. However, this issue can be resolved directly by counting the number of photons available in the 118 nm to 91.2 nm range that are absorbed in a given system and comparing this to the number of ERE photons emitted. We will return to this question in Sections 4.3 and 4.4.
4.1. Impact on Existing ERE Models
While the nature of the ERE as a dust-related interstellar photoluminescence process has been undisputed, many diverse proposals have been advanced for possible identifications of the ERE carrier (see Witt & Vijh, 2004, for a review). With the determination of the minimum wavelength of the radiation required for ERE initiation, many of these proposals can now be ruled out. In discussing these proposals below, we will focus primarily on the excitation requirements and not on respective failures to meet other observational constraints.
4.1.1 Neutral PAH Molecules
d’Hendecourt et al. (1986) proposed that fluorescence, i.e. electronic transitions from the S1 state to vibrational levels of the S0 ground state, or phosphorescence, i.e. electronic transitions from the T1 state to vibrational levels of the S0 ground state, in neutral polycyclic aromatic hydrocarbons (PAHs) could be responsible for the ERE. The same species are considered the likely source of the ubiquitous mid-IR aromatic emission features (AEF) (Bakes et al., 2004; Onaka, 2004; Peeters et al., 2004). In the laboratory, many PAH molecules are known to fluoresce efficiently at optical wavelengths. However, as noted by d’Hendecourt et al. (1986), PAH fluorescence generally occurs at much shorter wavelengths than the ERE band while phosphorescence frequently does occur in the same spectral region as the ERE. Although the T1 - S0 transitions are spin-forbidden, isolated PAH molecules in the ISM could conceivably be strong sources of phosphorescence, provided that the T1 state can attain high populations. The T1 state, which is always at a lower energy compared to the S1 state in neutral PAH molecules, is populated by intersystem crossings from excited states of the singlet manifold to highly-excited vibrational levels of the T1 state. This implies, therefore, that the excitation of phosphorescence occurs via the same absorption bands that excite the fluorescence in these molecules. The absorption spectra of neutral PAH molecules are well known; their absorption bands are found immediately shortward in wavelength of where their S1 - S0 fluorescence occurs, with the strongest bands found generally near 200 nm. Thus, the wavelengths of radiation required for the excitation of PAH fluorescence and PAH phosphorescence are two to three times longer than what was found in the present investigation. Recently, neutral PAH fluorescence (Vijh et al., 2004, 2005) has been detected in the Red Rectangle, an object in which ERE is present as well, and the spatial distributions of the two emissions were found to be distinctly different. This is only further support for our conclusion that neutral PAH phosphorescence from these same molecules is not the source of ERE. Very large neutral PAH molecules can fluoresce in the red spectral range, although their efficiency is low (Herod et al., 1996). Even if their quantum yield were higher, their dominant absorption bands are located in the optical range, which is in direct conflict with our measurements, requiring far-UV photons for ERE initiation.
4.1.2 PAH Clusters
Seahra & Duley (1999) suggested that PAH clusters in the form of stacks or aggregates of PAH molecules with up to 700 carbon atoms could produce ERE-like photoluminescence in a band centered near 700 nm. The same authors (Duley & Seahra, 1998) had previously proposed that the same PAH clusters could be responsible for the interstellar absorption band at 217.5 nm as well as the mid-IR AEF bands. The energy for both the ERE and the AEF in this model was to come from the absorption in the 217.5 nm band. While the present penetration study does not exclude this possibility, the application of the Darbon et al. (1999) constraint (Figure 9) does. The PAH cluster model is therefore not supported by the ERE excitation results.
The PAH cluster model of Seahra & Duley (1999) also makes other predictions that are in conflict with observations. In particular, it predicts the presence of two side bands to the main ERE band, appearing at wavelengths near 0.5 and 1.0 m, neither of which has been found in observational data (Gordon et al., 2000). Furthermore, it predicts a near-constant peak wavelength for the main ERE band near 0.7 m, while the observed ERE peak shifts by more than 200 nm in response to changes in the radiation envioronment, in which the ERE is being produced (Smith & Witt, 2002)
4.1.3 Hydrogenated Amorphous Carbon
Photoluminescence by grains consisting of hydrogenated amorphous carbon (HAC) or coated by HAC mantles was an early candidate for the ERE process (Duley, 1985; Witt & Schild, 1988; Duley & Williams, 1990; Jones et al., 1990). With a band gap of over 3 eV (Robertson, 1996), HAC not only exhibits efficient photoluminescence at wavelengths much shorter than observed in ERE, it also is efficiently excited at optical/near-UV wavelengths (Watanabe et al., 1982), which is in conflict with our present results. The latter objection can also be raised against a material closely related to HAC, referred to as quenched carbonaceous composite (QCC) (Sakata et al., 1992). While the band gap of various HAC materials can be reduced by a variety of treatments, the most efficient excitation occurs always just shortward of the emission band resulting from HAC photoluminescence. This puts these models in serious conflict with our new excitation constraints.
4.1.4 Silicon Nanoparticles
An ERE model that received intensive study in recent years involves photoluminescence by oxygen-passivated silicon nanoparticles (SNPs), containing between about 200 and 6000 silicon atoms (Witt et al., 1998; Ledoux et al., 1998, 2000, 2001, 2002; Smith & Witt, 2002; Li & Draine, 2002). The band gap of SNPs is size dependent due to quantum confinement and with suitable limits on the nanoparticle sizes it readily matches the observed wavelengths of the ERE band. However, again as in all instances of typical semiconductor photoluminescence, the most effective excitation occurs at energies just slightly above the band gap energies, i.e. slightly above 2.3 eV. In addition, SNPs are photo-ionized when exposed to photons with energies in excess of 5.1 eV (Fuke et al., 1993), with the result that photoluminescence from subsequent excitations is quenched (Nirmal & Brus, 1999; Smith & Witt, 2002). Consequently, our new constraints regarding ERE initialization also do not favor the SNP model.
4.2. Possible New ERE Carriers
All previously considered ERE carrier models appear to be inconsistent with the requirement that photons with energies in excess of 10.5 eV are required to initiate the ERE in astrophysical environments. There are several reasons for assuming that the energy limit of 10.5 eV is not directly related to the actual excitation of the ERE. Below, we will argue that the number density of photons with energies in excess of 10.5 eV in typical ERE-producing environments is insufficient to account for the number of ERE photons emitted from those environments, if the eV photons were to be the direct source of excitation, even if a photon conversion efficiency of 100% is assumed. A possible solution to this dilemma is provided by models in which the eV photons simply create the ERE carrier, with a small number of FUV photons required for its maintenance. The ERE carrier thus created needs to have the ability for efficient photoluminescence in the 540-900 nm wavelength range and strong absorption throughout the optical/UV regions of the spectrum, where ample photons for the pumping of the ERE are available. Furthermore, the carrier species involved in such a process must be abundant in the ISM in order to account for the contribution of the ERE carrier to the absorption in the ISM, amounting to about 10% of the photons of the Galactic interstellar radiation field in the 540-91.2 nm wavelength range (Gordon et al., 1998).

In terms of abundance and total cross section, interstellar PAHs meet these requirements. However, as shown in Section 4.1.1, neutral PAHs cannot account for the observed ERE. By contrast, doubly ionized PAH molecules offer interesting prospects. In Figure 10 we have plotted the first ionization potentials of neutral PAH molecules and of PAH mono-cations as a function of the size of the molecules as measured by their molecular weights. We note that most PAHs with up to 50 carbon atoms can be readily ionized into the mono-cation stage with photons with energies in the 6 eV to 8 eV range, and can subsequently be sent into the di-cation state with photons in the energy range from 10.5 to 13.6 eV. It should, therefore, be possible to find PAHs in the di-cation state in environments characterized by the presence of neutral or molecular hydrogen, as previously suggested by Leach (1987, 1996). PAH di-cations are closed-shell systems similar to neutral PAH molecules with S1-S0 transitions occurring at optical wavelengths longer than the corresponding transitions in neutral molecules. Fluorescence could thus be expected in the ERE range. The viability of such a model requires laboratory spectroscopy on PAH di-cations that could reveal the presence of optical fluorescence, following the excitation through near-UV/optical absorptions. No such experimental data exist at this time.

We can, however, obtain a general idea of the expected spectroscopic properties of PAH di-cations, using density-functional theory modeling calculations (TD-DFT) (Onida, Reining, & Rubio, 2002). This theory incorporates electronic screening and relevant correlation effects (Xie et al., 2004) for vertical electronic excitations in the ground-state geometry and thus represents a fully ab initio formalism for computing excited states. Over the past decade, TD-DFT has given promising results for finite systems (atoms, molecules, clusters) (Xie et al., 2004; Onida, Reining, & Rubio, 2002; Xie et al., 2005). In this paper, we use the TD-DFT implemented in the Gaussian 03 package (Frisch et al., 2003). Based on the ground-state structures for all clusters, which were optimized by using DFT (Kohn & Sham, 1965) with the nonlocal hybrid B3LYP functional (b3lyp), we compute the excited energies of both singlet and triplet states (Lewis & Kasha, 1944), the oscillator strengths, and the optical absorption gap (generally defined by the energy of the first dipole-allowed transition for finite systems (Xie et al., 2004)). To ensure the accuracy of our calculations, we choose the 6-31G(d,p) Pople-type basis set which adds polarization functions to the atoms (Xie et al., 2005).
In Figure 11 we show the composite absorption spectra of five PAH di-cations, including results for pyrene++ and anthracene ++, whose likely presence in their neutral and singly-ionized form in the Red Rectangle (HD 44179) has been demonstrated by both their blue fluorescence as well as their spectroscopic signature of the first ionization (Vijh et al., 2004, 2005). When compared with available experimental data for neutral and once-ionized PAH species, TD-DFT calculations agree remarkably well with experimental measurements (Malloci et al., 2004, and references therein). The spectra in Figure 11 show that representative PAH di-cations absorb strongly in the energy range from 2 eV to 7.5 eV, suggesting a characteristic band gap of 2 eV. Photoluminescence across this band gap could be responsible for the ERE.
A still controversial issue is the question of the stability of PAH di-cations against Coulomb explosion. A recent study of the fragmentation pathways of the di-cation of benzene by Rosi et al. (2004) revealed an unexpectedly high degree of stability. These authors suggest that the di-cations of multi-ringed PAHs could exhibit a still higher degree of stability and thus play a substantial role in interstellar chemistry and photophysics. Experimental results reported by Ledingham et al. (1999), involving the production of di-cations of the aromatic species benzene, monodeuterated benzene, toluene, and naphthalene through multi-photon soft ionization, have shown that the resultant di-cations are in fact stable. Multi-photon soft ionization is equivalent to interstellar conditions in the sense that the di-cations are produced with only a small amount of excess vibrational energy. In the ISM, this excess energy would have an upper limit equal to the difference between the energy of the Lyman limit of atomic hydrogen (13.6 eV) and the second ionization potential of an individual PAH molecule. In a PDR, such as the ERE filaments studied in this paper, photons with energies in excess of 11.14 eV will be absorbed preferentially by molecular hydrogen. Thus, to the extent that second ionizations of PAHs are possible with photons in the energy range from 10.5 eV - 11.14 eV, these would be extremely soft indeed.Therefore, both theory and experiment provide strong encouragement for considering the likely presence of PAH di-cations in interstellar environments where ERE is observed.
4.3. Consistency Check: The Red Rectangle
The two principal results emerging from the study of the excitation of the ERE in the NGC 7023 NW PDR are: (1) the ERE initiation requires photons with energies eV, e.g. for the creation of the ERE carrier; (2) the ERE process is most likely a two-step process, in which the first step creates the carrier via ionization or dissociation, requiring in excess of 10.5 eV, and the second step produces the actual excitation of the ERE carrier via longer-wavelength photons. In this section we will examine the Red Rectangle, one of the two environments where ERE is being produced with very high efficiency, the other being the high- Galactic cirrus.
Two aspects are of greatest significance, the morphology of ERE sources and the ERE energetics. The Red Rectangle is a well-studied bi-polar protoplanetary nebula with a circum-stellar disk obscuring the central source (Men’shchikov et al., 2002; Cohen et al., 2004). The central source consists of a AGB star with a K atmosphere (Vijh et al., 2005) and a low-mass () hot white dwarf of unknown luminosity, which could amount to at most (Men’shchikov et al., 2002; Driebe et al., 1998). This upper limit to the the white dwarf’s luminosity would apply only, however, during the yr duration of the stellar core’s contraction from the AGB region of the Hertzsprung-Russell diagram to the top of the white dwarf cooling sequence. Once the stellar core has reached a size corresponding to the white dwarf mass-radius relation, a more typical luminosity of a K hot white dwarf is about . The relevance of these luminosity limits will become apparent presently.
Spatially, the ERE in the Red Rectangle is confined to geometrically thin regions within the walls of the bi-conical outflow cavities (Schmidt & Witt, 1991; Cohen et al., 2004), leading to the appearance of the X-shaped bipolar structure, while scattering in the 500 to 350 nm wavelength range produces a spherical reflection nebula devoid of the bipolar structure (Cohen et al., 2004). The confinement of the ERE to the walls of the outflow cavity is in agreement with our finding of an initiation of the ERE by high-energy UV photons. These photons, stemming predominantly from the hot white dwarf, are spatially confined to the outflow cones and its walls by the optically thick circum-binary disk and the steeply rising far-UV opacity of the nebular dust in the Red Rectangle (Vijh et al., 2005). At wavelengths longward of 170 nm ( eV), the nebular opacity is greatly reduced. Thus, the mid-UV, near-UV and optical photons, which are produced almost entirely by the cooler but extremely luminous AGB star, are able to penetrate the walls of the outflow cavity and produce the nearly spherical blue reflection nebula component of the Red Rectangle (Cohen et al., 2004). They are also able to efficiently pump the ERE carriers produced in the thin wall regions of the outflow cones.
The ERE energetics of the Red Rectangle is particularly useful in supporting the concept of a two-step process of ERE excitation. Schmidt et al. (1980) reported the band-integrated ERE luminosity of the entire Red Rectangle nebula as . Using the currently accepted distance of 710 pc (Men’shchikov et al., 2002; Hobbs et al., 2004), we arrive at an estimate of for the Red Rectangle. This value is uncorrected for attenuation by the optically thick circum-binary disk surrounding the stellar sources as well as for any interstellar extinction along the line of sight. Given the unusual color characteristics of the RR and the non-isotropic morphology of the RR, these attenuations are difficult to estimate. The light of the central AGB star alone suffers an attenuation in excess of = 4 magnitudes (Vijh et al., 2005). We, therefore, consider it a conservative estimate that the total ERE in the RR suffers an attenuation by about 1 magnitude, resulting in a total estimated ERE luminosity of . If photons with eV were responsible for the actual excitation of the ERE in a single-step process, and if the excitation process were 100% efficient, with one ERE photon of 1.9 eV produced for every absorption of a eV photon, the total luminosity in eV photons required for this excitation would be . Thus, with somewhat more realistic assumptions about the ERE excitation efficiency of possibly 30% to 50%, we would require in excess of 100 in far-UV photons to produce the observed ERE luminosity of the Red Rectangle, well in excess of what is likely available from the hot white dwarf companion.
If, by contrast, the far-UV photons emitted by the hot white dwarf companion of the central AGB star are used solely for creating and maintaining the ERE emitters, the AGB star (; ) has more than enough energy to excite with mid-UV and optical photons. Assuming a Stokes shift of 1 eV typical for photoluminescence, absorption of an excitation energy of less than would suffice to generate , assuming 100% efficiency. Gordon et al. (1998) have estimated the ERE photon conversion efficiency to be %, which would lead to an upper limit for the ERE generating luminosity of . This is still only about 2.5% of the luminosity of the AGB star. Thus, a two-step process of ERE excitation is entirely feasible, given the energetics of the Red Rectangle nebula system.
4.4. Consistency Check: The High- Galactic Cirrus
Next to the Red Rectangle, the high- Galactic cirrus is another environment in which the intensity of the ERE is roughly equal to that of the dust-scattered light, for very similar reasons. First, in both instances the scattering geometry involves mainly large-angle scattering, which does not lead to high scattered-light intensities. Second, the illuminating radiation field in both cases contains both a strong far-UV component and a strong optical component (see Witt & Johnson (1973) for a spectrum of the interstellar radiation field), a condition which appears to be associated with highly efficient production of ERE. The interstellar medium giving rise to the high- Galactic cirrus is optically thin in the far-UV, where the ERE is initiated, as well as at the ERE wavelength range itself. This, coupled with a reasonably accurate knowledge of the spectrum of the exciting interstellar radiation field (Mathis et al., 1983), allows a reliable estimate of the ERE intensity per hydrogen atom along an average line of sight to be made, as well as an estimate of a lower limit of the photon conversion efficiency of the ERE process (Gordon et al., 1998).
Gordon et al. (1998) found an ERE intensity of ergs s-1 sr-1 H-atom-1 for the Galactic cirrus at degrees, independently confirmed by Szomoru & Guhathakurta (1998). With the well-established observed relation between hydrogen column density and extinction in the Galaxy (Diplas & Savage, 1994), Gordon et al. (1998) estimated that ()% of all photons that are absorbed from the interstellar radiation field by interstellar dust must be absorbed by the ERE carrier to produce the observed ERE intensity with a conversion efficiency of 100% on a photon-per-photon basis. If, as our current results suggest, far-UV photons are required to initiate the ERE, we must first consider the far-UV portion of the interstellar radiation field. If we consume photons through absorption by the ERE carrier, starting at the 91.2 nm limit set by the interstellar hydrogen opacity and proceed toward longer wavelengths, we find that we must use all photons shortward of 130 nm in wavelength or with energies down to 9.5 eV. This limit is indicated by a vertical dashed line in Figure 9, labeled 100%. We note that this limit violates the ERE initiation limit of 10.5 eV set by the opacity constraint found in NGC 7023. If we assume a more realistic conversion efficiency of 50% for the photons absorbed by the ERE carriers, all photons absorbed between 91.2 nm and 185 nm in wavelength would be required to generate the observed ERE intensity. This second limit is shown in Figure 9 as a dashed vertical line labeled 50%.
Therefore, in close analogy to the case of the Red Rectangle discussed earlier, we find that that the interstellar radiation field does not contain enough photons with energies eV to pump any ERE carriers sufficiently to generate the ERE intensities observed from the high- Galactic cirrus. Again, the problem would meet with a simple solution, if the high-energy photons are used solely to produce and maintain a population of ERE carriers which can then be pumped by the far more abundant optical/near-UV photons of the interstellar radiation field. Thus, a two-step process of ERE excitation is also being suggested by the data available for the high- diffuse interstellar medium.
5. Conclusions
We summarize our conclusions:
-
1.
We have imaged sharp molecular cloud edges in the NW PDR of the reflection nebula NGC 7023 in the light of the ERE band and in the light of emission from the H2 1-0 S(1) transition, using the HST ACS and HST NICMOS instruments, respectively. The cloud edges appear as narrow filaments with widths as small as 0.3 arcsec in both bands, while the appearance of the same cloud edges is broader and more diffuse in images showing dust-scattered radiation at H and in the z-band.
-
2.
In general, every H2 filament is matched by a corresponding ERE filament, while the reverse correlation does not hold to the same degree. We interpret this one-sided correlation as resulting from a density-dependent conversion efficiency of far-UV photons into near-IR 1-0 S(1) photons. In lower-density regions, absorption of far-UV photons by dust dominates over the absorption by H2 molecules, leading to ERE filaments without corresponding H2 filaments, while in higher-density regions absorptions of far-UV photons by dust and by H2 molecules are comparable.
-
3.
By comparing the widths of H2 filaments with the corresponding widths of the cloud edges in the z-band, we estimated the wavelength-dependence of the dust extinction in the molecular clouds comprising the NW PDR of NGC 7023. Assuming that the extinction follows the RV-dependent relationship developed by CCM, we found a value of R.
-
4.
By comparing the widths of the ERE filaments with the corresponding widths of the cloud edges in the z-band, we found the ERE filaments on average about 10% wider than the corresponding H2 filaments. This indicates that the dust opacity encountered by photons that initiate the ERE is only slightly smaller than the dust opacity encountered by photons exciting the H2 molecules. Given that the H2 emission in NGC 7023 is excited by far-UV photons with nm, the CCM-extinction curve of R identifies two regions of the spectrum where the dust opacity matches the required value, the range around the mid-UV extinction bump (250 nm to 189 nm) and the region shortward of 118 nm.
-
5.
We used the observation by Darbon et al. (1999) that stars with T K do not excite ERE to eliminate the possibility that ERE is initiated by mid-UV photons in the 250 nm to 186 nm range. This leaves far-UV photons at wavelengths shortward of 118 nm (10.5 eV) as the ultimate source of ERE excitation.
-
6.
We provided arguments showing that all existing ERE models fail in the face of this new requirement.
-
7.
With the examples of two environments where the ERE excitation is highly efficient and where the number of ERE photons has been determined, we demonstrated that the number of far-UV photons with energies in excess of 10.5 eV is insufficient to generate the number of observed ERE photons, assuming reasonable values for the photon conversion efficiencies.
-
8.
We concluded that the ERE excitation must therefore be a two-step process. The first step requires eV photons to produce the actual ERE carrier, probably by a process of photo-ionization or photo-dissociation of a suitable precursor. A modest far-UV flux would then suffice to maintain a population of ERE carriers thus created. The second step of the ERE excitation then requires efficient pumping of the ERE carrier by abundant optical/near-UV photons with energies above the ERE band-gap of eV.
-
9.
A possible ERE carrier must therefore be a system that (1) has an ionization or dissociation potential in excess of 10.5 eV, that (2) exhibits strong absorption in the optical/near-UV spectral region, and that (3) is capable of efficient photo-luminescence in the wavelength range of the ERE band.
-
10.
We suggest that PAH di-cations with masses amu appear to meet the first two of these three requirements. Laboratory experiments designed to study the possibility of fluorescence by PAH di-cations are needed to test their potential as ERE sources.
References
- An & Sellgren (2003) An, J. H., & Sellgren, K. 2003, ApJ, 599, 312
- Bakes et al. (2004) Bakes, E.L.O., Bauschlicher, C., & Tielens, A.G.G.M. 2004, in “Astrophysics of Dust”, ASP Conf. Ser. 309, eds. A.N. Witt, G.C. Clayton, & B.T. Draine, (ASP: San Francisco), 731
- Cardelli et al. (1989) Cardelli, J. A., Clayton, G. C., & Mathis, J. S. 1989, ApJ, 345, 245
- Cohen et al. (1975) Cohen, M., et al. 1975, ApJ, 196, 179
- Cohen et al. (2004) Cohen, M., Van Winckel, H., Bond, H. E., & Gull, T. R. 2004, AJ, 127, 2362
- Darbon et al. (1999) Darbon, S., Perrin, J.-M., & Sivan, J.-P. 1999, A&A, 348, 990
- Darbon et al. (2000) Darbon, S., Zavagno, A., Perrin, J.-M., Savine, C., Ducci, V., & Sivan, J.-P. 2000, A&A, 364, 723
- d’Hendecourt et al. (1986) d’Hendecourt, L. B., Leger, A., Olofsson, G., & Schmidt, W. 1986, A&A, 170, 91
- Diplas & Savage (1994) Diplas, A., & Savage, B. D. 1994, ApJ, 427, 274
- Draine (2004) Draine, B. T. 2004, in “Astrophysics of Dust”, ASP Conf. Ser. 309, eds. A. N. Witt, G. C. Clayton, & B. T. Draine, (ASP: San Francisco), 691
- Draine & Bertoldi (1996) Draine, B. T., & Bertoldi, F. 1996, ApJ, 468, 269
- Driebe et al. (1998) Driebe, T., Schoenberner, D., Bloecker, T., & Herwig, F. 1998, A&A, 339, 123
- Duley (1985) Duley, W. W. 1985, MNRAS, 215, 259
- Duley & Seahra (1998) Duley, W. W., & Seahra, S. 1998, ApJ, 507, 874
- Duley & Williams (1990) Duley, W. W., & Williams, D. A. 1990, MNRAS, 247, 647
- Eilfeld & Schmidt (1981) Eilfeld, P., & Schmidt, W. 1981, J. Electron. Spectrosc. Relat. Phenomena, 351, 101
- Field et al. (1994) Field, D., Gerin, M., Leach, S., Lemaire, J. L., Pineau Des Forets, G., Rostas, F., Rouan, D., & Simons, D. 1994, A&A, 286, 909
- Field et al. (1998) Field, D., Lemaire, J. L., Pineau des Forets, G., Gerin, M., Leach, S., Rostas, F., & Rouan, D. 1998, A&A, 333, 280
- Frisch et al. (2003) Frisch, M.J., et. al. 2003, Gaussian 03 (Revision B.05) (Gaussian, Inc., Pittsburgh PA)
- Fuente et al. (1996) Fuente, A., Martin-Pintado, J., Neri, R., Rogers, C., & Moriarty-Schieven, G. 1996, A&A, 310, 286
- Fuke et al. (1993) Fuke, K., Tsukamoto, K., Misaizu, F., & Sanekata, M. 1993, J. Chem. Phys., 99, 7807
- Furton & Witt (1990) Furton, D. G., & Witt, A. N. 1990, ApJ, 364, L45
- Furton & Witt (1992) Furton, D. G., & Witt, A. N. 1992, ApJ, 386, 587
- Gordon et al. (1998) Gordon, K. D., Witt, A. N., & Friedmann, B. C. 1998, ApJ, 498, 522
- Gordon et al. (2000) Gordon, K. D., et al. 2000, ApJ, 544, 859
- Herod et al. (1996) Herod, A. A. et al. 1996, Rpd. Comm. Mass Spectrom., 10, 171
- Hobbs et al. (2004) Hobbs, L. M., Thorburn, J. A., Oka, T., Barentine, J., Snow, T. P., & York, D. G. 2004, ApJ, 615, 947
- Jones et al. (1990) Jones, A. P., Duley, W. W., & Williams, D. A. 1990, QJRAS, 31, 567
- Kohn & Sham (1965) Kohn, W., & Sham, L. J. 1965, Phys. Rev. 140, A1133
- Kurucz et al. (1974) Kurucz, R. L., Peytremann, E., & Avrett, E. H. 1974, Blanketed Model Atmospheres for Early-Type Stars, (Washington, DC: Smithsonian Institution)
- Leach (1987) Leach, S. 1987, in “Polycyclic Aromatic Hydrocarbons and Astrophysics”, eds. A. Leger, L. d’Hendecourt, & N. Boccara, (Dordrecht: Reidel Publ. Comp.), 99
- Leach (1996) Leach, S. 1996, Zeitschr. f. Physik. Chem., 195, 15
- Ledingham et al. (1999) Ledingham, K. W. D., et al. 1999, J. Phys. Chem. A, 103, 2952
- Ledoux et al. (1998) Ledoux, G., et al. 1998, A&A, 333, L39
- Ledoux et al. (2002) Ledoux, G., Gong, J., Huisken, F., Guillois, O., & Reynaud, C. 2002, Applied Physics Letters, 80, 4834
- Ledoux et al. (2001) Ledoux, G., Guillois, O., Huisken, F., Kohn, B., Porterat, D., & Reynaud, C. 2001, A&A, 377, 707
- Ledoux et al. (2000) Ledoux, G., Guillois, O., Porterat, D., Reynaud, C., Huisken, F., Kohn, B., & Paillard, V. 2000, Phys. Rev. B, 62, 15942
- Lemaire et al. (1996) Lemaire, J. L., Field, D., Gerin, M., Leach, S., Pineau des Forets, G., Rostas, F., & Rouan, D. 1996, A&A, 308, 895
- Lemaire et al. (1999) Lemaire, J. L., Field, D., Mailard, J. P., Pineau des Forets, G., Falgarone, E., Pijpers, F. P., Gerin, M., & Rostas, F. 1999, A&A, 349, 253
- Lewis & Kasha (1944) Lewis, G. N., & Kasha, M. 1944, J. Am. Chem. Soc. 66, 2100
- Li & Draine (2002) Li, A., & Draine, B. T. 2002, ApJ, 564, 803
- Malloci et al. (2004) Malloci, G., Mulas, G., & Joblin, C. 2004, A&A, 426, 105
- Mathis et al. (1983) Mathis, J. S., Mezger, P. G., & Panagia, N. 1983, A&A, 128, 212
- Men’shchikov et al. (2002) Men’shchikov, A. B., Schertl, D., Tuthill, P. G., Weigelt, G., & Yungelson, L. R. 2002, A&A, 393, 867
- Nirmal & Brus (1999) Nirmal, M. & Brus, L. 1999, Acc. Chem. Res., 32, 407
- Onida, Reining, & Rubio (2002) Onida G., Reining, G. L., & Rubio, A. 2002, Rev. Mod. Phys. 74, 601
- Onaka (2004) Onaka, T. 2004, in “Astrophysics of Dust”, ASP Conf. Ser. 309, eds. A.N. Witt, G.C. Clayton, & B.T. Draine, (ASP: San Francisco), 163
- Peeters et al. (2004) Peeters, E., Allamandola, L.J., Hudgins, D.M., Hony, S., & Tielens, A.G.G.M. 2004, in “Astrophysics of Dust”, ASP Conf. Ser. 309, eds. A.N. Witt, G.C. Clayton, & B.T. Draine, (ASP: San Francisco), 141
- Perrin & Sivan (1992) Perrin, J.-M., & Sivan, J.-P. 1992, A&A, 255, 271
- Perrin et al. (1995) Perrin, J.-M., Darbon, S., & Sivan, J.-P. 1995, A&A, 304, L21
- Pierini et al. (2002) Pierini, D., Majeed, A., Boroson, T. A., & Witt, A. N. 2002, ApJ, 569, 184
- Robertson (1996) Robertson, J. 1996, Phys. Rev. B, 53, 16302
- Rosi et al. (2004) Rosi, M., Bauschlicher, C. W., & Bakes, E. L. O. 2004, ApJ, 609, 1192
- Sakata et al. (1992) Sakata, A., Wada, S., Narisawa, T., Asano, Y., Iijima, Y., Onaka, T., & Tokunaga, A. T. 1992, ApJ, 393, L83
- Schmidt et al. (1980) Schmidt, G. D., Cohen, M., & Margon, B. 1980, ApJ, 239, L133
- Schmidt & Witt (1991) Schmidt, G. D., & Witt, A. N. 1991, ApJ, 383, 698
- Seahra & Duley (1999) Seahra, S. S., & Duley, W. W. 1999, ApJ, 520, 719
- Smith & Witt (2002) Smith, T. L., & Witt, A. N. 2002, ApJ, 565, 304
- Smith et al. (2004) Smith, T. L., Clayton, G. C., & Valencic, L. 2004, AJ, 128, 357
- Szomoru & Guhathakurta (1998) Szomoru, A., & Guhathakurta, P. 1998, ApJ, 494, L93
- Takami et al. (2000) Takami, M., Usuda, T., Sugai, H., Kawabata, H., Suto, H., & Tanaka, M. 2000, ApJ, 529, 268
- van Dokkum (2001) van Dokkum, P. G. 2001, PASP, 113, 1420
- Vijh et al. (2004) Vijh, U. P., Witt, A. N., & Gordon, K. D. 2004, ApJ, 606, L65
- Vijh et al. (2005) Vijh, U. P., Witt, A. N., & Gordon, K. D. 2005, ApJ, 619, 368
- Watanabe et al. (1982) Watanabe, I., Hasegawa, S., & Kurata, Y. 1982, Jap. J. Appl. Phys., 21, 856
- Witt & Boroson (1990) Witt, A. N., & Boroson, T. A. 1990, ApJ, 355, 182
- Witt et al. (1998) Witt, A. N., Gordon, K. D., & Furton, D. G. 1998, ApJ, 501, L111
- Witt & Johnson (1973) Witt, A. N., & Johnson, M. W. 1973, ApJ, 181, 363
- Witt & Malin (1989) Witt, A. N., & Malin, D. F. 1989, ApJ, 347, L25
- Witt & Schild (1985) Witt, A. N., & Schild, R. E. 1985, ApJ, 294, 225
- Witt & Schild (1988) Witt, A. N., & Schild, R. E. 1988, ApJ, 325, 837
- Witt et al. (1984) Witt, A. N., Schild, R. E., & Kraiman, J. B. 1984, ApJ, 281, 708
- Witt & Vijh (2004) Witt, A. N., & Vijh, U. P. 2004, in “Astrophysics of Dust”, ASP Conf. Ser. 309, eds. A.N. Witt, G.C. Clayton, & B.T. Draine, (ASP: San Francisco), 115
- Xie et al. (2005) Xie, R. H., Bryant, G. W., Kar, T., Zhao, J., Smith, V. H. 2005, Phys. Rev. B 71, 125422
- Xie et al. (2004) Xie, R. H., Garnett, G. W., Sun, G., Nicklaus, M. C., Heringer, D., Frauenheim, T., Manaa, M. R., Smith, V. H., Araki, Y., & Ito, O. 2004, J. Chem. Phys., 120, 5133
- Zubko et al. (2004) Zubko, V., Dwek, E., & Arendt, R. G. 2004, ApJS, 152, 211