Dust in the Host Galaxies of Supernovae
Abstract
We present Spitzer/MIPS 24m observations of 50 supernova host galaxies at in the Great Observatories Origins Deep Survey (GOODS) fields. We also discuss the detection of SN host galaxies in SCUBA/850m observations of GOODS-N and Spitzer/Infrared Spectrograph (IRS) 16m observations of GOODS-S. About 60% of the host galaxies of both Type Ia and core-collapse supernovae are detected at 24m, a detection rate which is a factor of 1.5 higher than the field galaxy population. Among the 24m detected hosts, 80% have far-infrared luminosities that are comparable to or greater than the optical luminosity indicating the presence of substantial amounts of dust in the hosts. The median bolometric luminosity of the Type Ia SN hosts is 1010.5 L☉, very similar to that of core-collapse SN hosts. Using the high resolution Hubble/ACS data, we have studied the variation of rest-frame optical/ultraviolet colors within the 24m detected galaxies at to understand the origin of the dust emission. The 24m detected galaxies have average colors which are redder by 0.1 mag than the 24m undetected hosts while the latter show greater scatter in internal colors. This suggests that a smooth distribution of dust is responsible for the observed mid- and far-infrared emission. 70% of supernovae that have been detected in the GOODS fields are located within the half-light radius of the hosts where dust obscuration effects are significant. Although the dust emission that we detect cannot be translated into a line of sight AV, we suggest that the factor of 2-3 larger scatter in the peak colors that is seen in the high-z Type Ia supernova sample relative to the low-z supernovae might be partially due to the dust that we detect in the hosts.
1 Introduction
The use of supernovae (SNe), both Type Ia and Type II, as precision cosmological tracers is an expanding field with various, dedicated telescope searches and proposed missions. There are certain possible systematic effects which have been proposed as affecting the calibration of SNe light curves as distance indicators. Primary among these are grey dust in the intergalactic medium (IGM; Aguirre 1999) or dust in the SN host galaxy. A second systematic is the proposed variation in the SN light curves with progenitor metallicity (e.g. Hoeflich et al. 1998). The evidence for the presence of grey dust in the IGM is not very strong. It is thought to be heated by the ambient ultraviolet radiation field and be detectable by a contribution to the far-infrared extragalactic background light. Since infrared luminous galaxies can account for almost all of the DIRBE measured (Hauser et al. 1998) far-infrared background (Chary&Elbaz 2001; CE), the contribution to the far-infrared background from dust in the IGM can not be substantial. Metallicity variations in the progenitors of high redshift SNe are difficult to measure because even large (3) changes in metallicity result in a change of 0.3 mag in the colors of the light curve. A decrease in progenitor metallicity results in observed colors first becoming redder at and bluer at high-z. This color variation cannot be discriminated from the effects of dust reddening until multi-band light curves are created.
The co-moving far-infrared luminosity density of the Universe has been shown to evolve by more than an order of magnitude between redshifts of 0 and 1 (Chary & Elbaz 2001). In contrast, the UV luminosity density, increases only by a factor of 2-3 over this redshift range, implying that the average dust extinction in the Universe increases with redshift. The bulk of this is thought to be due to an evolution in the number density of infrared luminous galaxies which emit the dominant fraction of their bolometric luminosity at far-infrared wavelengths and which are thought to dominate the cosmic star-formation history of the Universe between z. The effect on dust extinction in normal galaxies which dominate the optical/near-infrared number counts of galaxies is less well known since mid and far-infrared surveys have not been sensitive to L1011 L☉ at z1. The average colors of high redshift supernovae do not show the evolution of dust extinction with redshift inferred from deep galaxy surveys (Perlmutter et al. 1999, Riess et al. 2004). This is not a selection effect in SN searches done with the Great Observatories Origins Deep Survey (GOODS; Strolger et al. 2004), since the supernovae are detected about 1-2 magnitudes brighter than the limiting sensitivity of the detection image. However, the high redshift color measurement does have a higher intrinsic uncertainty than at low redshifts. For example, the 1 color of the SNe at low redshift in the Perlmutter et al. (1999) sample is 0.05 mag while those at high redshift are around 0.15 mag although the mean of both samples is found to be indistinguishable from the SNe at low redshift (see also Riess et al. 2004). Attributing the scatter in the colors to variation in the dust extinction along the lines of sight to different supernovae could imply as much as 0.45 mags of visual extinction for a Galactic type dust distribution. However, there would have to be an evolution of 0.15 mag in the intrinsic peak colors of the SN as well for all the color scatter to be associated with dust. Grey dust, on the other hand, would be undetectable in color diagrams and requires optical to near-infrared colors of SNe to be measured (e.g. Nobili et al. 2005).
Type Ia SNe are thought to be end-states in the evolution of 3M8 M☉ mass stars. Since such stars have a larger contribution to the stellar mass budget and longer evolutionary timescale than high mass stars, the rates of such SNe in massive galaxies should be higher than the rate in low mass galaxies which have not undergone very much star-formation in the past. Type II+Ib/c SNe (which we collectively refer to as core-collapse or CC SNe) on the other hand should preferentially be occurring in star-forming galaxies. Since infrared luminous galaxies dominate the star-formation history of the Universe, core-collapse SNe should mostly have infrared luminous hosts. The 24m observations of the GOODS (Chary et al. 2005, in preparation) undertaken with the Spitzer Space Telescope (Werner et al. 2004) are sensitive to unprecedented flux density limits of 1020Jy. These observations directly measure the redshifted mid-infrared emission from polycyclic aromatic hydrocarbons and the continuum from very small grains that are transiently heated to T300 K. By adopting the correlation observed between the mid-infrared and far-infrared luminosity of galaxies in the local Universe it is possible to place constraints on the bolometric luminosity of the SN host galaxies (Chary & Elbaz 2001).
In this paper, we provide mid- and far-infrared photometry of SNe host galaxies in the GOODS-N 111http://data.spitzer.caltech.edu/popular/goods/ and GOODS-S fields (Dickinson et al. 2005, in preparation). We demonstrate that the SNe host galaxies clearly have significant dust content, despite the fact that the average colors from the SNe Ia light curves show little evidence for reddening. An analysis of the properties of the host galaxy such as their internal colors and color dispersion, and position of the supernova within the host are also made. We adopt the standard (=0.27,=0.73,H0=71 km s-1 Mpc-1) cosmology throughout this paper.
2 Observations
The 24m data presented here were taken as part of the Great Observatories Origins Deep Survey Spitzer Legacy program (Dickinson et al. 2005; in preparation). A detailed description of the reduction and analysis procedures to obtain the final mosaic and source catalog will be presented else where (Chary et al. 2005, in preparation). Briefly, the 24m observations were taken using the Multiband Imaging Photometer Spectrometer (MIPS; Rieke et al. 2004). They cover 165 arcmin2 in each of the GOODS Northern and Southern fields (center: 12h36m54.9s, 62d14m19.2s and center: 03h32m30.4s, -27d48m16.8s; J2000) up to an exposure time of 10.4 hours per pixel. The data have an angular resolution of 5.7 full width half maximum (FWHM) while the relative astrometric accuracy derived by matching the 24m sources with 2MASS stars and the GOODS Infrared Array Camera (IRAC) images, is better than 0.25. All but 10 low redshift sources are point sources at this spatial resolution. The sources discussed in this paper are unresolved at MIPS resolution while most are unresolved even at IRAC resolution. In the northern field, source catalogs were generated by using the positions of sources in the higher resolution IRAC images and fitting groups of point sources using a singular value decomposition technique at the positions of the IRAC sources to minimize the effect of source confusion. All SNe hosts and nearby sources which might contaminate the 24m photometry of the host have accurate IRAC positions which allow all sources in the field to be simultaneously fit for. This is equivalent to a DAOPHOT-type approach which is commonly adopted to obtain stellar photometry in crowded fields. The source catalogs are 84% complete down to a flux density limit of 24Jy. The GOODS-S 24m data were made available only in June 2005 and have not undergone the detailed cataloging effort of the northern field. We have extracted photometry of the host galaxies using the same “IRAC-prior” technique. Although the flux uncertainties of the GOODS-S sources might vary depending on the residual images, we find the photometry in the southern field to be reliable at the 1020% level. The Hubble Advanced Camera for Surveys (ACS) and -band data which are used in this analysis were taken as part of the Hubble GOODS Treasury program and are described in Giavalisco et al. 2004.
The properties of the SNe in the GOODS fields, including their coordinates, redshift and type were compiled from Strolger et al. (2004). Although we do not see the SN in the ACS mosaics, some of the SN coordinates have been modified from Strolger et al. (2004). The absolute astrometry of the full GOODS/ACS data set enables the position of the host galaxy nucleus to be estimated to an accuracy of better than 0.25 and the SN coordinates are re-derived based on the published offset of the SN from the host. A few additional SNe (SN1997ff, SN1997fg, SN2002dc, SN2002dd, SN1999gu, SN2003lt, SN2003lu, SN2004R) were obtained from the IAU CBAT service222http://cfa-www.harvard.edu/iau/cbat.html and were discovered in various past and ongoing searches such as those by Gilliland et al. (1999), Blakeslee et al. (2003), Strolger&Riess (2004), Cappellaro et al. (2000). A listing of all the SNe considered in this paper and 24m flux densities from their host galaxies is compiled in Tables 1 and 2. SN 1997ch, 1997ci and 1997cj, 2001ip and 1999gt although in the vicinity of the GOODS fields, do not have 24m coverage and are omitted from further discussion.
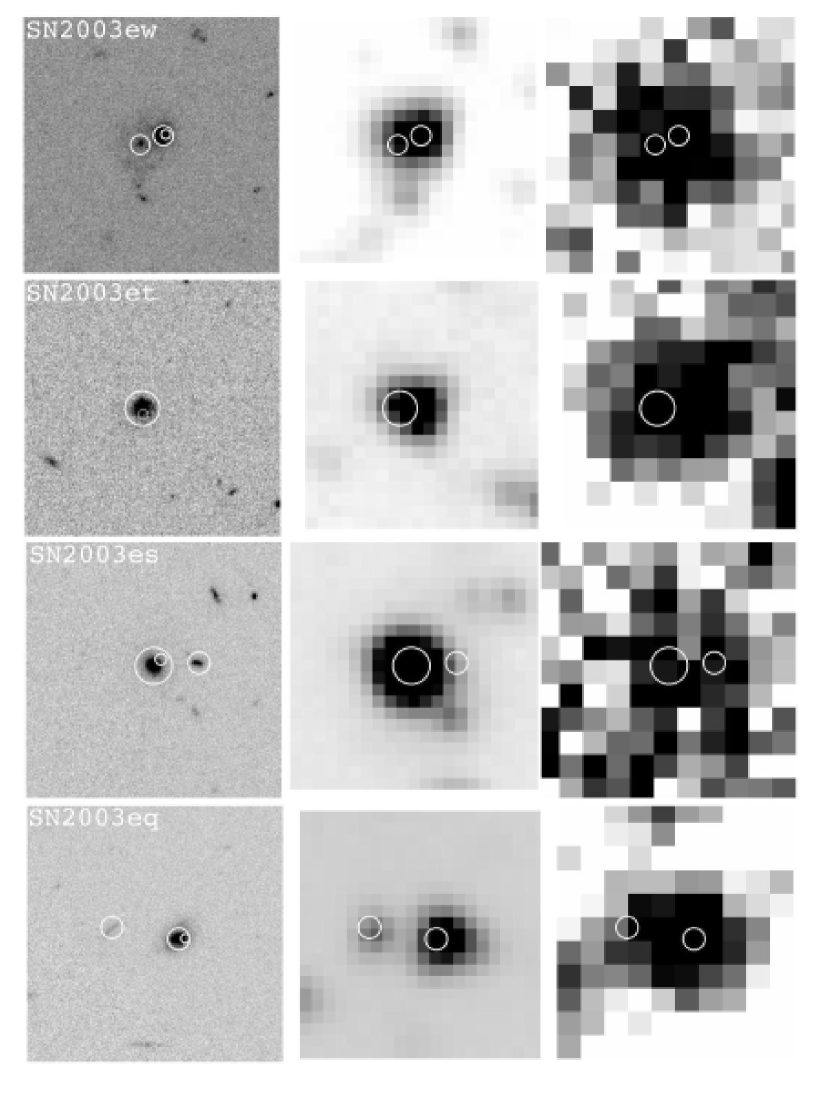
In order to match the 24m data to the high resolution ACS data we have firstly, identified the location of the host galaxy of the SNe in the ACS images from a search of the literature (Strolger et al. 2004; Blakeslee et al. 2003; Riess et al. 2003; Gilliland et al. 1999). As we will describe in Chary et al. (2005, in preparation), to alleviate the effect of sources blended in the MIPS 24m images, we have utilized the IRAC data which have an intermediate spatial resolution of 2 to generate MIPS catalogs. Figure 1 shows representative snapshots of ACS -band, Spitzer IRAC 3.6/4.5 m and MIPS 24m images. The Spitzer detections of the SN host galaxies fall under three categories:
-
•
The supernova host in the IRAC and MIPS images is clearly separated from all nearby galaxies (e.g. SN 1997fg, SN2002dc, 2003N, 2003ba, 2003bb, 2003be, 2003dx, 2003eb, 2003er, 2003et);
-
•
The supernova host is clearly separated in the IRAC images but the MIPS counterpart is blended (e.g. SN 1997ff, 2003eq, 2003es). These have been deblended in our source lists.
-
•
The supernova host is blended with nearby galaxies in the IRAC images and the MIPS images (e.g. SN 2002dd, 2002kh, 2002ki, 2003az, 2003bc, 2003ew). We mostly provide limits for these sources unless it is clear that the IRAC counterpart belongs to the host galaxy.
Of the 9 host galaxies that are blended at 24m at Spitzer resolution, we are unable to deblend the various components of emission only for four (SN 2002dd, 2002ki, 2003bc, 2003ew) and we either provide 1 uncertainties or an upper limit to the total flux density observed at the location of the source. The hosts of SN2003bd and SN2003fv are unknown/undetected at any optical/infrared wavelength including the new GOODS Spitzer images.
Flux uncertainties are calculated by the PSF weighted sum of variance values in the 24m residual image after all sources have been fit and subtracted. These are conservative uncertainties which include a term for the confusion noise whereby the flux density of a nearby source affects the quality of photometry on the source of interest, leaving a larger residual.
We have also utilized the SCUBA 850m supermap in the HDF-N (Borys et al. 2003) and Spitzer Infrared Spectrograph (IRS; Houck et al. 2004) 16m imaging (Teplitz et al. 2005) of GOODS-S to get additional constraints on the dust properties of SNe host galaxies. Only one of the SNe hosts in the HDF-N (2002dc) is detected in the SCUBA supermap. The presence of a 1.4 GHz radio counterpart allows the 850m source to be securely identified with the SN host galaxy (Pope et al. 2005).
In the GOODS-S, the Spitzer/IRS 16m observations reach a limiting sensitivity of 40Jy. Since this is also a shorter wavelength compared to the GOODS 24m observations, they are effectively a factor of 24 less sensitive than the 24m data for the detection of dusty galaxies. We find that only 5 of the brightest 24m-detected GOODS-S SN hosts are detected in the 16m survey. Three of these are CC SNe hosts (2002kb, 2002hq and 2002fz) while two are the hosts of Type Ia SNe (2002kc and 2002kd). We include these measurements for completeness since their primary utility is in independently confirming the infrared luminosity derived from the higher signal-to-noise GOODS 24m data.
3 Origin of Mid-infrared Emission in SNe Host Galaxies
In local galaxies, the mid-infrared emission arises from very small grains heated in star-forming regions of the galaxy or in a nuclear starburst. It has also been shown that the mid-infrared emission can arise from dust heated by the ambient interstellar radiation field (Li & Draine 2002). The mid-infrared luminosity of local galaxies in the IRAS bright galaxy sample (Soifer et al. 1987) has been found to be correlated strongly with their far-infrared luminosity which is dominated by large, cool dust grains (CE). This correlation has been applied to develop a library of model templates for the mid and far-infrared spectral energy distribution of galaxies. Given the redshift and observed 24m (16m) flux density of the source, we can select the template which gives the closest 24m (16m) flux density at that redshift to apply a bolometric correction. The corrections based on the CE and Dale&Helou (1999) templates are used to derive an infrared luminosity LIR=L. This technique of deriving the bolometric luminosity from the rest-frame mid-infrared luminosity is shown to be accurate to 40% in the local Universe (CE01). The derived LIR are shown in Figure 2 and Tables 3 and 4. The difference between the derived LIR from the two templates is assumed to be representative of the systematic uncertainty in the bolometric correction. Statistical uncertainties are assumed to correspond to the signal to noise ratio of the source at 24m.
The fundamental assumption in this technique is that the bolometric correction is dependent only on the mid-infrared luminosity of the object. In principle, it is possible for sources to have a lower FIR/MIR ratio for a particular MIR luminosity which would increase the systematic uncertainty in the bolometric correction. However, the validity of the mid- to far-infrared correlation and the one-to-one correlation between the bolometric correction and the MIR luminosity has been tested for field galaxy samples out to z1 (Appleton et al. 2004, Marcillac et al. 2005) which enables the bolometric luminosity to be derived for the SN host sample.
We find that about 60% (28/48 excluding SN2003bd and SN2002fv which do not have hosts) of all SNe host galaxies are detected in the mid-infrared, and that their infrared luminosities span the range of typical dusty field galaxies rather than extreme ultraluminous infrared galaxies. The optical luminosities of these galaxies are calculated as the greater of Lν in the ACS or band. Among the 24m detected host galaxies, more than 80% (23/28) have infrared luminosities that are comparable to or greater than their optical/ultraviolet luminosities. Performing a similar analysis with a redshift-limited field galaxy sample (1700 galaxies) from GOODS, we find that 36% of the field galaxies have LIR/Lopt0.8, a factor of 1.5 lower than the SNe hosts, indicating the presence of significant quantities of dust within the SN host galaxies.
To assess if this difference is because of a difference in the redshift distribution of the two samples of galaxies, we performed a monte-carlo selection of sources from the field galaxy sample such that the selected sources had a redshift distribution identical to that of the SN hosts. The fraction of selected sources whose LIR/Lopt0.8 was derived. This selection procedure was repeated a 1000 times. We performed a similar procedure such that the selected sources had the same -band apparent magnitude distribution as that of the hosts. We find that in a field galaxy population with the same redshift/apparent magnitude distribution as the SN hosts, the fraction of sources with LIR/Lopt0.8 is only 328%, implying that dusty galaxies are preferentially the hosts of high redshift SNe.
The most likely reason for this preference is that high-z dusty galaxies are either in the throes of a starburst or have undergone a large burst of star-formation in their past history. In the former case, the dust would presumably be localized around star-forming regions while in the latter case, the dust would have been produced in the shells of the AGB stars that have evolved out of the starburst. In either case, the evolving starburst would be ripe for the progenitors of both types of SNe.
A possible alternative to this conclusion is that the 24m emission arises from an active galactic nucleus in the host galaxy. AGN-dominated systems are thought to have LX/L while starburst dominated systems typically have LX/L. Matching the HDF-N 2Ms X-ray catalog and CDF-S 1Ms catalog (Alexander et al. 2003) results in X-ray detections of six SN host galaxies. These are the host galaxies of SN1997ff, SN2002dc, SN2003bb, SN2003er, SN2003es, SN2002kd. The hosts of 2003er, 2003bb, 2002dc and 2002kd are extremely faint X-ray sources that are only detected in the soft band and whose X-ray flux is probably dominated by star-formation. The X-ray luminosities are in the range 1040-1041 erg s-1 implying LX/L, strongly indicative of star-formation dominated sources. The hosts of SN 1997ff and 2003es are detected in the hard-band with luminosities of 31042 erg s-1. The latter has a measured photon index of indicative of AGN emission and has an LX/LIR ratio of 0.05 which is a factor of 20 higher than the former. This implies that the X-ray and 24m emission in the SN2003es host is arising from a Seyfert nucleus while the distinction is unclear for the host of SN1997ff. The remainder of the 24m detected hosts are undetected in the X-rays with the resultant constraints on the LX/LIR ratio falling in the starburst regime. As a result, we believe that for the majority of the detected SNe host galaxies, the mid- and far-infrared emission cannot be powered by an AGN.
Another alternative which has been suggested for the far-infrared emission of the host galaxies is diffuse cirrus (Farrah et al. 2004). Clements et al. (2004, 2005) and Farrah et al. (2004) obtained deep submillimeter observations of a sample of Type Ia SN hosts. Despite a low detection rate, they performed stacking analysis to get a constraint on the total dust emission in the hosts. Based on the optical extinction value and 450m to 850m colors of one of the hosts, they interpret the source of far-infrared emission to be cirrus. Among our sample, only the host galaxy of SN 2002dc is seen in the 850m data with a flux density of 1.70.4 mJy (GN13 in Pope et al. 2005). This is perfectly consistent with the low detection rate seen in the aforementioned submillimeter surveys. The predicted 24m/850m flux density ratio due to cirrus emission in a galaxy at should be about 0.05 (e.g. Arendt et al. 1998) while the observed ratio for the SN2002dc host is 0.220.05, indicating that cirrus, whose spectrum peaks at 100m cannot be the source of emission in this host. If cirrus were to dominate the mid-infrared emission, then the submillimeter flux would be exceeded ruling out this possibility. We also utilize the template SED which was used to derive the bolometric correction, to derive an 850m flux density for each host galaxy. We find that the typical 850m flux density is 0.1mJy while the 1 uncertainty in the 850m data is the range 0.5-1.5 mJy. The stacked average 850m flux density for the 26 host galaxies (excluding 2002dc) yields -0.270.20 mJy which is consistent with the average value of 0.1 mJy derived from the templates.
Significant efforts have been made to generate Type Ia SNe Hubble diagrams partitioned by host galaxy morphological type (Sullivan et al. 2003) to mitigate the effects of dust. As a result it is useful to compare the 24m detections with the rest-frame optical/ultraviolet morphological type of the galaxies. Visual inspection of the ACS data indicates that the morphologies of the SNe host galaxies span the whole range including disturbed ellipticals/S0 (SN1997ff, SN2003az, SN2003er, SN2003es, SN2003ew, SN2002lg), spirals (SN2002dc, SN2002kh, SN2003ba, SN2003bb, SN2003be, SN2003dx, SN2003eq, SN2002fz, SN2002hq, SN2002kb, SN2002kc, SN2002kd) and irregulars (SN1997fg, SN2002dd, SN2003N, SN2003eb, SN2003et, SN2002fw). Of the Type Ia SNe hosts that are detected at 24m, irregulars make up 4/14, Early type S0/compact hosts make up 4/14 while spirals/disks make up 6/14, a distribution quite similar to that compiled by Riess et al. (2002) for Type Ia SNe from the Asiago catalog (Cappellaro et al. 1997). For the CC SNe hosts detected at 24m, irregulars make up 2/13, early type S0/compact hosts 3/13, and spirals 8/13. Within the uncertainties, the morphological distribution of galaxies for the two types of SNe are not dissimilar. Furthermore, the mid-infrared flux from the early-type galaxes exceeds their optical/near-infrared flux by factors of , comparable to the ratio in late-type galaxies. This is more than an order of magnitude above the level expected from stellar photospheric emission in dust-poor early type galaxies in the local Universe implying that in the high redshift Universe, significant quantities of dust are present even in early-type galaxies (see also e.g. Krause et al. 2003).
4 Implications for SNe
Of the 45 SNe in the GOODS fields which have hosts and SN types determined, 27 are Type Ia’s while 18 are CC. At least 10 of the 27 Type Ia host galaxies are detected at 24m with significant, but blended detections of 4 others, for a detection rate of 52%. In comparison, at least 13 (76%) of the 18 CC host galaxies are detected at 24m with one additional possibly blended detection. In all, the detected Type Ia SNe host galaxies include 9/18 Type Ia SNe that were used by Riess et al. (2004) and Riess et al. (2003) to trace cosmological parameters.
CC SNe are intrinsically 1-2 mags less luminous than Type Ia SNe. They are detected only at while Type Ia SNe have been detected out to . Since the bolometric correction in translating the observed mid-infrared flux density of the host galaxies to LIR is strongly redshift dependent and the ACS data trace rest-frame optical colors at we restrict our comparison between the properties of Type Ia and CC SNe hosts to a common redshift range i.e. .
Despite the small sample, Type Ia SNe host galaxies (including the limits), have a median LIR of 41010 L☉, which is very similar to the value observed for the CC SNe hosts. None of the host galaxies would be classified as ultraluminous infrared galaxies (ULIGs; L L☉). A K-S test between the infrared luminosities of the two host galaxy populations returns a probability of 0.5, suggesting that they are different subsets of the field galaxy population. The similarity in LIR values is surprising because core-collapse SNe are thought to be the end states in the evolution of very massive stars and would preferentially be associated with ongoing star-formation. Since it has been shown that the majority of the star-formation in the high redshift Universe takes place in LIGs with 10L L☉ (Elbaz et al. 2002, Le Floch et al. 2005), CC SNe should prefentially occur in such galaxies. However, the observations suggest that Type Ia SNe, which are thought to have a long evolutionary delay after the epoch of star-formation, occur in infrared luminous galaxies as well.
A possible explanation for the absence of a strong association between infrared luminous hosts and CC SNe is a selection effect due to obscuration of the SNe. Infrared luminous galaxies in the local Universe appear to be undergoing heavily obscured starbursts with gas column densities corresponding to AV greater than a few magnitudes. CC SNe are fainter than the Type Ia’s (Dahlen & Fransson 1998) and are at the limits of detectability in the deepest optical surveys such as GOODS. The absence of a strong association between the detected core-collapse SNe and LIGs/ULIGs suggests that a large fraction of core-collapse SNe are obscured which the observational selection effects make difficult to overcome. As a result, high-z core-collapse SN rates that have currently been determined are largely underestimated which is also suggested by the analysis of Dahlen et al. (2004).
An intriguing problem is harmonizing the absence of red colors in the light curve of the Type Ia SNe (Riess et al. 2004, Perlmutter et al. 1999) with the 24m detection of the host galaxies. Although higher redshift supernovae show a factor of 2-3 larger scatter in their colors at peak brightness, the average color is still consistent with no-evolution from low redshift. The possibilities to explain this are:
-
•
The dust is grey which does not result in differential reddening between the rest-frame B and V-bands but would systematically dim the supernovae; In this case, the scatter is due to heterogeneity in the intrinsic properties of the SN progenitor.
-
•
The supernova is located at a large spatial offset from the dusty environments which are responsible for the infrared emission;
-
•
Evolution of the color in the SN light curve due to progenitor evolution is serendipitously nullified by dust reddening.
-
•
Introduction of measurement uncertainties since the light curves of the high-z supernovae are standardized based on sparse sampling of the light curve. In addition, an uncertain correction is required to transform Type Ia SN light curves from the observed and -band to rest-frame colors.
We can only evaluate the second of these hypotheses since we have the positions of the SNe within the host galaxies, the resolved colors of the hosts and their infrared luminosities. Such an analysis of a more limited sample of SNe has been performed in the submillimeter previously by Farrah et al. (2004) and Farrah et al. (2002). It would also be useful to compare the colors of the GOODS Type Ia SNe at peak brightness with the detection of 24m flux density of the host galaxy but the colors of the SNe have not yet been published.
Figure 3 shows the spatial offset of the supernovae from the center of their host galaxies as a function of the 24m flux density of the host. We used the GALFIT software (Peng et al. 2002) to fit two-dimensional Sérsic (1968) surface brightness models to the ACS band images of the host galaxies (Ravindranath et al. 2004). GALFIT measures the Sérsic index, which characterizes the shape of the light profile, and the radius (reff) enclosing 50% of the total light. Of the mid-infrared detected hosts, we find that 10/14 of the Type Ia SNe and 9/13 of the CC SNe, are located within the half-light radius of the host galaxy. The median half-light radius (0.5) at the median redshift (0.75) corresponds to projected distances of 4 kpc in the standard cosmology, which is substantially larger than the typical nuclear starbursts. If the 24m emission arises in a nuclear starburst, as in many local infrared luminous galaxies, then the dust may not be relevant for the SN colors.
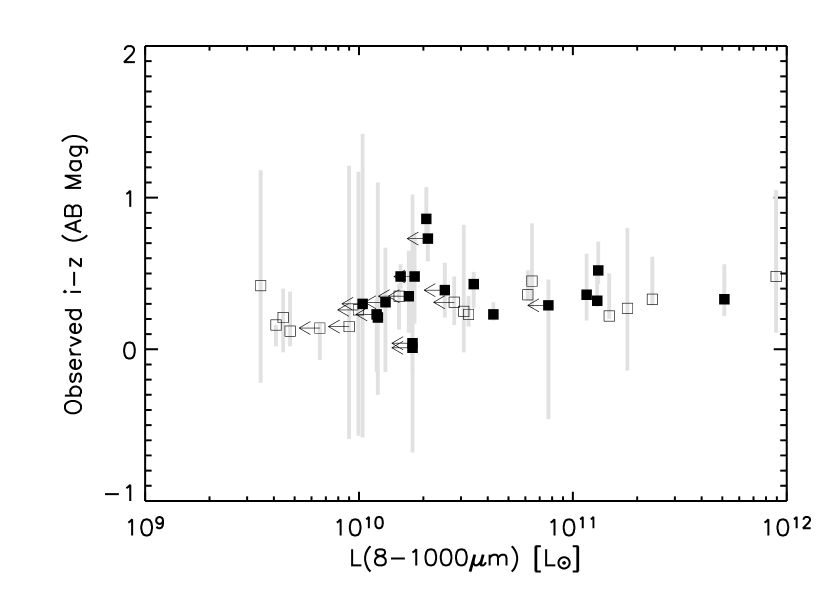
We can use the resolved ACS images of the host galaxies to study the variation of observed pixel colors within the half-light radius, which could reveal the internal distribution of dust (e.g. Hatano et al. 1998, Papovich et al. 2003). For example, if the host galaxies had patchy/nuclear regions of star-formation which are dominating the mid and far-infrared emission, then the internal colors of the galaxy would show a larger scatter than if the dust distribution were smooth. The SNe host galaxies span a wide range of redshifts and we do not have high resolution data in all passbands to sample the same rest-frame colors of all galaxies. Selecting the reddest passbands ( and ) from the GOODS ACS data and only the SNe hosts at , provides a measure of the rest-frame optical colors of the galaxies. By limiting the color measurement to within the half-light radius, we can study the highest S/N area where the color is not affected by the background noise. Figure 4 illustrates the average global color () of the host galaxy and root mean square (rms) variation in the pixel colors of the SN host galaxies plotted against the infrared luminosity. We find that neither the average nor the variation of colors within the host galaxy show any trend with LIR. The global colors as well as the scatter in internal colors of the Type Ia SNe hosts and CC SNe hosts are indistinguishable from each other with a K-S probability of 0.8. Host galaxies that are detected at 24m have significantly redder colors (=0.39 mag) than those of the undetected hosts (=0.28 mag). Rather surprisingly, the patchiness of the dust distribution as measured by the rms of the pixel colors within the half-light radius is 0.1 mag larger for the 24m undetected hosts. The lack of a strong trend between the rest-frame optical/UV colors and the mid-infrared detection implies that the rest-frame optical/UV colors are only a weak indicator of dust distribution within galaxies. However, the fact that the 24m detected galaxies have redder internal colors but smaller scatter suggest that the dust that is responsible for the mid- and far-infrared emission has a smooth distribution.
5 Conclusions
We present deep mid- and far-infrared observations of SNe host galaxies in the GOODS fields. About 60% of the hosts are detected indicating substantial quantities of dust in SNe hosts. The detections span a range of galaxy morphological types, including early-type galaxies. The high detection rate implies that high redshift SNe preferentially occur in dusty galaxies because these objects have undergone a starburst in their recent past which would provide a larger population of SN progenitors. The median derived far-infrared luminosities of these galaxies is about 31010 L☉. This is similar to that of typical dusty star-forming field galaxies. The median bolometric luminosity of Type Ia SNe hosts is very similar to that of core-collapse SNe which is surprising because the latter are thought to preferentially occur in star-forming galaxies. We interpret this as a selection effect since dust obscuration in infrared luminous galaxies would prevent the detection of SNe, particularly the fainter core-collapse SNe, at high redshifts. This indicates that a large fraction of core-collapse SNe at are undetected in deep optical surveys.
The mean and scatter in pixel colors within the hosts is used to constrain the distribution of dust within the galaxies. 24m hosts are redder by 0.1 mag which is inferred to be due to a smooth distribution of dust, translating to an average AV of 0.5 mag. The majority of SNe are located within the half-light radius of their host galaxies where the effect of a smooth dust distribution would be more pronounced. This cannot be reconciled with the absence of reddening in the rest-frame colors of Type Ia SNe. Unfortunately, the SN colors are not measured accurately enough at high redshift to determine the presence of dust along the SN line of sight and optical to near-infrared colors of high-redshift SNe should be measured in future missions which intend to target supernovae as precision cosmological tools.
References
- Aguirre (1999) Aguirre, A., 1999, AJ, 525, 583
- Appleton et al. (2004) Appleton, P., et al., 2004, ApJS, 154, 147
- Blakeslee et al. (2003) Blakeslee, J. P., et al., 2003, ApJ, 589, 693
- Borys et al. (2003) Borys, C., et al., 2003, MNRAS, 344, 385
- Cappellaro et al. (1997) Cappellaro, E., et al., 1997, A&A, 322, 431
- Cappellaro et al. (2000) Cappellaro, E., et al., 2000, IAU Circular no. 7346
- Clements et al. (2004) Clements, D., et al., 2004, New Astronomy, 48, 629
- Clements et al. (2005) Clements, D., et al., 2005, MNRAS, astro-ph/0507642
- Chary & Elbaz (2001) Chary, R., & Elbaz, D., 2001, ApJ, 556, 562 (CE)
- Chary et al. (2005) Chary, R., et al., 2005, ApJ, in preparation
- Dahlen & Fransson (1999) Dahlen, T., & Fransson, C., 1999, 350, 349
- Dahlen et al. (2004) Dahlen, T., et al., 2004, ApJ, 613, 189
- Dale & Helou (2002) Dale, D., & Helou, G., 2002, ApJ, 576, 159
- Dickinson et al. (2005) Dickinson, M. E., et al., 2005, ApJ, in preparation
- Farrah et al. (2002) Farrah, D., et al., 2002, ApJ, 336, 17
- Farrah et al. (2004) Farrah, D., et al., 2004, ApJ, 603, 589
- Giavalisco et al. (2004) Giavalisco, M., et al., 2004, ApJ, 517, 565
- Gilliland et al. (1999) Gilliland, R., et al., 1999, ApJ, 521, 30
- Hauser et al. (1998) Hatano, K., Branch, D., & Deaton, J., 1998, ApJ, 502, 177
- Hauser et al. (1998) Hauser, M., et al., 1998, ApJ, 508, 25
- Houck et al. (2004) Houck, J., et al., 2004, ApJS, 154, 18
- Krause et al. (2003) Krause, O., et al., 2003, A&A, 402, 1
- Li & Draine (2002) Li, A., & Draine, B., 2002, ApJ, 572, 232
- Marcillac et al. (2005) Marcillac, D., et al., 2005, A&A, submitted
- Nobili et al. (2005) Nobili, S., et al., 2005, astro-ph/0504139
- Papovich et al. (2003) Papovich, C., et al., 2003, ApJ, 598, 827
- Peng et al. (2002) Peng, C. Y., et al., 2002, AJ, 124, 266
- Perlmutter et al. (1999) Perlmutter, S., et al., 1999, ApJ, 517, 565
- Pope et al. (2005) Pope, A., et al., 2005, MNRAS, 358, 149
- Ravindranath et al. (2004) Ravindranath, S., et al., 2004, ApJ, 604, L9
- Rieke et al. (2004) Rieke, G. H., et al., 2004, ApJS, 154, 25
- Riess et al. (2001) Riess, A., G., et al., 2001, ApJ, 560, 49
- Riess et al. (2004) Riess, A., G., et al., 2004, ApJ, 607, 665
- Strolger et al. (2004) Strolger, L.-G., et al., 2004, ApJ, 613, 200
- Strolger & Riess (2004) Strolger, L.-G., & Riess, A. G., 2004, IAU Circular no. 8281
- Soifer et al. (1987) Soifer, B. T., et al., 1987, ApJ, 320, 238
- Sullivan et al. (2003) Sullivan, M., et al., 2003, MNRAS, 340, 1057
- Teplitz et al. (2005) Teplitz, H. I., et al., 2005, Proceedings of the Moriond Conference, “When UV meets IR, a History of Star Formation”, in press
- Werner et al. (2004) Werner, M. E., et al., 2004, ApJS, 154, 1


| Name | SN RA | SN DECccThe GOODS-N coordinate system is known to be offset from the world coordinate system by -0.38 arcsec in declination i.e. WCS=GOODS-N. All coordinates presented here have been corrected for this offset. | z | Type | Host RA | Host DECccThe GOODS-N coordinate system is known to be offset from the world coordinate system by -0.38 arcsec in declination i.e. WCS=GOODS-N. All coordinates presented here have been corrected for this offset. | Sν(24) | Sν,err(24) |
|---|---|---|---|---|---|---|---|---|
| (J2000) | (J2000) | Jy | ||||||
| 1997ff | 189.18378 | 62.21242 | 1.65 | Ia | 189.18381 | 62.21245 | 2.46E+01 | 4.51E+00 |
| 1997fg | 189.24039 | 62.22083 | 0.952 | Ia | 189.24030 | 62.22092 | 1.35E+01 | 8.34E+00 |
| 2002dcbbThis SN host is the only one detected in the 850m SCUBA HDF-N supermap with S850=1.700.44 mJy. | 189.20767 | 62.22028 | 0.475 | Ia | 189.20727 | 62.22030 | 3.71E+02 | 1.04E+01 |
| 2002dd | 189.23068 | 62.21281 | 0.95 | Ia | 189.23107 | 62.21277 | 6.77E+01 | 7.09E+00 |
| 2002kh | 189.06992 | 62.24371 | 0.71 | Ia | 189.07024 | 62.24361 | 5.52E+01 | 3.79E+00 |
| 2002ki | 189.36822 | 62.34426 | 1.141 | Ia | 189.36822 | 62.34429 | … | 5.76E+00 |
| 2002kl | 189.45542 | 62.23493 | 0.412 | CC | 189.45532 | 62.23507 | … | 7.08E+00 |
| 2003N | 189.28858 | 62.18346 | 0.425 | CC | 189.28858 | 62.18340 | 1.20E+01 | 5.27E+00 |
| 2003az | 189.33196 | 62.31032 | 1.27 | Ia | 189.33197 | 62.31035 | 1.46E+01 | 6.44E+00 |
| 2003ba | 189.06617 | 62.21037 | 0.286 | CC | 189.06633 | 62.21040 | 3.96E+02 | 6.90E+00 |
| 2003bb | 189.10196 | 62.14304 | 0.955 | CC | 189.10176 | 62.14349 | 6.14E+02 | 1.04E+01 |
| 2003bc | 189.15858 | 62.16471 | 0.511 | CC | 189.15922 | 62.16484 | … | 5.40E+00 |
| 2003bdaaThis SN has no detectable host galaxy at any wavelength in the optical-IR regime. | 189.35442 | 62.22143 | 0.67 | Ia | … | … | … | … |
| 2003be | 189.10821 | 62.11534 | 0.636 | Ia | 189.10832 | 62.11533 | 2.17E+02 | 6.69E+00 |
| 2003dx | 189.13208 | 62.14676 | 0.46 | CC | 189.13200 | 62.14675 | 1.17E+01 | 5.44E+00 |
| 2003dy | 189.28801 | 62.19120 | 1.340 | Ia | 189.28793 | 62.19129 | … | 3.71E+00 |
| 2003dz | 189.16629 | 62.13121 | 0.48 | CC | 189.16636 | 62.13117 | … | 7.01E+00 |
| 2003ea | 189.30017 | 62.21054 | 0.89 | CC | 189.30010 | 62.21055 | … | 6.21E+00 |
| 2003eb | 189.31303 | 62.22599 | 0.899 | Ia | 189.31289 | 62.22620 | 1.74E+01 | 7.09E+00 |
| 2003en | 189.13812 | 62.22985 | 0.54 | Ia | 189.13810 | 62.22982 | … | 9.86E+00 |
| 2003eq | 189.45152 | 62.22641 | 0.839 | Ia | 189.45164 | 62.22638 | 1.48E+02 | 7.28E+00 |
| 2003er | 189.13446 | 62.12634 | 0.63 | CC | 189.13492 | 62.12615 | 1.11E+02 | 5.13E+00 |
| 2003es | 189.23079 | 62.21987 | 0.968 | Ia | 189.23103 | 62.21979 | 2.29E+01 | 7.90E+00 |
| 2003et | 188.98279 | 62.22568 | 0.83 | CC | 188.98275 | 62.22577 | 8.40E+01 | 6.80E+00 |
| 2003eu | 189.02458 | 62.18368 | 0.76 | Ia | 189.02456 | 62.18362 | … | 5.18E+00 |
| 2003ew | 189.11572 | 62.19018 | 0.66 | CC | 189.11586 | 62.19021 | 4.72E+01 | 6.04E+00 |
| 2003lv | 189.37063 | 62.19095 | 0.935 | Ia | 189.37063 | 62.19095 | … | 7.49E+00 |
| Name | SN RA | SN DEC | z | Type | Host RA | Host DEC | Sν(24) | Sν,err(24) |
|---|---|---|---|---|---|---|---|---|
| (J2000) | (J2000) | Jy | ||||||
| 1999gu | 53.25042 | -27.86111 | 0.147 | CC | 53.25078 | -27.86123 | 2.63E+02 | 1.00E+01 |
| 2002fvaaThis SN has no detectable host galaxy at any wavelength in the optical-IR regime. | 53.09471 | -27.85261 | … | CC | … | … | … | 7.00E+00 |
| 2002fw | 53.15635 | -27.77956 | 1.300 | Ia | 53.15649 | -27.77962 | 1.17E+02 | 1.00E+01 |
| 2002fx | 53.02833 | -27.74289 | 1.400 | Ia | 53.02838 | -27.74289 | … | 7.00E+00 |
| 2002fy | 53.07550 | -27.69878 | 0.880 | Ia | 53.07553 | -27.69877 | … | 7.00E+00 |
| 2002fz | 53.20236 | -27.90493 | 0.838 | CC | 53.20200 | -27.90447 | 1.97E+02 | 1.00E+01 |
| 1.73E+02bb16m flux densities of the host galaxies. | 2.66E+01 | |||||||
| 2002ga | 53.13598 | -27.88799 | 0.988 | Ia | 53.13592 | -27.88797 | … | 7.00E+00 |
| 2002hp | 53.10335 | -27.77164 | 1.305 | Ia | 53.10335 | -27.77165 | … | 7.00E+00 |
| 2002hq | 53.12487 | -27.72980 | 0.669 | CC | 53.12512 | -27.72985 | 2.21E+02 | 7.00E+00 |
| 1.85E+02bb16m flux densities of the host galaxies. | 3.43E+01 | |||||||
| 2002hr | 53.09409 | -27.69779 | 0.526 | Ia | 53.09408 | -27.69780 | … | 7.00E+00 |
| 2002hs | 53.07746 | -27.80936 | 0.388 | CC | 53.07740 | -27.80870 | 2.05E+01 | 7.00E+00 |
| 2002ht | 53.03888 | -27.69157 | 0.900 | Ia | 53.03878 | -27.69170 | … | 7.00E+00 |
| 2002kb | 53.17675 | -27.84039 | 0.578 | CC | 53.17680 | -27.84032 | 2.68E+02 | 1.00E+01 |
| 2.13E+02bb16m flux densities of the host galaxies. | 2.63E+01 | |||||||
| 2002kc | 53.14467 | -27.66619 | 0.216 | Ia | 53.14475 | -27.66596 | 9.47E+02 | 1.00E+01 |
| 9.20E+02bb16m flux densities of the host galaxies. | 4.04E+01 | |||||||
| 2002kd | 53.09308 | -27.74081 | 0.735 | Ia | 53.09413 | -27.74051 | 5.74E+02 | 1.00E+01 |
| 3.67E+02bb16m flux densities of the host galaxies. | 3.03E+01 | |||||||
| 2002ke | 52.99488 | -27.75019 | 0.577 | CC | 52.99449 | -27.75010 | 5.91E+01 | 7.00E+00 |
| 2002lg | 53.14904 | -27.79967 | 0.660 | Ia | 53.14896 | -27.79969 | 2.77E+01 | 7.00E+00 |
| 2003aj | 53.18478 | -27.91848 | 1.304 | Ia | 53.18479 | -27.91846 | … | 7.00E+00 |
| 2003ak | 53.19546 | -27.91374 | 1.551 | Ia | 53.19538 | -27.91363 | … | 7.00E+00 |
| 2003al | 53.02250 | -27.74144 | 0.910 | Ia | 53.02251 | -27.74146 | … | 7.00E+00 |
| 2003lt | 53.17838 | -27.93142 | … | … | 53.17833 | -27.93153 | … | 7.00E+00 |
| 2003lu | 53.15050 | -27.91706 | … | … | 53.15036 | -27.91697 | 1.60E+01 | 7.00E+00 |
| 2004R | 53.17208 | -27.77044 | … | … | 53.17210 | -27.77040 | … | 7.00E+00 |
| SN Name | Host i | Host z | reff | Separation | LIRaaInfrared luminosity estimates for blended sources are the derived LIR for the host and companion galaxies as a whole. For sources undetected at 24m, LIR estimates are derived from the 3 upper limit to the 24m flux density. | ||
|---|---|---|---|---|---|---|---|
| mag | mag | L☉ | |||||
| 1997ff | 24.990.11 | 24.040.07 | 0.39 | 0.16 | 1.00 | 0.72 | 1.44E+11 |
| 1997fg | 22.850.05 | 22.540.05 | 0.68 | 0.44 | 0.26 | 0.41 | 1.33E+10 |
| 2002dc | 21.630.05 | 21.270.05 | 0.91 | 0.84 | 0.41 | 0.22 | 1.51E+11 |
| 2002dd | 22.030.05 | 21.740.05 | 0.20 | 0.87 | 0.00 | 0.46 | 7.69E+10 |
| 2002kh | 20.800.05 | 20.370.05 | 0.79 | 1.24 | 0.39 | 0.12 | 3.44E+10 |
| 2002ki | 23.750.06 | 23.270.06 | 0.50 | 0.10 | 0.53 | 0.49 | 2.45E+10 |
| 2002kl | 22.870.05 | 22.730.05 | 0.30 | 0.47 | 0.05 | 0.12 | 6.56E+09 |
| 2003N | 24.040.07 | 23.620.06 | 0.50 | 0.20 | 0.48 | 0.70 | 3.47E+09 |
| 2003az | 25.030.09 | 23.970.06 | 0.69 | 0.10 | 0.94 | 0.94 | 5.10E+10 |
| 2003ba | 19.480.05 | 19.250.05 | 1.53 | 0.20 | 0.25 | 0.10 | 3.26E+10 |
| 2003bb | 20.530.05 | 20.050.05 | 1.84 | 1.37 | 0.58 | 0.47 | 6.02E+11 |
| 2003bc | 21.240.05 | 21.090.05 | 2.39 | 1.23 | 0.31 | 0.90 | 8.99E+09 |
| 2003bd | … | … | … | … | … | … | … |
| 2003be | 20.480.05 | 20.160.05 | 0.98 | 0.12 | 0.40 | 0.12 | 1.30E+11 |
| 2003dx | 22.720.05 | 22.560.05 | 0.27 | 0.18 | 0.09 | 0.07 | 4.09E+09 |
| 2003dy | 23.220.05 | 22.700.05 | 0.37 | 0.43 | 0.42 | 0.18 | 3.67E+10 |
| 2003dz | 24.690.08 | 24.430.08 | 0.39 | 0.25 | 0.30 | 0.87 | 9.94E+09 |
| 2003ea | 23.230.05 | 22.880.05 | 0.39 | 0.15 | 0.28 | 0.15 | 1.03E+10 |
| 2003eb | 22.740.05 | 22.530.05 | 1.00 | 0.90 | 0.40 | 0.70 | 1.23E+10 |
| 2003en | 24.530.06 | 24.490.06 | 0.30 | 0.12 | 0.13 | 0.28 | 1.78E+10 |
| 2003eq | 21.890.05 | 21.370.05 | 0.61 | 0.43 | 0.57 | 0.14 | 1.32E+11 |
| 2003er | 20.390.05 | 20.030.05 | 1.13 | 0.99 | 0.42 | 0.10 | 3.94E+10 |
| 2003es | 22.470.05 | 21.610.05 | 0.65 | 0.57 | 0.91 | 0.16 | 1.52E+10 |
| 2003et | 22.490.05 | 22.040.05 | 0.42 | 0.52 | 0.55 | 0.28 | 6.44E+10 |
| 2003eu | 24.140.08 | 23.840.08 | 0.63 | 0.76 | 0.42 | 1.00 | 9.19E+09 |
| 2003ew | 21.470.05 | 21.160.05 | 0.79 | 0.23 | 0.32 | 0.16 | 2.79E+10 |
| 2003lv | 22.480.05 | 21.750.05 | 0.41 | 0.00 | 0.72 | 0.14 | 1.38E+10 |
| SN Name | Host i | Host z | reff | Separation | LIRaaInfrared luminosity estimates for blended sources are the derived LIR for the host and companion galaxies as a whole. For sources undetected at 24m, LIR estimates are derived from the 3 upper limit to the 24m flux density. | ||
|---|---|---|---|---|---|---|---|
| mag | mag | L☉ | |||||
| 1999gu | 18.570.05 | 18.450.05 | 2.07 | 2.43 | 0.20 | 0.18 | 4.77E+09 |
| 2002fv | … | … | … | … | … | … | … |
| 2002fw | 25.490.13 | 24.890.09 | 0.46 | 0.55 | 0.68 | 1.18 | 5.68E+11 |
| 2002fx | 25.690.12 | 25.210.09 | 0.23 | 0.10 | 0.44 | 0.49 | 1.17E+11 |
| 2002fy | 25.800.08 | 25.450.07 | 0.20 | 0.00 | 0.38 | 0.27 | 1.71E+10 |
| 2002fz | 21.370.05 | 21.040.05 | 0.85 | 2.11 | 0.45 | 0.16 | 2.36E+11 |
| 2002ga | 23.320.05 | 22.930.05 | 0.39 | 0.22 | 0.39 | 0.18 | 2.52E+10 |
| 2002hp | 24.050.05 | 23.060.05 | 0.50 | 0.02 | 0.98 | 0.37 | 8.33E+10 |
| 2002hq | 20.050.05 | 19.780.05 | 3.69 | 0.93 | 0.33 | 0.47 | 1.80E+11 |
| 2002hr | 24.640.05 | 24.410.05 | 0.20 | 0.06 | 0.09 | 0.24 | 1.21E+10 |
| 2002hs | 23.560.05 | 23.350.05 | 0.33 | 2.51 | 0.19 | 0.21 | 4.42E+09 |
| 2002ht | 26.180.14 | 26.170.17 | 0.20 | 0.59 | 0.17 | 0.85 | 1.78E+10 |
| 2002kb | 19.930.05 | 19.710.05 | 1.45 | 0.20 | 0.35 | 0.15 | 1.48E+11 |
| 2002kc | 18.780.05 | 18.550.05 | 1.21 | 0.89 | 0.25 | 0.06 | 4.25E+10 |
| 2002kd | 20.610.05 | 20.280.05 | 1.23 | 3.28 | 0.39 | 0.17 | 5.11E+11 |
| 2002ke | 20.600.05 | 20.350.05 | 1.36 | 1.18 | 0.40 | 0.42 | 3.09E+10 |
| 2002lg | 20.880.05 | 20.400.05 | 0.59 | 0.16 | 0.48 | 0.08 | 1.56E+10 |
| 2003aj | 24.740.06 | 24.060.05 | 0.39 | 0.09 | 0.55 | 0.49 | 8.30E+10 |
| 2003ak | 23.350.05 | 23.060.05 | 0.96 | 0.48 | 0.43 | 0.96 | 1.31E+11 |
| 2003al | 23.450.05 | 22.970.05 | 0.48 | 0.08 | 0.47 | 0.30 | 1.82E+10 |
| 2003lt | 24.580.08 | 24.170.08 | 0.30 | 0.37 | 0.28 | 0.72 | … |
| 2003lu | 20.100.05 | 19.910.05 | 1.55 | 0.57 | 0.21 | 0.16 | … |
| 2004R | 24.170.05 | 23.840.05 | 0.32 | 0.20 | 0.23 | 0.20 | … |