11email: bonnetbidaud@cea.fr 22institutetext: LUTH(CNRS-UMR8102), Observatoire de Paris, Section de Meudon, F-92195 Meudon Cedex, France 33institutetext: APC (CNRS-UMR7164), Université Denis Diderot, 2 Place Jussieu, F-75005 Paris, France
33email: martine.mouchet@obspm.fr 44institutetext: INAF–Osservatorio Astronomico di Capodimonte, Via Moiariello 16, I-80131 Napoli, Italy
44email: demartino@na.astro.it 55institutetext: Observatoire Astronomique de Strasbourg, F-67000 Strasbourg, France
55email: motch@astro.u-strasbg.fr
RX J2133.7+5107 : Identification of a new long period Intermediate Polar ††thanks: Based on observations obtained at the Haute-Provence Observatory (France) and at the Loiano Observatory (Italy), operated by the Istituto Nazionale di Astrofisica ††thanks: Tables 2 and 3 and Figures 4-5-6 are only available in electronic form at http://www.edpsciences.org
We report the first time-resolved photometric and spectroscopic optical observations of the X-ray source RX J2133.7+5107, identified in the ROSAT survey. A clear persistent optical light pulsation is discovered with fast photometry at a period of =(570.8230.013) s which we associate with the spin period of an accreting white dwarf. Radial velocity curves of the strong emission lines show modulation with a period of =(7.1930.016) hr, identified as the orbital period. These observations establish that the source is a member of the intermediate polar class (IPs) of magnetic cataclysmic variables. With only 4 IPs with longer orbital periods, RX J2133.7+5107 is among the widest systems. It is a unique IP with an orbital period in the middle of the so-called (6-10)hr IP gap and it shows a significant degree of asynchronism with a ratio / of 0.02. When attributed to the motion of the white dwarf, the emission lines orbital modulation yields a mass function of fm = (1.050.21) which, for a probable inclination and a white dwarf mass , corresponds to a secondary mass .
Key Words.:
stars:binaries:close – stars:individual:RX J2133.7+5107– stars:novae, cataclysmic variables1 Introduction
The X-ray source RX J2133.7+5107 was discovered from the ROSAT Galactic Plane Survey and identified as a relatively bright (mB 16) cataclysmic variable (CV) (Motch et al. 1998, hereafter M98). Its X-ray hardness ratios indicate a hard X-ray source, similar to the intermediate polar (IPs) class among cataclysmic variables (CVs). IPs are Magnetic Cataclysmic Variables (MCVs), where a white dwarf (WD) with a relatively strong ( 5-10 MG) magnetic field accretes material from a late-type secondary companion overflowing its Roche-lobe. The accretion flow is channelled towards the polar regions where a strong shock develops above the WD surface (see Patterson (1994) for a review), which means that the signature of channelled accretion in these systems is a strong pulsation at the WD rotational period. In an effort to elucidate the nature of RX J2133.7+5107, we obtained optical observations to search for a signature of the WD rotation and its orbital motion.
2 Photometric observations
RX J2133.7+5107 was observed from August 23th to 26th, 2003 at the 1.5 m Loiano telescope (Bologna, Italy) equipped with the three channel photometer (TTCP) with simultaneous acquisition of target, comparison star, and sky. Observations were done without filter with a photometer efficiency peaking around 3800 Å and a spectral range of 3000-6000 Å (Silvotti et al. 2000). The integration time was set to 30 s in all observations. Sky conditions were photometric with a seeing of 1.5″ during all nights, except on August 24 (seeing of 2″ ) when observations were also interrupted due to bad sky conditions for 1.3 hr. A diaphragm of 17″ was used for all three channels. RX J2133.7+5107 was estimated at B16 mag using a nearby comparison star. The log of the observations is reported in Table 1. The photometric data were reduced using standard procedures including sky subtraction, extinction correction, and relative photometry. The resulting light curve is shown in Fig 1.
| Observations | Range | Res. | Date | UT(start) | Exposure (min) |
|---|---|---|---|---|---|
| Photometry | White light | 30 s | 2003 Aug. 23 | 21:15 | 362 |
| White light | 30 s | 2003 Aug. 24 | 20:09 | 167 | |
| White light | 30 s | 2003 Aug. 25 | 00:17 | 172 | |
| White light | 30 s | 2003 Aug. 26 | 19:57 | 439 | |
| Spectroscopy | 3600-7200 | 5.7 Å | 1998 Aug. 24 | 20:35 | 165 |
| 3600-7200 | 5.7 Å | 1998 Aug. 26 | 20:53 | 210 | |
| 4300-6000 | 2.8 Å | 2004 Jul. 20 | 20:39 | 270 | |
| 4300-6000 | 2.8 Å | 2004 Jul. 21 | 21:08 | 270 | |
| 4300-6000 | 2.8 Å | 2004 Jul. 22 | 20:34 | 300 |

The photometric time series were analyzed performing a Discrete Fourier Transform (DFT) of the relative amplitudes, after detrending from the low frequency underlying variations. A significant power was present in two groups of frequencies inside the overall range (140-160) day-1 (see Fig. 2). This structure closely resembles the one observed in the optical power spectra of many IPs with the presence of the spin frequency () and its orbital sideband (), where is the orbital frequency. The same structure was also found, though with much lower intensity, at twice these frequencies, which are identified as the first harmonics (see Fig. 2, top panels). Given the strong influence of the data window, a number of aliases were also introduced that prevent any clear identification of the true peaks. To remove this effect, we used the CLEAN algorithm (Roberts et al. (1987)), and results are also shown in Fig. 2 (right panels). The most significant peaks were found at = 151.30.1 day-1 with its orbital sideband at = 148.00.1 day-1 and harmonics at 2 = 302.60.1 day-1, where the error bars were determined from the peaks’half widths. The fundamental and the first harmonic of the spin match strictly, while for the beat frequency, the weak peak observed at 296.60.1 day-1, is slightly offset from the expected beat harmonic () frequency. This discrepancy is most likely due to the very small amplitude (full amplitude 0.8) and imperfect removal of the data window effect.

As the presence of a sideband beat period may significantly affect the period determination, the detrended data were fitted with a four frequency sinusoidal function that includes the fundamental and first harmonic of the spin and beat periods. The best periods were then found at : = 570.82270.013 s and = 583.7680.02 s. This fit was used to derive the best spin ephemeris for RX J2133.7+5107 as:
| (1) |
where is the heliocentric arrival time of the sine curve maximum. A quadratic fit on the (O-C) residuals does not yield a significant period derivative with an upper limit 2.0 10-6 s/s.
We checked the consistency by producing a synthetic DFT of the composite sinusoidal function, including the four most significant frequencies above. Results are shown in Fig 2 (central panels). The good agreement between the observed and synthetic spectrum confirms that the spin and beat modulations have been determined accurately. The data, pre-whitened from the low frequency trend, were folded at the derived spin period and the pulse shape is shown in Fig 3. The pulse has a full amplitude of 8 and a quasi-sinusoidal shape with a less steep rise than the decay, indicative of the presence of the first harmonic.

From the photometric data, the measured beat frequency yields an orbital frequency of = (3.3570.006) day-1 corresponding to = 7.1500.015 hr, in agreement with the orbital period found from spectroscopy (see below). The limited number of nights and the probable contamination from a likely non-periodic variability do not allow a more precise determination of the orbital period.
3 Spectroscopic observations
RX J2133.7+5107 was observed at the Observatoire de Haute Provence (France) at two epochs in August 1998 and in July 2004 (see Table 1). Long slit spectra were obtained with the Carelec spectrograph (Lemaitre et al. 1990) attached to the Cassegrain focus of the 193 cm telescope and using a CCD EEV (2048x1024 pixels) detector of 13.5m pixel size. In 1998, the 133 Å/mm grating was used, with a slit width of 2″ , leading to a wavelength coverage of 3600-7200 Å at an FWHM resolution of 5.7 Å. In 2004, spectra were obtained with the 67 Å/mm grating and a slit of 2″ width, covering the range 4300-6000 Å at a resolution of 2.8 Å. Exposure times were either 15 min or 30 min in 1998, and 30 min in 2004. In 1998, clouds were present on the last night (26 Aug). For both nights, the seeing was greater (3-5") than the slit (2″ ). In 2004, observations were obtained in nearly photometric conditions with only thin cirrus during the last night (22 Jul). Seeing was typically of 2.5″ to 3″ .
Standard reduction was performed in the ESO-MIDAS package, including cosmic removal, bias subtraction, flat-field correction, and wavelength calibration. The wavelength calibration was checked on sky lines that were found within 1.6 Å and 0.7 Å from their expected wavelengths in 1998 and 2004, respectively. All radial velocity measurements were corrected from the Earth motion and from the small instrumental shifts measured on the OI 5577 Å line and times were converted in the heliocentric system. Flux calibration was performed using the standards BD+28 4211 and BD+33 2642.
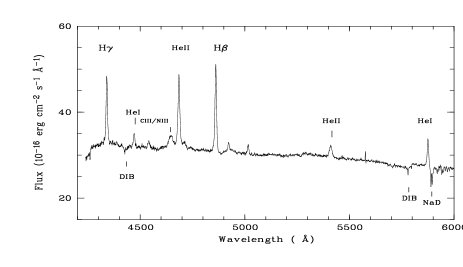
The mean optical spectrum of RX J2133.7+5107 (Fig. 4) is typical of magnetic CVs with strong emission lines of the Balmer series, HeII (4686Å and 5411Å) and CIII-NIII (4655Å), superposed on a relatively blue continuum. In 2004, when the flux calibration was reliable, the mean B flux was estimated at , which corresponds to a B magnitude of 15.8, similar to what was reported in the identification paper by M98. The characteristics of the main emission lines are given in Table 2. Similar equivalent widths were observed in the two observations in 1998 and 2004, but the intensities of the lines change by a factor 2.
| Line | EW(Å) | FWHM(Å) | Flux(*) | EW(Å) | FWHM(Å) | Flux(*) |
| August 1998 | July 2004 | |||||
| Hδ | 2.9(3) | 7.2 | 56 | - | - | - |
| Hγ | 3.9(2) | 7.5 | 73 | 4.2(2) | 7.3 | 136 |
| HeI 4471 | 1.0(1) | 7.5 | 17 | 0.9(1) | 6.2 | 30 |
| CIII-NIII(+) | 2.0(1) | 21.3 | 36 | 2.3(2) | 26.9 | 71 |
| HeII 4686(+) | 5.9(1) | 10.6 | 110 | 5.7(2) | 10.5 | 182 |
| Hβ | 6.1(3) | 8.5 | 109 | 6.4(3) | 8.0 | 201 |
| HeII 5411 | 1.5(3) | 12.8 | 23 | 1.4(2) | 15.2 | 42 |
| HeI 5875(+) | 2(2) | 8.1 | 32 | 2.0(2) | 7.9 | 55 |
| Hα | 16.5(4) | 10.7 | 252 | - | - | - |
| Errors bars on last digit in parentheses. | ||||||
| FWHM: corrected for instrumental resolution (typical errors of 0.6Å in 1998 and 0.3Å in 2004) | ||||||
| * Line flux in units of are indicative because of marginal photometric conditions | ||||||
| + Measurements derived from Gaussian fits. | ||||||
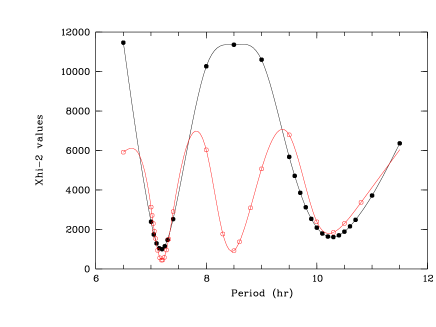
The radial velocities were measured for the main lines. They showed a significant modulation of (30-70) amplitudes that were analysed to constrain the orbital period. The exposure of the individual spectra (30 min.) were close to a multiple of the spin period so that no strong influence from the spin modulation was expected, but the period search was significantly affected by the 1-day sampling of the observation. The best period was determined from an periodogram where the radial velocity measurements were folded at trial periods and tested against a sine modulation. The most accurate determination was obtained for the strongest line (Hβ ) in the longest observation of 2004 (Fig 5). The minimum corresponds to a period of =7.1930.016 hr, where the error bar is at a 99% level, computed for two independent parameters. A secondary minimum, also observed at 10.3 hr, is a 1-day alias that can be excluded at a level better than 3. from an F-test. A similar value was obtained independently in 1998 by making use of the velocities of the strongest Hα line, but the accuracy on the period value does not allow us to keep track of the phase between the two observations, so the orbital period cannot be refined. The orbital ephemeris for RX J2133.7+5107 is determined as :
| (2) |
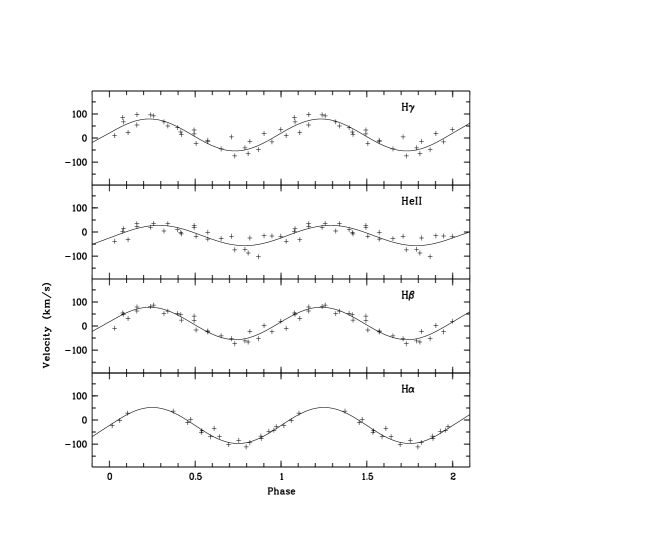
where is the predicted heliocentric time of the blue-to-red radial velocity transition. The radial velocities of the main lines, folded at the best orbital ephemeris above, are shown in Fig. 6, and the parameters of the corresponding best sine fits are given in Table 3. Data are from the 2004 observations obtained with the highest spectral resolution, except for Hα, which was only observed in 1998. For this last line , the orbital phase was arbitrarily shifted, as the ephemeris were not accurate enough to link the 1998 data. The Balmer lines showed similar 70 velocity amplitudes, while the HeII lines displayed lower value with no significant phase shift. Inspection of the line intensities, EW, and widths folded at the orbital period do not reveal significant modulation, except for a very small variation in width for Hγ and Hβ .
| Lines | ( ) | K ( ) | Phase (*) |
| Hγ | + 12.7 (1.4) | 66.5 (2.0) | 0.003 (0.030) |
| Hβ | + 10.6 (0.4) | 67.4 (0.6) | 0.000 (0.009) |
| HeII( 4686 Å) | - 14.7 (0.9) | 42.2 (1.2) | 0.024 (0.029) |
| HeII( 5411 Å) | - 34.2 (5.2) | 33.5 (7.4) | 0.021 (0.220) |
| Hα | - 22.8 (0.4) | 74.8 (0.6) | 0.0 (fixed) |
| * Phase of the blue-to-red zero crossing | |||
| 1- error bars into parentheses | |||
4 Discussion
The optical characteristics of RX J2133.7+5107 clearly point toward an IP nature of the source. Photometric data show a clear, persistent 571 s period, which we interpret as the spin period of the accreting white dwarf. The presence of a spin first harmonic and the detected beat periodicity consistent with a 7.2 hr orbital period are features common to many IPs systems, signaling a probable two-pole accretion with significant reprocessing inside the binary system (see Warner (1995), Buckley (2000)). The orbital period is confirmed independently by modulation of the emission lines, which yields a more precise value of P = (7.1930.016) hr. This is among the longest orbital periods found in intermediate polars as, out of 40 systems, only four confirmed IPs (AE Aqr, V1062 Tau, RX J1548-4528 and GK Per) known so far have wider orbits (Norton et al. (2004)).
With a longer period than 7 hr, a secondary of a relatively early type (up to K0) can be expected. Such stars usually show a significant sodium line Na D (5889-5896Å) in absorption. This line is indeed detected in the spectrum of RX J2133.7+5107 , partly blended with the HeI (5875Å) line, at the resolution used in our observations (see Fig. 4). However the Na D line observed in RX J2133.7+5107 is at least partly interstellar, indicative of both significant distance and absorption. This is confirmed by the presence in the spectrum of the diffuse bands at DIB(4430) and DIB(5780) similar to what is observed in some other CVs (see Thorstensen & Taylor (2001)). The equivalent widths of the (4430) and (5780) DIBs are measured at 0.7Å and 0.3Å respectively, and are both consistent with a reddenning of (Herbig (1975), Snow et al. (2002)). If purely interstellar, the Na D1 (5890) component would have indicated a much higher reddenning of (Munari & Zwitter (1997)), inconsistent with the above value and indicating that the secondary also contributes to the line. From the measured equivalent widths, the star contribution can be estimated to be less than 50 %.
The Na D equivalent widths were measured on representative stars from the Jacoby et al. (1984) catalogue with spectral types from K0 to M0 and compared to the EW upper limit measured in RX J2133.7+5107. If the secondary contributes for less than half of the observed Na D, the contribution of a K0, K5, or M0 star to the optical flux is respectively less than 39%, 37%, and 9%, which translates into a lower limit to their distance of 1200, 650, and 600 pc respectively, assuming standard absolute magnitudes (Allen 1970). X-ray observations of the source by ROSAT do not give better indications of absorption and distance. From the observed ROSAT hardness ratios and the measured value HR1=0.900.06 (M98), using the HR1-NH distribution for CVs in Fig.4 (M98) gives a rough estimation of NH with, however, a large uncertainty. The measured ROSAT flux and the count conversion given in M98 yield a [0.1-2.4 keV] luminosity of Lx (d/500pc)2 .
A complementary constraint on the system can also be obtained from the velocity amplitude of the emission lines, if they are assumed to be associated with the white dwarf. The mean velocity of the Balmer lines yields a mass function of fm = (1.050.21) . For an inclination of , suggested by the absence of double-peaked lines, and a white dwarf mass , , the secondary mass is , consistent with a star at least more massive than M2V.
The relatively long orbital period of RX J2133.7+5107 makes it fall into what has been called the ”IP gap” (Schenker et al. (2004)), a lack of IPs into the (6-10) hr orbital period interval. From the list of 39 IPs in Norton et al. (2004), all are either shorter than 6.14 hr or longer than 9.87 hr, this last value being the one newly determined for 1RXS J1548-4528 by de Martino et al. (2005). Though it could still be due to an observational bias, this may indicate a particular state of evolution.
With a spin-to-orbit period ratio of 0.02, RX J2133.7+5107 is also a relatively highly asynchronous system with only 8 IPs showing lower values. This suggests a young system still far from equilibrium. For magnetic CVs, Norton et al. (2004) have computed the equilibrium rate when the spin-up accretion torque is balanced by the braking effect of the magnetic torque, using a detailed plasma-magnetic field interaction. For a value of = 0.02 and an orbital period of 7.2hr, the equilibrium is reached for a magnetic moment of G.cm3, here assuming a mass ratio , but the variation is less than 10% for q in the range 0.3 q 0.7. The magnetic moment is probably much lower in RX J2133.7+5107 , since accretion will only take place if the Alven radius (rm) is lower than the corotation radius (rco) (see Warner (1995)). For RX J2133.7+5107 , rco = cm (for in the range (0.6-1.0) ). For G.cm3, the (rm rco) condition will require an accretion rate that is higher than (2.8-3.5) g.s-1, so much too high for the observed X-ray luminosity. Assuming a more canonical value of g.s-1, the magnetic moment then has to be lower than (1.2-1.9) G.cm3; therefore RX J2133.7+5107 is most probably an IP with a weak magnetic field. A definite confirmation of its IP nature will be possible with the detection of strong X-ray pulses expected at the 571 s period.
References
- Buckley (2000) Buckley D., 2000, News Astr. Rev. 44, 63
- (2) de Martino D., Mouchet M., Bonnet-Bidaud J.M., Haberl F., 2005, in ”The Astrophysics of Cataclysmic Variables and Related Objects”, Strasbourg, to be published in the ASP conference series.
- Herbig (1975) Herbig G.H., 1975, ApJ 196, 129
- Jacoby et al. (1984) Jacoby G., Hunter D., Christian C., 1984, ApJ Suppl. Ser. 56, 257
- (5) Lemaitre G., Kohler P., Lacroix D., Meunier J.P., Vin A., 1990, A&A 228, 546L
- (6) Motch C., Guillout P., Haberl F. et al., 1998, A&A Suppl. Ser. 132, 341 (M98)
- Munari & Zwitter (1997) Munari U., Zwitter T., 1997, A&A 318, 269
- Norton et al. (2004) Norton A., Wynn G., Somerscales R., 2004, ApJ 614, 349
- (9) Patterson, J. 1994, PASP, 106, 209
- Roberts et al. (1987) Roberts, D. H., Lehar, J., Dreher, J. W., 1987, AJ 93, 968
- Schenker et al. (2004) Schenker K., Wynn G., Speith R., 2004, IAU Colloqium 190, ASP Conf Ser. vol. 315, p.8
- (12) Silvotti,R., Vittone A., de Martino D.: 2000, Mem.SAIt, 71, p.1109
- Snow et al. (2002) Snow T.P., Zukowski D., Massey P., 2002, ApJ 578, 877
- Thorstensen & Taylor (2001) Thorstensen J., Taylor C., 2001, MNRAS, 326, 1235
- Warner (1995) Warner B., 1995, in ”Cataclysmic variable stars”, Camb. Univ. Press