An Infrared Imaging Survey of the Faint Chandra Sources near the Galactic Centre
Abstract
We present near-IR imaging of a sample of the faint, hard X-ray sources discovered in the 2001 Chandra ACIS-I survey towards the Galactic Centre (GC) (Wang et al. 2002). These 800 discrete sources represent an important and previously undetected population within the Galaxy. From our VLT observations of 77 X-ray sources, we identify candidate -band counterparts to 75% of the Chandra sources in our sample. The near-IR magnitudes and colours of the majority of candidate counterparts are consistent with highly reddened stars, indicating that most of the Chandra sources are likely to be accreting binaries at or near the GC.
keywords:
binaries: close – infrared: stars – X-rays: stars – stars: mass loss1 The Chandra Galactic Centre Survey
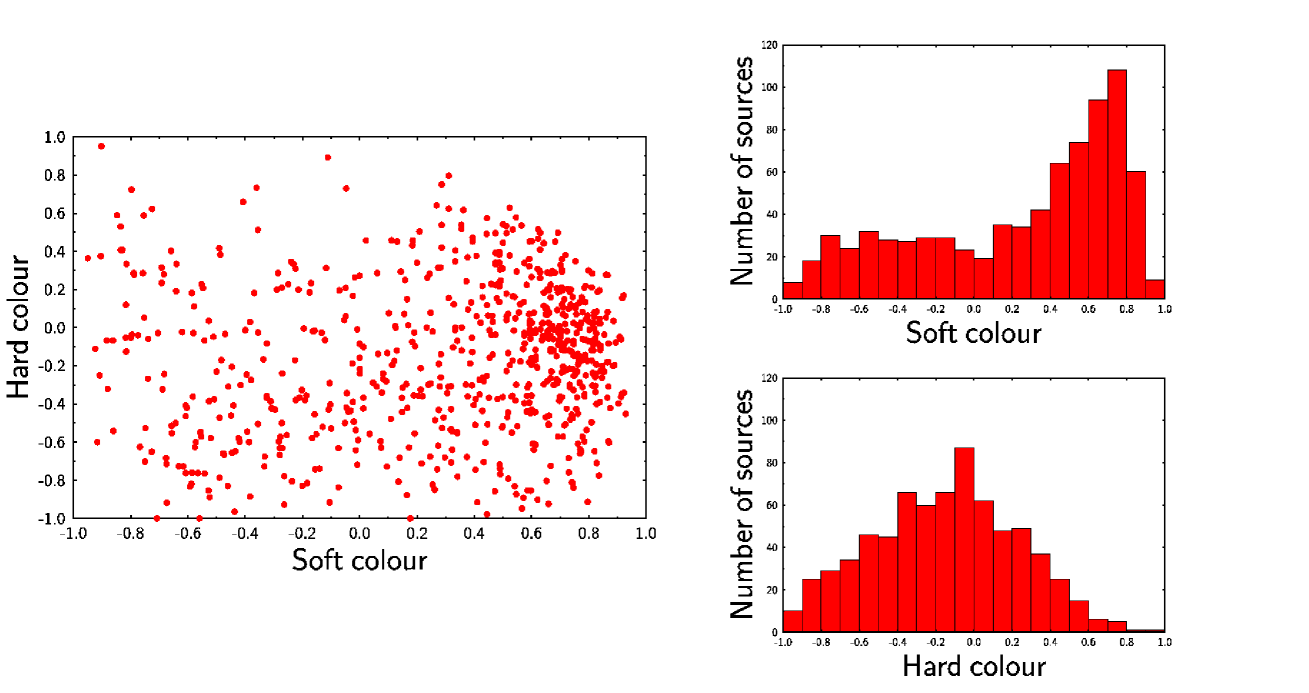
The origin and contribution of diffuse and discrete X-ray sources to the X-ray spectrum and the total X-ray luminosity of the Galactic Plane have been a point of debate for decades. The unprecedented sensitivity and angular resolution of the Chandra X-ray Observatory has been utilized by Wang et al. (2002; hereafter W02) and Muno et al. (2003) to investigate the nature of this Galactic Centre (GC) X-ray emission. The W02 ACIS-I survey of the central 0.8∘2∘of the GC revealed a large population of previously undiscovered discrete weak sources with X-ray luminosities of erg s-1. The nature of these 800 newly detected sources, which may contribute 10% of the total X-ray emission of the GC, is as yet unknown. In contrast to the populations of faint AGN discovered from deep X-ray imaging out of the Galactic Plane, our calculations suggest that the extragalactic contribution to the hard point source population over the entire W02 survey is 10%, consistent with the function derived from the Chandra Deep Field data (CDF; Brandt et al. 2001). The harder (3 keV) X-ray sources (for which the softer X-rays have been absorbed by the interstellar medium) are likely to be at or beyond the distance of the GC, while the softer sources are likely to be foreground X-ray active stars or cataclysmic variables (CVs) within a few kpc of the Sun. The distribution of X-ray colours (Fig. 1) suggests that 30% of the Chandra sources are foreground objects; a more detailed discussion of the X-ray source characteristics will be presented in Muno, Bauer, & Bandyopadhyay, (in prep).
Pfahl et al. (2002; hereafter PRP02) considered in detail the likely nature of these Chandra sources and concluded on the basis of binary population synthesis (BPS) models that many, if not the majority, of these systems are wind-accreting neutron star binary systems (hereafter WNS). Depending on the masses of the companions, the WNSs may belong to the “missing” population of wind-accreting Be/X-ray transients in quiescence, or to the progenitors of intermediate-mass X-ray binaries (IMXBs; 3/7). The existence of tens of thousands of quiescent Be/XRBs in the Galaxy has been predicted since the early 1980s (Rappaport & van den Heuvel 1982; Meurs & van den Heuvel 1989), while it has only recently been recognized that IMXBs may constitute a very important class of XRBs that had not been considered before (King & Ritter 1999; Podsiadlowski & Rappaport 2000; Podsiadlowski et al. 2002). In a detailed population synthesis study of low- and intermediate-mass XRBs (L/IMXBs), Pfahl et al. (2003) found that 80-95 % of all L/IMXBs should in fact descend from intermediate-mass systems. The W02 Chandra survey may contain up to 10% of the entire Galactic population of WNSs. In addition to the WNSs, a fraction of the Chandra sources could be CVs (Ebisawa et al. 2005) or transient low-mass XRBs/black-hole binaries (PRP02; Belczynski & Taam 2004).
The first step in determining the nature of this population is to identify counterparts to the X-ray sources. These observations must necessarily be done in the infrared due to the high optical extinction in the direction of the GC. The successful achievement of our goals requires astrometric accuracy and high angular resolution to overcome the confusion limit of the crowded GC. The 2MASS survey has a limiting magnitude of =14.3, and although the astrometric positions are accurate to 0.2″, the survey has a spatial resolution of 2″. As such, the 2MASS data are severely confusion limited in the GC and moreover are of insufficient depth to detect the majority of the expected counterparts. We therefore constructed a survey program using the ISAAC IR camera on one of the 8-metre telescopes of the Very Large Telescope (VLT) at the European Southern Observatory (ESO) in Chile, with the goal of obtaining high-resolution -band images in order to identify a statistically significant number of counterparts to the X-ray sources on the basis of the Chandra astrometry.
2 IR Observations and Data Analysis
In constructing our VLT/ISAAC program, we preferentially selected hard X-ray sources from the Chandra survey, as the soft sources are most likely to be foreground. For the early-type donors of the WNSs, we expect intrinsic magnitudes of =11–16, with the peak of the magnitude distribution at 14 (PRP02); these are therefore readily distinguishable from the majority of late-type donors expected in low-mass black hole or neutron star transient XRBs which generally have 16 in quiescence. The average extinction towards the GC was expected to be 2–3 (Blum et al. 1996, hereafter B96; Cotera et al. 2000; Dutra et al. 2003); therefore by imaging to a magnitude limit of =20 we should detect most of the WNSs. At this limit we could also expect to identify some counterparts to the hard X-ray sources as AGN. However, there are no AGN with 17 in the Chandra survey of the Hubble Deep Field North of Hornschemeier et al. (2001). Although we cannot rule out the possibility of detecting AGN with 17, we expect these to be rare; therefore in most cases we expect AGN to be distinguishable from the WNSs, although further observations may be required to separate AGN from low-mass XRB counterparts. We further note that our IR observations indicate that there are patches in the observed fields where the extinction even in is substantially larger than average (as high as ; see e.g. B96), significantly reducing our detection sensitivity in the corresponding regions (see Section 3; a more detailed discussion of the GC extinction is presented in Gosling, Blundell, & Bandyopadhyay, submitted).
In 2003, we imaged 26 fields within the Chandra survey region with the VLT, containing a total of 77 X-ray point sources. We utilized ISAAC’s 10241024 pixel Hawaii Rockwell detector, which provides a 2.52.5 arcmin field of view at a resolution of 0.1484″ per pixel. Images were obtained with 0.6″ seeing. For each field, four 90-second exposures were obtained per filter, with random offsets of ″ between each exposure (using a standard ISAAC jitter template). Thus with a total of 6 minutes integration time per filter, the limiting magnitudes of our survey are =23 (S/N=5), =21, and =20 (S/N=10).
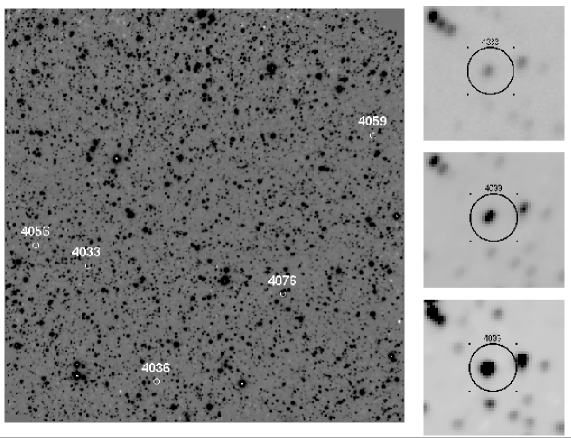
The initial reduction of the images (including flat-fielding, removal of bad pixels, and sky subtraction) was performed using the ESO/ISAAC pipeline software. We then astrometrically locked the ISAAC images to the corresponding 2MASS images, resulting in an astrometric accuracy of 0.2″ for the VLT images. IR source positions and magnitudes were derived using the SExtractor package (version 2.3.2), which performs well in fields which are crowded but not confusion-limited, such as our ISAAC images (see the SExtractor manual for futher details: http://terapix.iap.fr/IMG/pdf/sextractor.pdf). Owing to the crowding in the field, a Mexican hat smoothing kernel of FWHM 2.5 pixels was used over a pixel grid, with the “filtering” option activated. This option smooths the image before doing the candidate source detection, resulting in a gain in the ability to detect sources within crowded fields. After extensive trials to optimize detection of faint sources, the detection threshold was set to per pixel above the local background (sufficiently low to ensure we detected even the faintest sources), with a minimum area of 3 pixels (with all 3 greater than ) required for a detection. The resultant source positions were then overlaid on the IR images, each of which was inspected by eye to ensure that the SExtractor positions corresponded to real sources in the field. In particular, the areas around the Chandra error circles were carefully inspected so that we were certain that none of the SExtractor-derived positions were spurious, but were indeed consistent with clearly visible IR sources.
Finally, we re-analyzed the W02 Chandra data to estimate the astrometric accuracy of the X-ray source positions. While the average “out-of-the-box” absolute astrometric accuracy for Chandra from the pipeline data processing is 0.6″, we note that individual pointings can be off by up to several arcseconds (we have no way of knowing how good the Chandra accuracy is a priori). Unfortunately, because of the small number of X-ray sources per Chandra pointing with identified optical/IR counterparts (usually X-ray/2MASS matches per pointing, which is insufficient to improve the Chandra pipeline astrometry) and the typical faintness of optical counterparts to Galactic X-ray sources such as expected here, we cannot establish the absolute astrometry for each tile of the survey; in fact it is even difficult to do so for the survey as a whole.
We refined the astrometric solution for the W02 mosaic by locking it to three significantly deeper single-pointing observations in the Chandra archive (each 17′17′) made within the survey region: these fields are Sgr A* (Muno et al. (2003), Sgr B2, and the Arches Cluster. The Sgr A* field astrometry was originally derived using three foreground stars, and later refined by matching 36 X-ray sources within 5′ of the field centre to foreground stars in the 2MASS catalog (Muno et al. 2005). For the Sgr B2 and Arches fields, the astrometry was established using 10 X-ray/2MASS matches found within 5′ of the field centre (Muno, Bauer, & Bandyopadhyay, 2005, in prep). Starting with the fields adjacent to the deep exposures and moving outward, we derived the astrometry of the W02 mosaic by matching X-ray source positions (obtained using the Chandra wavdetect routine) in each pointing to those of adjacent pointings. However, the positional accuracy of Chandra X-ray sources varies strongly as a function of both off-axis angle and source counts. Given that most of the matches between pointings made using this method were done with X-ray sources detected 6′ off-axis, the statistical uncertainty of the wavdetect positions of each source is significant. Thus the corrected astrometry is not substantially more accurate than the default pipeline values, with systematic errors of up to 1″. We therefore conservatively use an astrometric accuracy of 1″ for the X-ray source positions in the W02 mosaic. For those Chandra sources with IR stars within a 1.3″ radius error circle (see Section 3), the average X-ray/IR offset is 0.77″, consistent with our assumed Chandra astrometric accuracy.
3 Results: IR Characteristics
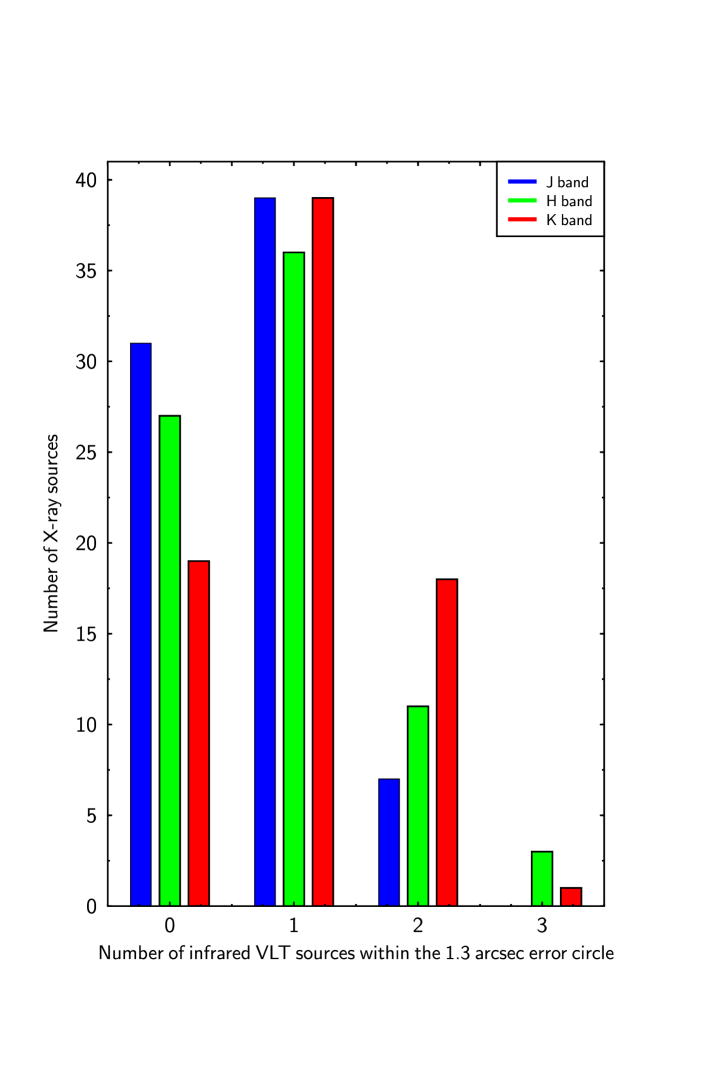
For 75% of the X-ray sources in our VLT fields, there are one or two resolved -band sources within a 1.3″ error circle; only a small number of X-ray sources have more than two potential counterparts (Fig. 2); a complete list of all candidate IR counterparts is presented in Table 1. We use a radius of 1.3″ to account for the 1″ astrometric uncertainty of the Chandra data plus the uncertainty in the IR astrometry. As the ISAAC pixel size is ″, in order to entirely cover the IR astrometric uncertainty of 0.2″ it was necessary to expand the error radius by an integer number of pixels, resulting in an additional 0.3″ (2 pixels) being added to the 1″ X-ray error circle. Over 40% of the Chandra sources have no potential -band counterparts, and only a few of the potential IR counterparts have colours consistent with unreddened foreground stars (Figs. 3 and 4). This is consistent with the expectation that the majority of the detected X-ray sources are heavily absorbed and thus are at or beyond the GC.
| Chandra X-ray source | -band | candidatea | Chandra X-ray source | -band | candidatea |
|---|---|---|---|---|---|
| RA (J2000) | Dec (J2000) | RA (J2000) | Dec (J2000) | ||
| CXOUJ174521.9-290519 | 17 45 21.9 | -29 05 19 | CXOUJ174536.5-284122 | 17 45 36.6 | -28 41 21 |
| CXOUJ174518.2-290405 | 17 45 18.2 | -29 04 04 | CXOUJ174454.2-285841 | 17 44 54.2 | -28 58 42 |
| 17 45 18.2 | -29 04 06 | CXOUJ174534.1-291327 | 17 45 34.1 | -29 13 27 | |
| CXOUJ174517.2-290439 | 17 45 17.2 | -29 04 40 | CXOUJ174457.3-290614 | 17 44 57.4 | -29 06 14 |
| 17 45 17.2 | -29 04 39 | 17 44 57.3 | -29 06 13 | ||
| CXOUJ174517.3-290625 | 17 45 17.3 | -29 06 25 | CXOUJ174455.2-290417 | 17 44 55.2 | -29 04 17 |
| CXOUJ174503.8-290051 | 17 45 03.8 | -29 00 50 | 17 44 55.2 | -29 04 16 | |
| CXOUJ174608.2-290622 | 17 46 08.2 | -29 06 23 | CXOUJ174449.9-291327 | 17 44 49.9 | -29 13 27 |
| CXOUJ174559.5-290601 | 17 45 59.5 | -29 06 02 | CXOUJ174428.7-285651 | 17 44 28.7 | -28 56 52 |
| CXOUJ174521.9-290617 | 17 45 21.9 | -29 06 16 | 17 44 28.8 | -28 56 51 | |
| CXOUJ174516.8-290541 | 17 45 16.8 | -29 05 42 | CXOUJ174459.8-291941 | 17 44 59.8 | -29 19 41 |
| CXOUJ174458.1-290509 | 17 44 58.0 | -29 05 10 | CXOUJ174457.6-292028 | 17 44 57.7 | -29 20 28 |
| 17 44 58.1 | -29 05 09 | CXOUJ174515.8-291723 | 17 45 15.8 | -29 17 22 | |
| CXOUJ174459.9-290418 | 17 44 59.9 | -29 04 18 | CXOUJ174501.4-291933 | 17 45 01.4 | -29 19 34 |
| 17 44 59.9 | -29 04 19 | CXOUJ174450.9-291849 | 17 44 50.9 | -29 18 49 | |
| CXOUJ174459.3-290050 | 17 44 59.2 | -29 00 51 | CXOUJ174429.1-291946 | 17 44 29.0 | -29 19 46 |
| 17 44 59.3 | -29 00 50 | CXOUJ174414.3-292610 | 17 44 14.4 | -29 26 11 | |
| CXOUJ174638.3-285609 | 17 46 38.3 | -28 56 09 | CXOUJ174453.7-291952 | 17 44 53.7 | -29 19 51 |
| CXOUJ174638.7-285452 | 17 46 38.7 | -28 54 50 | 17 44 53.6 | -29 19 53 | |
| 17 46 38.8 | -28 54 52 | CXOUJ174429.6-291908 | 17 44 29.6 | -29 19 08 | |
| CXOUJ174835.1-282336 | 17 48 35.0 | -28 23 35 | 17 44 29.7 | -29 19 07 | |
| CXOUJ174708.3-281410 | 17 47 08.2 | -28 14 11 | CXOUJ174434.1-291816 | 17 44 34.2 | -29 18 16 |
| 17 47 08.3 | -28 14 10 | CXOUJ174432.1-291801 | 17 44 32.1 | -29 18 01 | |
| 17 47 08.3 | -28 14 09 | CXOUJ174507.4-291557 | 17 45 07.4 | -29 15 57 | |
| CXOUJ174645.2-281547 | 17 46 45.3 | -28 15 46 | CXOUJ174354.7-290908 | 17 43 54.7 | -29 09 09 |
| 17 46 45.3 | -28 15 48 | 17 43 54.8 | -29 09 08 | ||
| CXOUJ174658.0-281414 | 17 46 58.0 | -28 14 14 | CXOUJ174355.3-290954 | 17 43 55.3 | -29 09 54 |
| 17 46 57.9 | -28 14 14 | CXOUJ174425.9-293849 | 17 44 25.9 | -29 38 48 | |
| CXOUJ174557.6-281955 | 17 45 57.6 | -28 19 56 | CXOUJ174403.6-292742 | 17 44 03.5 | -29 27 43 |
| CXOUJ174552.4-282027 | 17 45 52.4 | -28 20 28 | 17 44 03.6 | -29 27 43 | |
| 17 47 12.8 | -28 48 06 | 17 44 03.6 | -29 27 41 | ||
| 17 47 12.7 | -28 48 07 | CXOUJ174407.0-292803 | 17 44 07.1 | -29 28 04 | |
| CXOUJ174710.1-284931 | 17 47 10.1 | -28 49 31 | CXOUJ174412.3-292636 | 17 44 12.2 | -29 26 36 |
| 17 47 10.0 | -28 49 30 | CXOUJ174428.5-293929 | 17 44 28.4 | -29 39 29 | |
| CXOUJ174706.3-284907 | 17 47 06.2 | -28 49 07 | CXOUJ174216.0-293756 | 17 42 16.0 | -29 37 56 |
| CXOUJ174703.1-284913 | 17 47 03.2 | -28 49 13 | 17 42 15.9 | -29 37 58 | |
| 17 47 03.2 | -28 49 12 | CXOUJ174216.1-293732 | 17 42 16.0 | -29 37 33 | |
| CXOUJ174712.3-284828 | 17 47 12.3 | -28 48 28 | 17 42 16.2 | -29 37 32 | |
| CXOUJ174702.5-285258 | 17 47 02.4 | -28 52 58 | CXOUJ174210.4-293639 | 17 42 10.3 | -29 36 40 |
| CXOUJ174536.9-284013 | 17 45 36.9 | -28 40 12 |
aNote that for some Chandra sources there is more than one potential -band counterpart. For these X-ray sources there are multiple entries in the Table, each entry showing the coordinates for a unique -band candidate counterpart to that Chandra source.
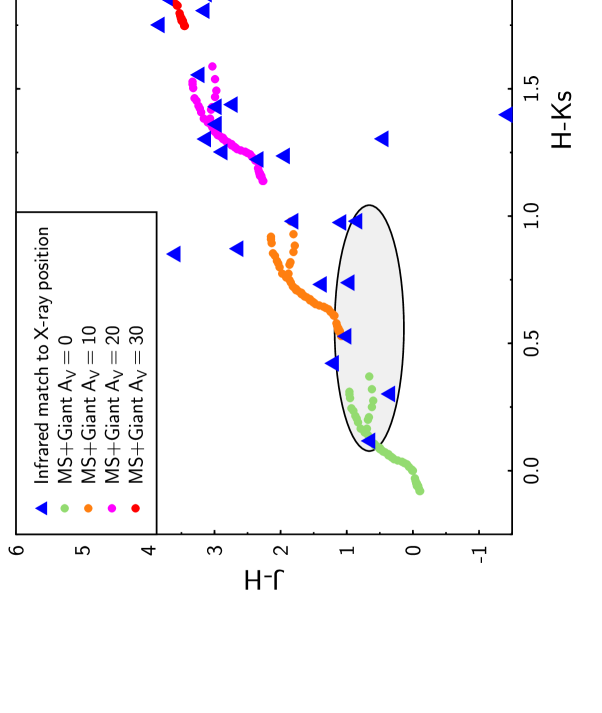
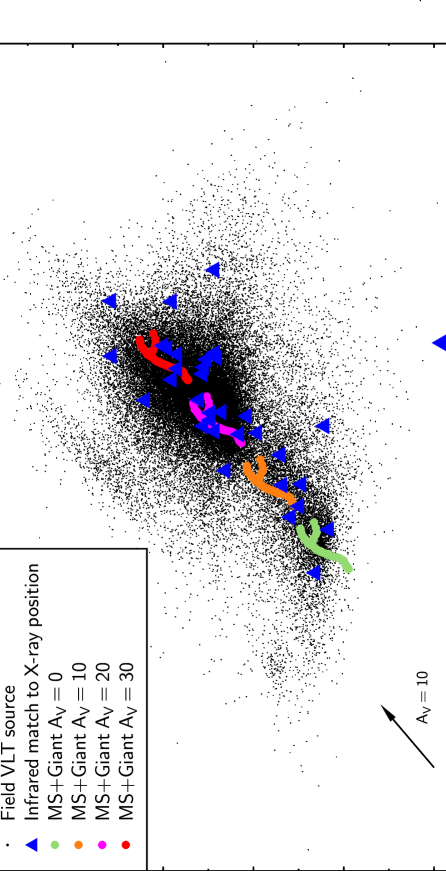
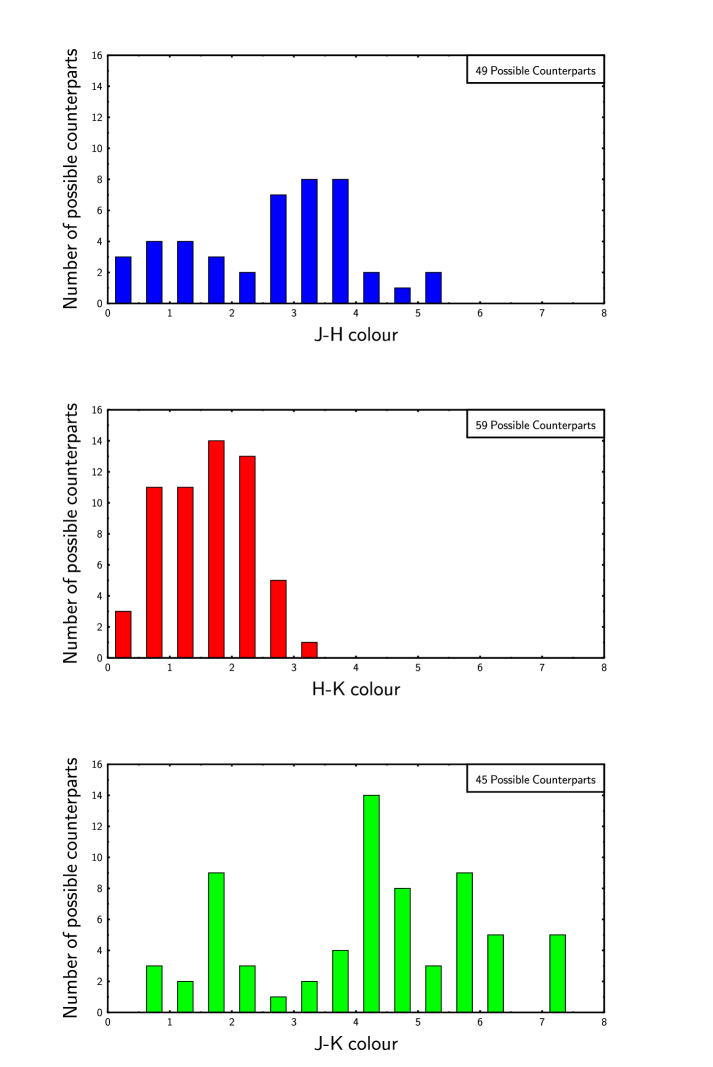
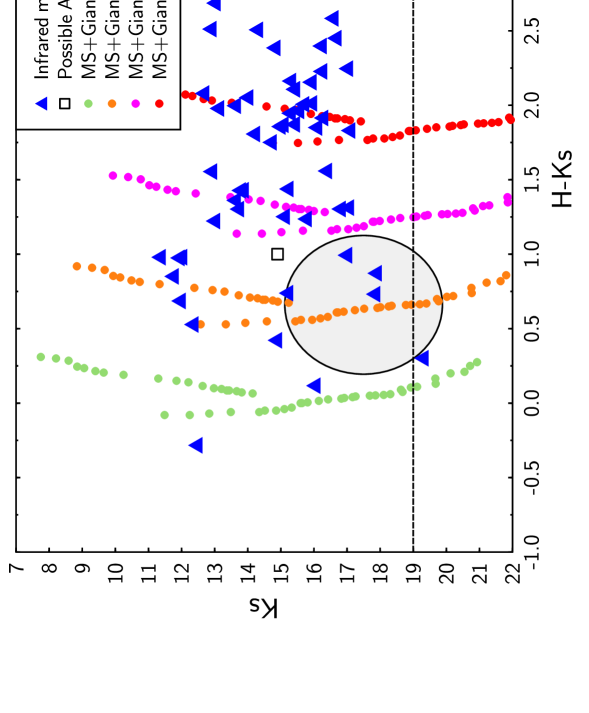
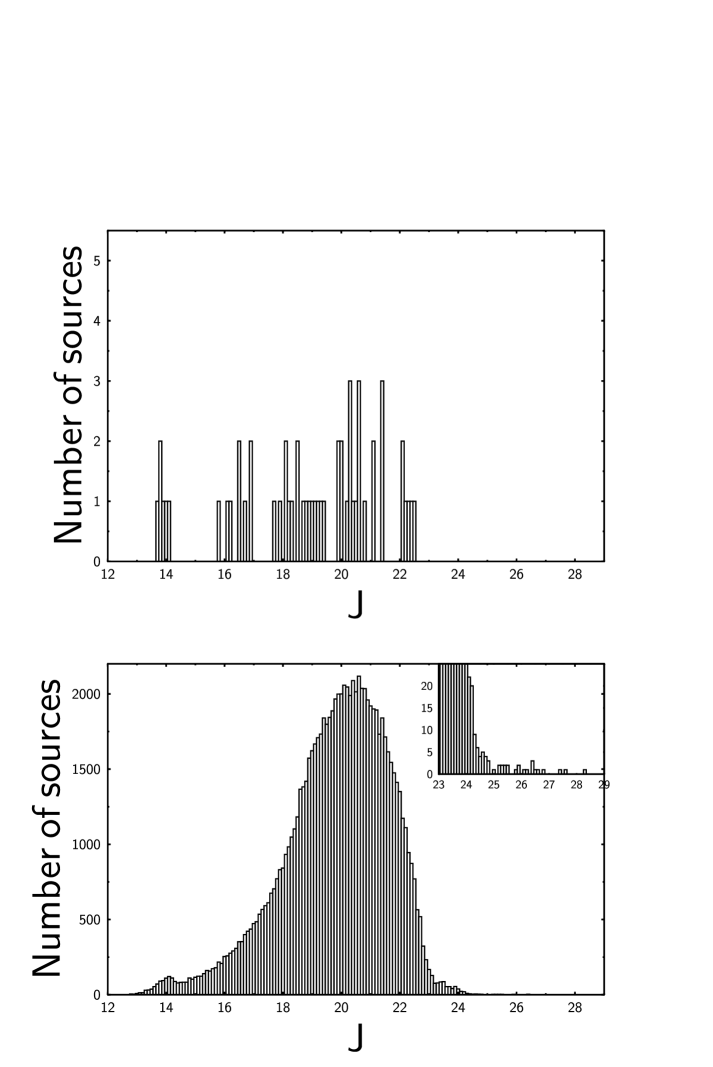
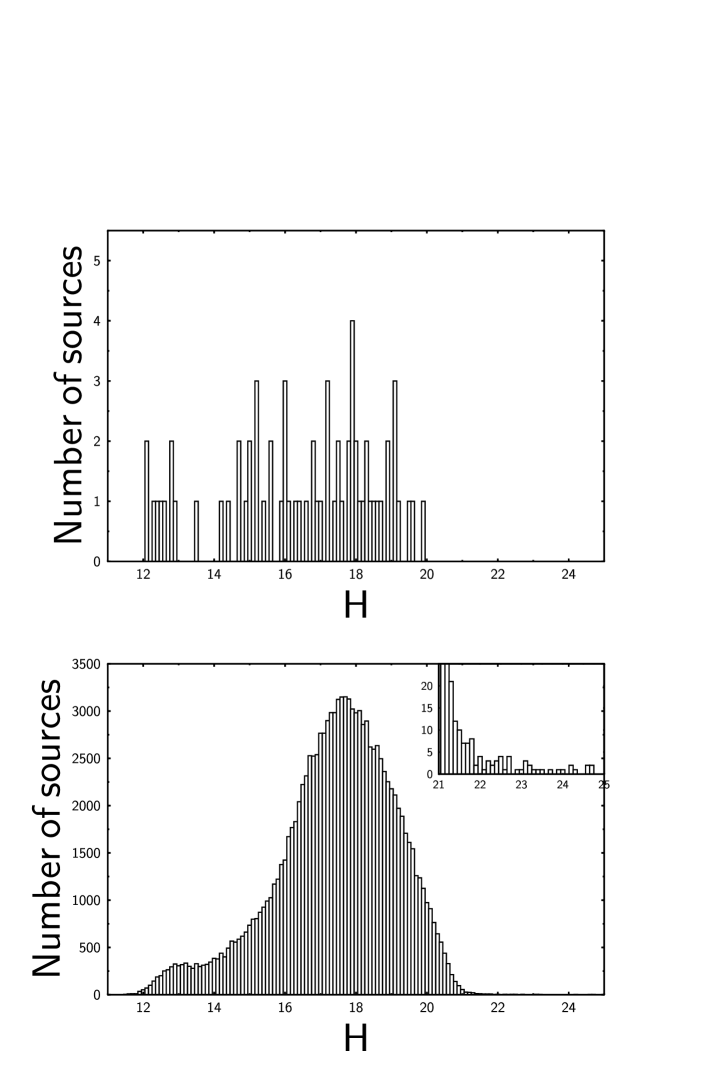
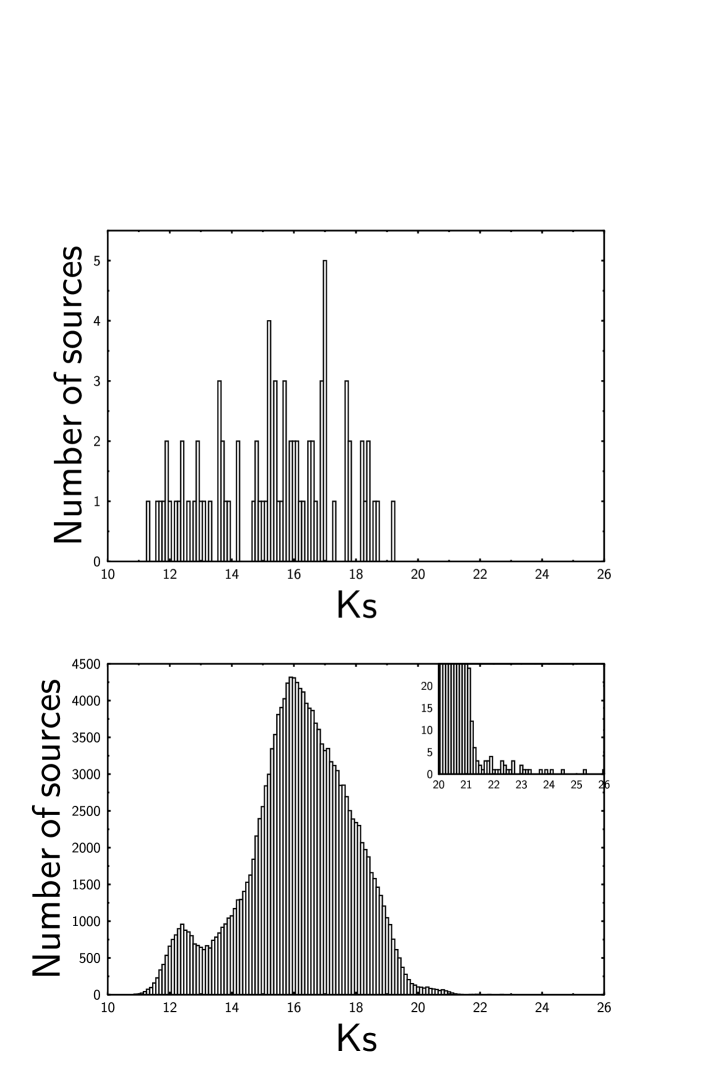
For an average GC extinction of 3.3 (B96), the peak of the expected reddened magnitude distribution for the WNSs is 17 (PRP02). The peak of the observed reddened magnitudes for the potential counterparts (Fig. 6) is 16, with an (H-) colour of 1.5–2.5 (Fig. 5). There is no obvious difference between the distribution of the magnitudes of our candidate counterparts and those of the field population (Fig. 5); a more detailed comparison will be presented in a subsequent paper (Gosling et al. , in prep).
In order to determine the significance of the IR matches, a Monte Carlo simulation was carried out to see what fraction of randomly-located 1.3″-radius circles would contain an X-ray source simply by chance. The Chandra X-ray source positions were shifted by a random amount between 5″ and 20″, and the number of shifted error circles containing an IR counterpart was recorded. This procedure was carried out times, and the results were binned according to the fraction of shifted positions whose error circles did not contain an IR source. The distribution obtained was then fitted with a normal distribution. The mean fraction of randomised positions with non-detections inside a 1.3″ error circle was found to be , , and for , , and bands respectively (1 errors). For comparison with the values obtained for the real data as reported below, these fractions correspond to approximately 25% (19 sources), 40% (31 sources), and 50% (39 sources) without counterparts in the simulated data, for , , and respectively. Owing to the decreasing extinction with wavelength, the fraction of 1.3″ circles without IR counterparts decreased on moving from through to .
Out of a total of 77 X-ray source positions in our VLT fields, the percentage without IR counterparts in , , and respectively were 25% (19 sources), 35% (27 sources), and 40% (31 sources; see Fig. 3), corresponding to 0.1-, 1.0- and 2.0- below the expected values for a random distribution of X-ray error circles. These values are consistent with what is expected as a result of the stellar density in our fields. The average separation of stars in the -band is 1.94″, thus with a 1.3″ error circle we would not expect a statistically significantly larger number of counterparts than for a random distribution. However, in the - and -band, where the average stellar separation is 2.29″ and 2.72″ respectively, we do expect to see a larger number of X-ray/IR matches than would be expected by chance, and indeed, that is what is observed. At the shorter wavelengths, we are detecting more sources within the X-ray error circles than would be expected by chance, and therefore we are likely to be detecting some of the true IR counterparts to the X-ray sources.
The detection of a larger number of potential counterparts in and (8 and 4 more sources, respectively, than in the simulated data) than would be expected from a random distribution has two potential interpretations. First, we may be detecting more matches of X-ray sources to foreground (rather than GC) stars, as foreground stars are subject to much less extinction. The second possibility is that there are a larger number of potential counterparts which are intrinsically brighter and bluer than the average field population, a result which would be consistent with the hypothesis that many of these faint Chandra sources may be WNS systems. In any case, this simulation shows that some fraction of the potential counterparts within the error circles are likely to be chance coincidences, especially at , so follow-up spectroscopy must be used to identify which IR sources are the true counterparts to the X-ray sources.
There are no -band counterparts for 25% of the Chandra sources. This is larger than the expected fraction of background AGN from the CDF estimate, though other groups have predicted larger fractions (up to 50%). However, the extinction in the GC is extremely variable, even at . From visual inspection of our VLT data it is clear that some areas exhibit larger than average extinction () in the form of dust patches and lanes (Gosling, Blundell, & Bandyopadhyay, submitted). Seven of our X-ray sources are in regions of unusually heavy IR (notably -band) extinction; thus we estimate that the true fraction of Chandra sources without counterparts at the limiting magnitude of our survey is 16%. As has been noted by previous authors (B96; Cotera et al. 2000), the highly variable and structured nature of the extinction in the GC makes derivation of reddening-corrected photometry for the field population non-trivial. Thus a detailed assessment of the likely spectral types for the candidate counterparts will be presented by Gosling et al. (in prep).
4 Discussion
The colours and magnitudes of the IR candidate counterpart population are generally consistent with main-sequence and giant stars at distances of the GC. Only a few sources have low extinctions consistent with foreground stars. Of the detected candidate counterparts, only a few have colours and magnitudes consistent with AGN/quasars; however these are indistinguishable from foreground stars on the basis of magnitudes and colours alone. From visual inspection of our VLT images, none of the candidate counterparts appears intrinsically extended (though this of course does not rule out QSO or faint AGN). In Figs. 4 and 5 we have indicated the likely colours and magnitude range for AGN/QSOs (as derived from Spinoglio et al. 1995, Ivazic et al. 2001, Sharp et al. 2002, and Pentericci et al. 2003). Note that for substantial visual extinction (10) most extragalactic counterparts to the Chandra sources will be below the detection limits (Fig. 5) of our survey. The limiting magnitude of this survey also places limits on the types of stars detectable at the distance of the GC. Along the line of sight out to the distance of the GC, in our images we expect to detect all evolved (supergiant and giant) stars, but we will only detect main sequence stars of type G or earlier; K, M dwarfs in the GC will be below our detection limit.
On the basis of this astrometry and photometry, we were awarded VLT time in the summer of 2005 to obtain ISAAC -band spectra of the 31 best candidate counterparts ( magnitudes 12–17); the goal of these observations is to identify the X-ray source counterparts via detection of accretion signatures. The primary accretion signature in the -band which distinguishes a true X-ray counterpart from a field star is strong Brackett emission; this technique of identifying XRB counterparts has been verified with observations of several well-studied GC XRBs (see e.g. Bandyopadhyay et al. 1999). As these Chandra sources are weaker in X-rays than the previously known population of Galactic XRBs, and thus have lower inferred accretion rates, their emission signatures will likely be somewhat weaker than in the more luminous XRB population. However, the Brackett accretion signature is clearly detected in the IR spectra of CVs, which are only weak X-ray emitters with a similar X-ray luminosity range to the Chandra sources (see Dhillon et al. 1997 for IR emission signatures in CVs). Of course, the magnitude limits of our VLT imaging preclude detecting IR counterparts to any CVs which may be present in our fields located beyond a few kpc from the Sun. The comparison between CVs and the counterparts of the Chandra sources at GC distances is made purely to illustrate that even for X-ray binaries accreting at lower rates than in “canonical” systems, we expect the Brackett signature to be detected and thus the spectroscopic identification to be definitive even for these low-luminosity X-ray sources. The spectra we obtain of our brighter targets will allow us not only to identify the counterpart via its emission signature but also to spectrally classify the mass donors if absorption features are detected, a crucial step in determining the nature of this new accreting binary population.
Identifying IR counterparts to these newly discovered X-ray sources provides a unique opportunity to make a census of the various populations of accreting binaries in the GC and may ultimately allow a determination of each system’s physical properties. As this Chandra survey may contain up to 10% of the entire population of accreting binary systems in the Milky Way (PRP02), our results will have important implications for our understanding of XRBs in the Galaxy, including their formation, evolutionary history, and physical characteristics. In particular, if many of the detected sources do indeed turn out to be the missing progenitors of L/IMXBs, it would put strong constraints on models of this important population of X-ray sources.
5 Acknowledgments
The authors would like to thank Niel Brandt for helpful discussions about Chandra data analysis and astrometric issues, and Michael Muno for information about the astrometry of the Chandra image of Sgr A*. K. M. B. thanks the Royal Society for a University Research Fellowship. J. C. A. M.-J. and A. J. G. thank the UK Particle Physics and Astronomy Research Council for Studentships. We also thank Mark Morris for his helpful and rapid referee report. This paper is based on observations made with the ESO VLT at Paranal under program ID 71.D-0377(A).
References
- [1] Bandyopadhyay, R.M., Shahbaz, T., Charles, P.A., & Naylor, T., 1999, MNRAS, 306, 417
- [2] Belczynski, K. & Taam, R.E., 2004, ApJ, 616, 1159
- [3] Blum, R.D., Sellgren, K., & DePoy, D.L., 1996, ApJ, 470, 864 (B96)
- [4] Bower, G.C., Backer D.C., & Sramek, R.A., 2001, ApJ, 558, 127
- [5] Brandt, W.N., et al. , 2001, AJ, 122, 2810
- [6] Cotera, A.S., Simpson, J.P., Erickson, E.F. & Colgan, S.W.J., 2000, ApJSS, 129, 123
- [7] Dhillon, V.S., et al. , 1997, MNRAS, 285, 95
- [8] Dutra, C.M., Santiago, B.X., Bica, E.L.D., & Barbuy B., 2003, MNRAS, 338, 253
- [9] Ebisawa, K., et al. , 2005, ApJ, in press (astro-ph/0507185)
- [10] Gosling, A.J., Blundell, K.M., & Bandyopadhyay, R.M., submitted.
- [11] Hornschemeier, A.E., et al. , 2001, ApJ, 554, 742
- [12] Ivazic, Z., et al. , 2001, Proc. IAU Symposium 184, p. 137
- [13] King, A.R. & Ritter, H., 1999, MNRAS, 309, 253
- [14] Meurs, E.J.A. & van den Heuvel, E.P.J., 1989, A&A, 226, 88
- [15] Muno, M.P., et al. , 2003, ApJ, 589, 225
- [16] Muno, M.P., Lu, J.R., Baganoff, F.K., Brandt, W.N., Garmire, G.P., Ghez, A.M., Hornstein, S.D., Morris, M.R., 2005, ApJ, in press (astro-ph/0503572)
- [17] Pentericci, L., et al. , 2003, A&A, 410, 75
- [18] Pfahl, E., Rappaport, S., & Podsiadlowski, Ph., 2002, ApJL, 571, L37 (PRP02)
- [19] Pfahl, E., Rappaport, S., & Podsiadlowski, Ph., 2003, ApJ, 597, 1036
- [20] Podsiadlowski, Ph. & Rappaport, S., 2000, ApJ, 529, 946
- [21] Podsiadlowski, Ph., Rappaport, S., & Pfahl, E., 2002, ApJ, 565, 1107
- [22] Rappaport, S. & van den Heuvel, E.P.J., 1982, Proc. IAU Symposium 98, p. 327
- [23] Sharp, R.G., Sabbey, C.N., Vivas, A.K., Oemler Jr., A., McMahon, R.G., Hodgkin, S.T., & Coppi, P.S., 2002, MNRAS, 337, 1162
- [24] Spinoglio, L., Malkan, M.A., Rush, B., Carrasco, L., & Recillas-Cruz, E., 1995, ApJ, 453, 616
- [25] Wang, Q.D., Gotthelf, E.V., & Lang, C.C., 2002, Nature, 415, 148 (W02)