The dust-eliminated shape of quasar spectra in the near-infrared: a hidden part of the big blue bump
Abstract
The near-infrared shape of the big blue bump component in quasar spectra has been essentially unknown. It usually cannot be observed directly, due to the strong hot dust emission which dominates quasar spectra longward of 1m. However this is quite an important part of the spectrum theoretically. At least bare disk models provide quite a robust prediction for the overall continuum shape in the near-infrared. Self-gravity should become important in the outer, near-infrared emitting regions of the putative disk, possibly leaving a signature of disk truncation in the near-infrared. We propose here that this important part of the spectrum can be revealed for the first time by observing polarized flux from normal quasars. At least in some polarized quasars, the emission lines are all unpolarized and so the polarized flux should originate interior to the broad line region, and therefore also interior to the dust emitting region. This can then be used to eliminate the dust emission. We present the results of near-infrared polarimetry for such three quasars (Ton202, 4C37.43, B2 1208+32). The data for Ton202 have the highest S/N, and the near-infrared polarized flux in this case is measured to have quite a blue shape, , intriguingly consistent with the simple multi-temperature black body, bare disk prediction of . All these data, although still with quite low S/N for the other two objects, demonstrate the unique potential of the technique with future better data. We also present similar data for other quasars and radio galaxies, and briefly discuss the nature of the polarization.
keywords:
quasars - galaxies: active - accretion - polarization - radiation mechanisms: general1 Introduction
The infrared portion of quasar spectra is dominated by the thermal emission from dust grains. This domination starts in the near-infrared (near-IR), at 1m, which is essentially set by the dust sublimation temperature. This hot dust emission in the near-IR actually hides quite an important part of quasar spectra, i.e. the long wavelength side of the UV/optical continuum component, often called the big blue bump (BBB).
The radiative energy output of quasars is dominated by this UV/optical component. It is generally thought to be from an accretion disk around a supermassive black hole (e.g. Shields 1978, Malkan 1983), but the nature of this putative disk has not been well understood in many respects (e.g. Antonucci 1988; Antonucci 1999; Koratkar & Blaes 1999). However, disk models make a few key predictions for the long wavelength spectra.
It is well known that in a very simple multi-temperature black body disk, extending infinitely in radius, the spectral shape converges to at long wavelengths. Even with sophisticated, relativistic disk atmosphere models (e.g. Hubeny et al. 2000), this limit is essentially reached longward of 1 m for almost all reasonable black hole masses and Eddington ratios. While reprocessing by a flared or warped disk can result in a redder spectrum, we have quite a robust prediction for the overall continuum shape of at least a bare disk in the near-IR. Furthermore, the outer parts of standard disks are known to be unstable against self-gravity, and this might set an upper limit to the radial extent of the disk (e.g. Goodman 2003). Since the outer radii generally contribute to longer wavelength emission, this limit would produce a change in slope in the spectrum, with a rapid flux down-turn toward long wavelengths. Standard Shakura-Sunyaev type disk models predict that, in the absence of any other additional processes, the truncation radius would be around a thousand Schwarzschild radii for conceivable parameters of quasars (Goodman, 2003). This in turn means that its effect on the emission spectrum would show up toward and at the near-IR. Thus the near-IR spectral shape of the BBB emission is quite important for testing fundamental aspects of disk models. Near-IR detection of the outer edge of the disk would also shed much needed light on the mass and angular momentum supply that fuels the quasar.
The near-IR part of the BBB has remained unseen directly, because of the hot dust emission described above — this is thought to be from the inner part of a torus-like structure surrounding the nucleus and the broad emission line region (BLR). We still do not have the spatial resolution to isolate the nucleus from this surrounding putative torus. Spectral decomposition does not constrain the near-IR BBB shape well (Malkan, 1989). To uncover this important part of the spectrum and investigate it directly, we need to remove the hot dust emission. The red light from the host galaxy probably contaminates the observed spectrum as well. We argue here that we can remove all these contaminations by using polarization.
Many normal quasars show a small (%) optical polarization (Stockman, Moore & Angel, 1984; Berriman et al., 1990), and there is a strong statistical tendency for the polarization position angle (PA; E-vector direction) to lie parallel to the radio structural axis in these quasars (e.g. Stockman, Angel, & Miley 1979; Moore & Stockman 1984; Rusk & Seaquist 1985). At least in some (and possibly many) cases, this polarization seems to be confined to the continuum — there are essentially no emission lines in the polarized flux (; see Figure 31 in Kishimoto et al. 2004; the optical data for three quasars are reproduced in Figure 1-4 in this paper). In this case, the polarized flux is considered to originate interior to the BLR. We can then scrape off all the contaminations coming from the BLR and outer regions just by looking at the polarized flux. We have applied this idea in the near-UV/optical to look for the Balmer edge feature, intrinsic to the BBB emission but buried under the contamination from the BLR. Indeed we found the edge feature in absorption — this is most simply interpreted as an indication of the optically-thick thermal nature of the BBB emission (Kishimoto, Antonucci, & Blaes 2003; Kishimoto et al. 2004).
In principle, we should be able to apply the same idea to remove the dust emission, which arises exterior to the BLR. We present here the near-IR polarized flux measurements for three quasars which have no or very little emission lines in the optical polarized flux. The data are still of low S/N or in need for further measurements, but suggest that our idea seems to work. We also present near-IR polarization measurements for other quasars and radio galaxies and briefly discuss the nature of the polarization.
| name / | other | exp. | date | filter | |
|---|---|---|---|---|---|
| position | name | (min) | |||
| 0837-120 | 3C206 | 0.198 | 8 1 | 15 Jan | |
| 12 1 | 15 Jan | ||||
| 4 3 | 15 Jan | ||||
| 8 1 | 15 Jan | ||||
| 1114+445 | PG | 0.144 | 12 1 | 15 Jan | |
| 12 1 | 16 Jan | ||||
| 4 1 | 15 Jan | ||||
| 4 1 | 16 Jan | ||||
| 4 1 | 15 Jan | ||||
| 4 1 | 16 Jan | ||||
| 1208+322 | B2 | 0.388 | 12 1 | 16 Jan | |
| 8 2 | 15 Jan | ||||
| 8 1 | 16 Jan | ||||
| 4 1 | 15 Jan | ||||
| 8 1 | 15 Jan | ||||
| 8 1 | 16 Jan | ||||
| 1425+267 | Ton202 | 0.366 | 12 2 | 16 Jan | |
| 8 2 | 16 Jan | ||||
| 8 1 | 16 Jan | ||||
| 1512+370 | 4C37.43 | 0.371 | 12 2 | 16 Jan | |
| 8 2 | 16 Jan | ||||
| 8 2 | 16 Jan |
| name/ | other | exp. | date | filter | |
|---|---|---|---|---|---|
| position | name | (min) | |||
| 0453+227 | 3C132 | 0.214 | 102 | 25 Jan | |
| 0459+252 | 3C133 | 0.278 | 101 | 26 Jan | |
| 0752+258 | OI287 | 0.446 | 101 | 24 Jan | |
| 101 | 25 Jan | ||||
| 0802+243 | 3C192 | 0.060 | 102 | 26 Jan | |
| 0824+294 | 3C200 | 0.458 | 103 | 26 Jan | |
| 0938+399 | 3C223.1 | 0.107 | 101 | 24 Jan | |
| 102 | 25 Jan | ||||
| 0945+076 | 3C227 | 0.086 | 101 | 24 Jan | |
| 102 | 24 Jan | ||||
| 101 | 25 Jan | ||||
| 0958+290 | 3C234 | 0.185 | 102 | 24 Jan | |
| 1003+351 | 3C236 | 0.101 | 102 | 25 Jan | |
| 1142+318 | 3C265 | 0.811 | 104 | 26 Jan | |
| 1420+198 | 3C300 | 0.270 | 104 | 26 Jan | |
| 1512+370 | 4C37.43 | 0.371 | 101 | 25 Jan |
| name / | other | exp. | date | filter | |
|---|---|---|---|---|---|
| position | name | (min) | |||
| 1425+267 | Ton202 | 0.366 | 12 6 | 27 Jun | |
| 8 8 | 27 Jun |
| name | UT date | band | mag | P(per cent) | PA(°) | aperturea |
|---|---|---|---|---|---|---|
| SAO82926b | 2005 Jul 8 | 9.33 | 2.7 | |||
| 9.12 | ||||||
| SAO82926c | 2005 Jul 8 | 9.33 | 3.6 | |||
| 9.11 | ||||||
| CMC604707c | 2001 Jan 16 | 9.25 | 3.6 | |||
| 8.87 | ||||||
| 8.81 | ||||||
| CMC604919d | 2001 Jan 15 | 7.99 | 7.5 | |||
| 7.37 | ||||||
| 7.23 |
Note. aThe synthetic aperture diameter in arcsec for polarization measurements. The apertures for the photometric magnitudes quoted are larger than these. bObserved with a small de-focusing. cObserved with a further de-focusing. dObserved with a large de-focusing.
| name | z | year | band | mag | (mJy) | P(per cent) | PA(°) | ||
| quasars with unpolarized broad lines | |||||||||
| Ton202 | 0.366 | 0.019 | 2001 | 15.35 | 1.13 | 2.18E-16 | |||
| 14.53 | 1.60 | 1.82E-16 | |||||||
| 13.67 | 2.34 | 1.56E-16 | |||||||
| 2005 | 15.36 | 1.12 | 2.16E-16 | ||||||
| 13.84 | 2.00 | 1.33E-16 | |||||||
| B2 1208+32 | 0.388 | 0.017 | 2001 | 15.47 | 1.01 | 1.95E-16 | |||
| 14.85 | 1.20 | 1.36E-16 | |||||||
| 14.29 | 1.32 | 8.76E-17 | |||||||
| 4C37.43 | 0.371 | 0.022 | 2001 | 15.44 | 1.04 | 2.00E-16 | |||
| 14.72 | 1.35 | 1.53E-16 | |||||||
| 13.95 | 1.81 | 1.21E-16 | |||||||
| 2000 | 13.89 | 1.90 | 1.27E-16 | ||||||
| other quasars | |||||||||
| 3C227 | 0.086 | 0.026 | 2000 | 12.44 | 7.22 | 4.81E-16 | |||
| 12.31 | 7.71 | 4.78E-16 | |||||||
| OI287 | 0.444 | 0.061 | 2000 | 14.11 | 1.56 | 1.04E-16 | |||
| 13.87 | 1.82 | 1.13E-16 | |||||||
| Q1114+445 | 0.144 | 0.016 | 2001 | 14.38 | 2.76 | 5.33E-16 | |||
| 13.57 | 3.87 | 4.39E-16 | |||||||
| 12.47 | 7.00 | 4.67E-16 | |||||||
| 3C206 | 0.198 | 0.045 | 2001 | 14.49 | 2.49 | 4.80E-16 | |||
| 13.85 | 2.99 | 3.39E-16 | |||||||
| 12.83 | 5.08 | 3.39E-16 | |||||||
| narrow-line radio galaxies | |||||||||
| 3C234 | 0.185 | 0.019 | 2000 | 12.88 | 4.84 | 3.22E-16 | |||
| 3C265 | 0.811 | 0.023 | 2000 | 16.12 | 0.24 | 1.61E-17 | |||
| 3C223.1 | 0.107 | 0.017 | 2000 | 12.91 | 4.70 | 3.13E-16 | |||
| 3C132 | 0.214 | 0.482 | 2000 | 14.33 | 1.27 | 8.49E-17 | |||
| 3C133 | 0.278 | 0.949 | 2000 | 14.97 | 0.70 | 4.68E-17 | |||
| 3C192 | 0.060 | 0.054 | 2000 | 12.86 | 4.94 | 3.29E-16 | |||
| 3C200 | 0.458 | 0.040 | 2000 | 15.33 | 0.50 | 3.34E-17 | |||
| 3C236 | 0.101 | 0.011 | 2000 | 12.89 | 4.81 | 3.20E-16 | |||
| 3C300 | 0.270 | 0.035 | 2000 | 15.32 | 0.51 | 3.40E-17 | |||
2 Observations
We observed several quasars listed in Table 1 in the second half nights of 15 and 16 Jan 2001 (UT) with UKIRT. The sample was selected mainly based on the known polarization properties: they are all known to be polarized in the optical with 1-2% level except for 3C206 (Stockman et al., 1984; Berriman et al., 1990), and all have previous polarization measurements at band except for B2 1208+32 although with rather large uncertainties (Sitko & Zhu, 1991). They are lobe-dominant radio sources except for Q1114+445 which is radio quiet. We used the camera UFTI with the polarimetry module IRPOL2. The platescale was per pixel. Seeing was estimated to be FWHM (or slightly worse) in most of the first night, while it was FWHM in the rest of the run, based on the image size of these quasars.
The data were reduced firstly with the software ORACDR where bad pixels were masked, dark frame subtracted, and the frames were divided by a flat-field which was constructed from sky frames at four waveplate positions (we averaged these four flat-fields from four waveplate positions after checking consistency), and frames with three dithering positions were registered and combined. Then synthetic aperture photometry was implemented using IDL in each o-ray and e-ray image at four waveplate positions to produce Stokes , , and parameters. This was done with various aperture radii and optimal aperture size was searched to minimize the polarization measurement uncertainty. We adopted a diameter aperture for the data with the worse seeing size, and diameter for the rest of the data. For flux measurements, a larger aperture was chosen: for the data with the worse seeing we adopted diameter, while for the rest diameter. The sky level was determined at the annulus with inner and outer diameters being and for the worse seeing data and and for the rest (both for polarization and flux measurements).
We generally repeated a set of polarization measurements a few times with the same filter at four waveplate positions. The number of repeated sets is shown in the exposure time column of Tables 1-3. The Stokes parameters measured in each set were combined by taking the weighted average. Polarization position angles were calibrated using the polarization standard star HDE 283809 with an uncertainty of 3°.
We also observed several quasars and radio galaxies listed in Table 2 in the second half nights of 24, 25, and 26 Jan 2000 (UT) with the same instruments on UKIRT. Seeing is estimated to be for the first night and for the second and third nights. During this run in 2000, we occasionally had a guiding problem due to the vignetting of the field of view by the waveplate holder. This made the images of some objects slightly elongated or distorted. For some objects with this guiding problem, we used our own IDL scripts to find the best registration of the images. Otherwise the data were reduced in the same manner as above. We used rather large synthetic apertures for all the frames in this run, namely the same apertures as those for the worse seeing data in 2001 described above ( and for polarization and flux measurement, respectively, with the background determined at the annulus between and , all in diameter). For 3C192, 3C236, 3C223.1 which were quite extended, we used larger apertures for flux measurements ( for 3C192 and for 3C236 and 3C223.1) and background determinations (/ and / annuli).
The data taken in 2001 were flux-calibrated using the standard star FS21, and a consistent calibration was obtained for the data in 2000 using the standard star FS134. The accuracy of the flux calibration is estimated to be typically 5%, based on the observation of another flux standard star and also on the comparison of the frames for the objects with multiple data sets and/or observing dates.
Finally we also obtained data for one quasar, Ton 202, through the UKIRT service programme on 27 Jun 2005, kindly helped by Chris Davis. The observations are listed in Table 3. Seeing is estimated to be . We have used a aperture to measure polarization, for flux measurements, with background determined between and (all in diameter). The flux standard star was GSPC P272-D. A similar estimation as above suggests the flux uncertainty to be 5% or better.
Instrumental polarization was checked in the service program in 2005 by observing the star SAO82926 which is known to be unpolarized in the optical (%; Korhonen & Reiz 1986). The data were obtained on 2005 Jul 8, again kindly helped by Chris Davis. In 2001 we also observed the stars with high proper motions, CMC604919 and CMC604707, for which we expect very low intrinsic polarization. These observations are summarized in Table 4. For these bright stars, we needed to de-focus the telescope to avoid having counts in a non-linear regime. Accordingly large synthetic apertures were used for polarization measurements. The results seem to show that the instrumental polarization is smaller than 0.2% even for those de-focused data requiring large apertures, and thus it may be as good as %. We hope to obtain fainter unpolarized stars without any defocusing, in order to better characterize the instrumental polarization.
| name | optical | optical-nIR | nIR |
|---|---|---|---|
| Ton202 | |||
| Ton202a | |||
| B2 1208+32 | |||
| 4C37.43 |
Note. aThe measurements using the near-IR data taken in 2005.
3 Results and discussions
3.1 Quasars with unpolarized broad lines
3.1.1 Results
The primary objects here are the ones which have been found to have unpolarized broad lines (Kishimoto et al., 2003; Kishimoto et al., 2004), namely Ton202, 4C37.43, and B2 1208+32 in our present sample. The results of the near-IR polarimetry for these objects, as well as for others, are summarized in Table 5. Note that the polarization degree has not been debiased and so the observed Stokes parameters can be restored directly from and position angle (PA), and that the biases for those with good polarization detections are always small (Simmons & Stewart, 1985). The statistical errors in the flux measurements are much smaller than the flux calibration error for all the objects and therefore are not shown in Table 5 (the fractional statistical error in total flux is roughly of the order of ).
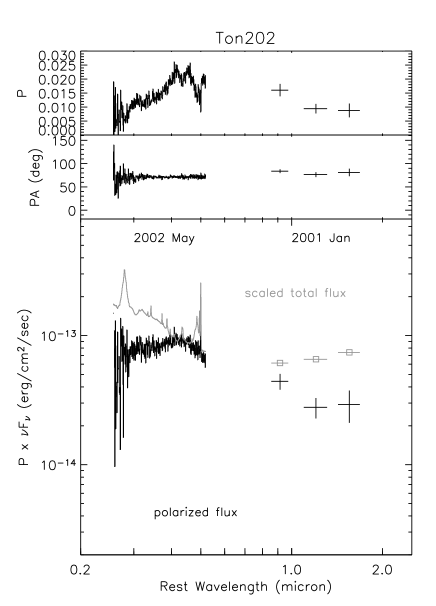
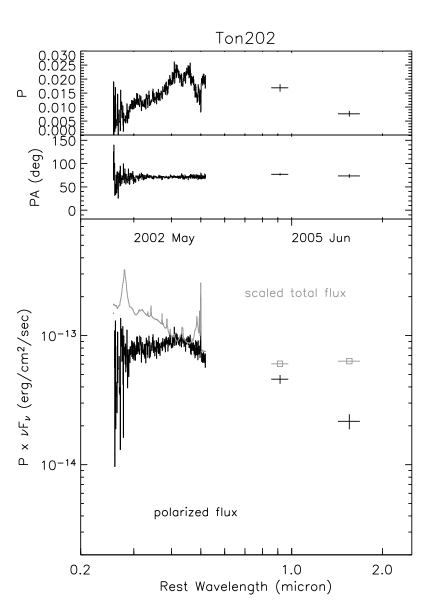
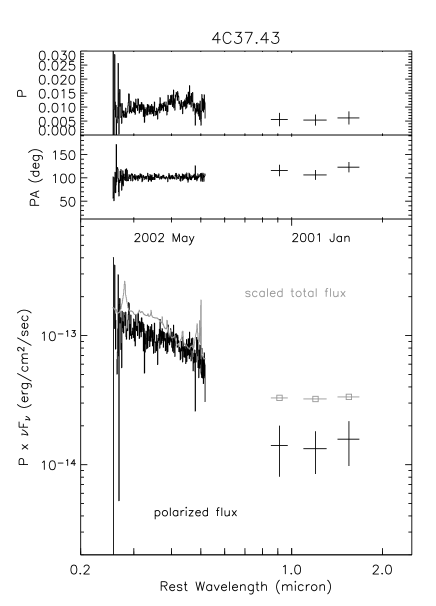
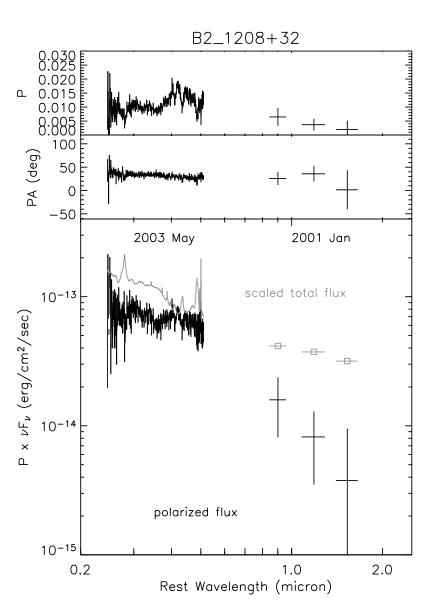
Figure 1 and 2 show the spectral energy distribution of Ton202 from the optical to near-IR in polarized flux as well as in total flux, the former with the near-IR data taken in 2001 and the latter with those taken in 2005. Figure 3 and 4 present the same spectra for 4C37.43 and B2 1208+32, respectively. The optical spectropolarimetry data are from Kishimoto et al. (2003) and Kishimoto et al. (2004). (Note that the optical polarized flux shown is actually a rotated Stokes flux, i.e. the unnormalized Stokes parameter with the reference axis at each object’s polarization PA through the optical band. This quantity does not suffer from the positive bias of polarization degrees, and represents the polarized flux accurately when a single PA for the object can be determined with a high S/N.) All the flux in the Figures has been corrected for the Galactic reddening using the values of in Table 5 and the reddening curve of Cardelli, Clayton, & Mathis (1989) with .
The flux measurements in the optical spectroscopic data have some uncertainty from slit loss and seeing change. Therefore, for Ton202 and 4C37.43, we have scaled the flux by comparing the flux of the nuclear [OIII]4959 and 5007 lines in our spectra with those of Shang et al. (2003) (the [OIII] flux is known to be spatially extended in these objects; Stockton & MacKenty 1987). They used the continuum level from wide-slit spectra to scale their narrow-slit spectra, which are considered to contain essentially only the nuclear [OIII] flux for these two objects. (For our 4C37.43 data, we re-extracted the spectrum with a smaller window to measure the nuclear [OIII] flux.) The resulting nuclear [OIII] flux for each object was further checked with the nuclear [OIII] flux measurements of Stockton & MacKenty (1987). We adopted a scaling factor of 1.33 for the Ton202 data, and 1.41 for 4C37.43, and estimate the flux calibration uncertainty of 10% based on the calibration uncertainty of Shang et al. data and slight discrepancies between the [OIII] flux in our scaled spectra and that of Stockton & MacKenty. However, the uncertainty in this scaling might be somewhat larger than this, especially for 4C37.43 which has quite a large extended [OIII] flux. For B2 1208+32, we did not make any adjustment due to the unavailability of such data.
For one of these three objects, Ton202, we detected near-IR polarization with S/N larger than 3 in three bands in 2001, and the data obtained in 2005 in and bands show consistent polarization with much higher S/N (we note that -band total flux might have varied - see Table 5). For the other two objects, especially for B2 1208+32, the measurements are still of low S/N, but the data show coherent PAs in multiple bands. The PA is roughly the same as those measured in the optical in all three objects, and are all roughly parallel (within about 30°) to the radio structural axis PAs which are 53°, 109°, and 3° for Ton202, 4C37.43, and B2 1208+32, respectively (see Kishimoto et al. 2004 for references). The polarization degree in the near-IR is generally lower than in the optical, and it seems to be decreasing toward longer wavelengths in the near-IR at least in the highest S/N case of Ton202.
3.1.2 Interpretations
As we claimed in the previous papers (Kishimoto et al., 2003; Kishimoto et al., 2004), the optical polarization in these quasars is likely due to electron scattering interior to the BLR, essentially because there are no emission lines seen in the optical polarized flux. The polarization mechanism in the near-IR does not seem to be different from the optical at least based on the same PA observed. If this is the case, the simplest interpretation is that the polarized flux spectrum over the optical-near-IR region is an electron-scattered copy of the emission interior to the BLR, revealing the spectral shape of the big blue bump emission. Note that the scatterers would be electrons and not dust grains, since the scattering region would be within the dust sublimation radius. If this simplest interpretation is correct, then the polarized flux gives the actual measurement of the near-IR shape of the big blue bump for the first time. This idea is consistent with the tendency of the polarization degree decreasing toward longer wavelengths while the total flux is turning up due to the onset of hot dust emission longward of 1m.
We have measured the slope of the polarized flux in different wavelength ranges as shown in Table 6. The measurements show that the polarized flux over the optical to near-IR looks quite blue compared to the polarized flux shape in the optical alone. The improved data for Ton202 taken in 2005 show that the polarized flux slope in the near-IR alone, , is also quite blue compared to the shape in the optical. Intriguingly, the blue slope is consistent with the long wavelength limit of simple multi-temperature black-body disks, . However, the measurements for the other two objects (4C37.43 and B2 1208+32) are still of low S/N, and any general definitive statements have to wait for future data, including -band and red-side optical data for Ton202. Nevertheless, these results, even the present Ton202 data alone, at least suggest that the near-IR polarized flux measurements have the potential to remove the hot dust emission and reveal the underlying intrinsic spectral shape there.
3.1.3 Comparison with disk models
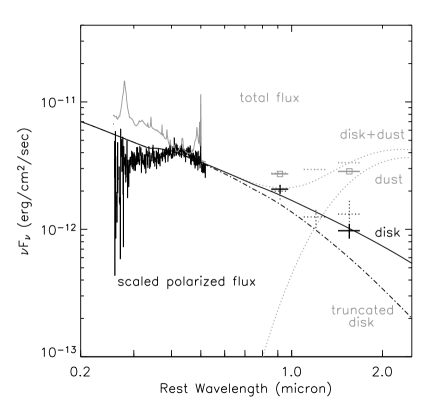
To illustrate the potential of this method for testing emission models for the optical/near-IR portion of the spectrum, we have computed accretion disk spectra and a simplified dust model appropriate for Ton202. For the disk models, we adopted a fixed black hole mass of and an Eddington ratio of , values derived from the H line width and optical continuum luminosity using the Kaspi et al. (2005) relation. We then computed 60 spectra for relativistic accretion disks with the non-LTE atmospheres of Hubeny et al. (2000). The parameters of these spectra ranged over five different black hole spins (, 0.5, 0.9, 0.99, and 0.998), six different disk inclinations (, 0.2, 0.4, 0.6, 0.8, and 1), and two different values of the Shakura-Sunyaev alpha viscosity (0.01 and 0.1). After scaling the optical polarized flux up by a factor 45 in order to match the long wavelength optical total flux in the continuum, we then fit these models to the optical polarized flux at Åin the rest frame, without taking account of the near-IR data. The best fit disk spectrum turned out to have , , and . These parameters should not be taken too literally, however, as our model grid was quite coarse and we did not account for any errors in the assumed black hole mass and Eddington ratio. Figure 5 compares the disk spectrum to the total and polarized flux data (the latter is scaled up by a factor 45). Note that the disk spectrum sails right through the near-IR polarized flux points, even though no attempt was made to incorporate them in the fit.
It is important to note that this long wavelength behaviour is robust in these bare disk models: the slope of the model spectrum measured between 1m and 2m is , which is quite close to the canonical behaviour, and this does not sensitively depend on any parameters above, including and . At shorter (optical/ultraviolet) wavelengths, the models depend much more sensitively on parameters, and this particular model does not seem to reproduce the observed spectrum well in this region.
To illustrate the contribution of the hot dust emission in the near-IR total flux, a black body radiation with temperature K is included in Figure 5. We normalized the black body spectrum to match the observed total flux (from 2001 data; note the slight difference from 2005 data), when summed with the disk spectrum. As we can see, this dust+disk spectrum underpredicts the total flux at band (rest 0.9m). The remaining part of the flux may well be the host galaxy light. In fact, the host luminosity quoted in Bonning et al. (2005) for Ton202 is roughly consistent with the residual flux. Thus, as we expected, the polarized flux spectrum seems to successfully remove this component as well.
The disk model actually becomes nominally self-gravitating at a radius of 330 , and Figure 5 also shows the spectrum of the model truncated at this radius. The spectrum becomes much bluer longward of a break at around 1m, corresponding to that truncation radius. The spectrum deviates from the near-IR polarized flux data, although it is probably premature to rule out a truncated disk given the uncertainties in the actual location of the self-gravitating radius and the S/N of the data. This issue should be explored further with future data for many objects.
3.1.4 Error sources
A potential error source in this measurement would be that another polarization component with a perpendicular PA can reduce the observed polarized flux without changing the observed PA (note that if the component is not at a perpendicular PA, it would be recognizable in PA rotation). A possible concern in this regard would be the scattered dust emission in the near-IR, i.e. the hot dust emission from the putative torus scattered in an outer region, which would be perpendicularly polarized and might become important in the long wavelengths where dust emission dominates in the total flux. However, we would be able to discard such possibilities if we find that the slope down-turn toward long wavelengths (i.e. becoming much bluer than the optical slope) actually starts at much shortward of 1 m in the rest frame, since the effect from dust emission should not be significant at such short wavelengths. Therefore it is important to observe polarized flux shape at shortward of 1 m in the rest frame as well as at longer wavelengths. We can also minimize the risk of the confusion from other polarization components by observing as many objects as possible to see if the same behaviour of the polarized flux with a constant PA across the optical to near-IR is seen systematically.
Another potential error source would be the possible existence of molecular spectral lines in the near-IR BBB spectrum, since this part of the spectrum would be from a fairly low temperature region. The spectrum eventually needs to be properly modelled, and near-IR spectropolarimetry would be valuable to observe actual details there. However, rough measurements with broad band filters are certainly of higher priority at this stage.
3.2 Other objects
3.2.1 Broad-line objects
The broad line radio galaxy 3C227 is a slightly different case from the quasars described above. This is the object where broad lines are polarized, and at a different PA from that of its continuum polarization, and those PAs are not aligned with the radio structural axis (Cohen et al., 1999) which is at 85° (Morganti, Killeen, & Tadhunter, 1993). Our near-IR polarization measurement seems to be in line with the optical measurements, showing roughly consistent PA at lower ( is decreasing toward longer wavelengths in the optical). The polarized flux slope over the optical to near-IR is roughly measured from the flux at 5500Å and band.
The implication of the different continuum polarization PA from the line PA is that the dominant scattering region is slightly outside the BLR, but quite close to it. The BLR as seen from the scattering region is resolved, as opposed to the continuum source. This is actually thought to be the case in many Seyfert 1 galaxies (Goodrich & Miller, 1994; Smith et al., 2002). In this case the near-IR polarized flux might contain some scattered dust emission, depending on the location of the scatterers relative to the inner part of the putative obscuring torus, the source of hot dust emission.
3.2.2 Narrow-line objects
As is previously established, type 2 objects (Seyfert 2 galaxies and narrow-line radio galaxies or NLRGs) show distinct polarization features from these type 1 objects (Antonucci 1993 and references therein). The continuum and broad lines are polarized at the same PA, and it is perpendicular to the radio structural axis. In these cases, the scattering region is thought to be located well outside of the BLR, as confirmed with HST polarization images (e.g. Hurt et al. 1999; Kishimoto et al. 2001). In our sample, 3C234 and 3C265 are in this category. When the scattering region is of a scale much larger than the inner part of the putative torus, the near-IR polarized flux would almost certainly contain scattered dust emission, so that it would possibly have an up-turn longward of 1m, depending on the nature of the scatterers (electrons vs dust grains).
Our near-IR polarimetry result for 3C234 confirms that of Sitko & Zhu (1991) with a higher S/N (Table 5), and is also consistent with the near-IR spectropolarimetric results of Young et al. (1998). The PA is the same as that in the optical, suggesting that the same scattering mechanism is responsible for the near-IR polarization. The near-IR polarized flux of 3C234 in relation to other wavelengths has been discussed in detail by Young et al. (1998) (see also Kishimoto et al. 2001, who quote the polarized flux slope of over the optical to near-IR). They suggested that the polarized flux from dichroism (i.e. selective absorption by aligned dust grains), which is penetrating through a large amount of column and thus is significantly reddened, can start to contribute in the near-IR. This might also occur in other type 2 objects. However, note that this additional dichroic polarization component should have the PA which is either exactly parallel or perpendicular to that of the scattered polarization component (though in the latter case the net polarized flux will decrease) in order for the observed PA to be constant across the relevant wavelengths.
Our near-IR polarimetry result for 3C265 seems to be in line with the optical results (Jannuzi & Elston, 1991; di Serego Alighieri et al., 1996). The polarization PA at band is roughly the same as that in the optical but is slightly rotated (even more perpendicular to the radio axis at PA 106°; Fernini et al. 1993), and the polarization degree at band is a little lower than in the optical. The slope of the polarized flux derived from the flux at 5500Å and is roughly . Note that the object is at so our measurement is at the rest wavelength of m.
The optical scattered light in NLRGs can further be obscured by kpc-scale dust lanes. In this case we would see a strong total flux up-turn in the near-IR toward longer wavelengths with high polarization. Antonucci & Barvainis (1990) suggested that this is the case in 3C223.1 and also in Cen A. We confirm the near-IR polarization measurements of Antonucci & Barvainis (1990) for 3C223.1 with a much higher S/N (Table 5). We observed several other NLRGs (3C132, 3C133, 3C192, 3C200, 3C236, 3C300; mainly selected by their red and/or colour) to look for a similar high polarization at band, but we did not find such a case (Table 5) except for 3C133. The observed polarization of 3C133 might not be due to narrow-line-region-scale scattering, since the observed PA is not perpendicular but parallel to the radio jet axis which is at PA 107° (Laing, 1981), and a significant part of the polarization may well be an interstellar polarization (ISP) in our Galaxy (PA is similar to that of the ISP in the field around the object [Heiles 2000], and it is possible for the -band ISP to be 2% for mag [Whittet et al. 1992]). We note that three of these NLRGs (3C132, 3C200, 3C236) are known to have optically dull spectra and classified as low excitation galaxies or LEG (Laing et al., 1994; Jackson & Rawlings, 1997).
3.2.3 More broad-line objects and type 1 vs type 2
The difference in the dominant scattering observed in type 1s and type 2s seems to be that in the former the scattering is in an equatorial region close to the nucleus (leading to a PA parallel to the radio axis with broad lines occasionally polarized in a different PA), while in the latter the scattering is in a polar region far from the nucleus (leading to a perpendicular PA both for broad lines and continuum). The former polarization would dominate when the nucleus is directly seen, or at least seen with less obscuration. These two different scattering regions have been suggested and discussed by Smith et al. (2004, 2005) for Seyfert 1 galaxies. A further, important point is that the size scale of the equatorial scattering region relative to the BLR appears to be different in different type 1 objects as discussed in Kishimoto et al. (2004).
In the case of the broad line radio galaxy OI287, the optical spectropolarimetry shows that the broad lines and continuum are rather highly polarized with the same and PA, and the narrow lines do not appear to be polarized (Goodrich & Miller, 1988). The PA is parallel to the radio axis PA which is 146° (Ulvestad & Antonucci, 1988), and thus the dominant scattering region seems to be in an equatorial region, but outside of the BLR and interior to the narrow-line region. The result of our near-IR polarimetry is consistent with that of Sitko & Zhu (1991). The near-IR PA is roughly the same as the optical PA, and the polarization degree is significantly lower in the near-IR than in the optical. The optical to near-IR polarized flux slope is roughly from the flux at 5500Å and band.
The case of the radio-quiet QSO 1114+445 is similar to type 2 objects in that its broad lines and continuum in the optical are polarized in the same way (Smith, Schmidt, & Allen, 1993). The narrow lines are also polarized in the same way, which is in contrast to the case of OI287, suggesting that the scattering is exterior to the narrow line region (Smith, Schmidt, & Allen, 1993). Our near-IR polarization measurements at three bands confirm and extend the result of Sitko & Zhu (1991) at band. The polarization degree in the near-IR (%) is lower than that in the optical (decreasing from 3% to 2% toward longer wavelengths). The PA of the near-IR polarization is essentially the same as that in the optical, suggesting the same origin. The polarized flux shape is roughly if measured from the continuum level at 5500Å and the flux at band (or from 5500Å and band; the near-IR polarized flux might have an up-turn toward longer wavelengths).
Finally, our near-IR polarization measurements for the quasar 3C206 do not match the result of Sitko & Zhu (1991) which showed % at , though we note that the PAs in our measurements at 3 bands appear to be consistent with the PA measured by Sitko & Zhu (1991). Those PAs are roughly parallel to the radio axis which is at PA 91° (Reid, Kronberg, & Perley, 1999).
4 Conclusions
We have presented the results of multi-band near-infrared polarimetry of three quasars which have essentially unpolarized broad lines in the optical. The optical polarization is likely due to scattering interior to the BLR, and near-IR polarization would also be from the same mechanism, at least based on the similar polarization PA observed. In this case, the overall optical-near-IR polarized flux is most simply interpreted as an electron-scattered version of the radiation from interior to the BLR. This would provide the measurement of the intrinsic spectral shape of the big blue bump emission, revealing its shape in the near-IR for the first time.
The observed polarized flux slope in the optical to near-IR looks quite blue compared to the shape in the optical alone. The near-IR slope observed in Ton202 seems to be as blue as the long wavelength limit of simple multi-temperature black-body disks and is consistent with the bare disk atmosphere model spectrum which we have computed for illustrating the comparison. However if the disk is to be truncated at the outer radius where the disk becomes nominally self-gravitating, the model spectrum becomes much bluer in the near-IR, deviating from the observed near-IR polarized flux data. The future data with higher S/N for many object would be able to characterise the spectral shape for better comparisons with the models.
With the optical polarized flux data, specifically the discovery of the Balmer edge in absorption in several objects, and now this preliminary demonstration of the near-IR polarized flux as an indication of the blue underlying continuum, we seem to be sketching in the true spectrum of the quasar big blue bump. The results so far look more intelligible physically than the total flux spectra. While the quasi-static Shakura-Sunyaev type disk is known to have many problems, evidence seems to be accumulating that something at least apparently resembling a classical disk, i.e. an optically thick, thermally emitting disk, may exist in quasars. We are exploring these ideas with much more accurate polarimetry data.
We also have presented the band polarimetry of other quasars and radio galaxies. The overall polarization properties seem to be understandable in a picture where two polarization components compete, namely the scattering in an equatorial region interior or close to the BLR and the scattering in a polar region quite outside of the BLR.
Acknowledgements
The United Kingdom Infrared Telescope (UKIRT) is operated by the Joint Astronomy Centre on behalf of the U.K. Particle Physics and Astronomy Research Council. We are grateful to Chris Davis for kindly helping us to obtain the data through the UKIRT service programme. We thank Zhaohui Shang and Beverley Wills for providing the electronic data of their spectra for calibrating our data. We thank the Department of Physical Sciences, University of Hertfordshire for providing IRPOL2 for the UKIRT. This research has made use of the NASA/IPAC Extragalactic Database (NED) which is operated by the Jet Propulsion Laboratory, California Institute of Technology, under contract with the National Aeronautics and Space Administration. This research has also made use of the SIMBAD database, operated at CDS, Strasbourg, France. The work by OB was supported in part by NSF grant AST-0307657.
References
- Antonucci (1988) Antonucci, R. 1988, in Supermassive Black Holes, ed. M. Kafatos (Cambridge: Cambridge Univ. Press), 26
- Antonucci & Barvainis (1990) Antonucci R., Barvainis R., 1990, ApJ, 363, L17
- Antonucci (1999) Antonucci, R. 1999, in High Energy Processes in Accreting Black Holes, ASP Conf. Ser. 161, 193
- Antonucci (1993) Antonucci R., 1993, ARA&A, 31, 473
- Berriman et al. (1990) Berriman, G., Schmidt, G. D., West, S. C., Stockman, H. S., 1990, ApJS, 74, 869
- Bonning et al. (2005) Bonning E. W., Shields G. A., Salviander S., McLure R. J., 2005, ApJ, 626, 89
- Brindle et al. (1990) Brindle C., Hough J. H., Bailey J. A., Axon D. J., Ward M. J., Sparks W. B., McLean I. S., 1990, MNRAS, 244, 604
- Brown & McLean (1977) Brown, J. C, McLean, I. S., 1977, A&A, 57, 141
- Cardelli, Clayton, & Mathis (1989) Cardelli J. A., Clayton G. C., Mathis J. S., 1989, ApJ, 345, 245
- Cohen et al. (1999) Cohen M. H., Ogle P. M., Tran H. D., Goodrich R. W., Miller J. S., 1999, AJ, 118, 1963
- di Serego Alighieri et al. (1996) di Serego Alighieri S., Cimatti A., Fosbury R. A. E., Perez-Fournon I., 1996, MNRAS, 279, L57
- Fernini et al. (1993) Fernini I., Burns J. O., Bridle A. H., Perley R. A., 1993, AJ, 105, 1690
- Goodrich & Miller (1988) Goodrich, R. W., Miller, J. S. 1988, ApJ, 331, 332
- Goodrich & Miller (1994) Goodrich R. W., Miller J. S., 1994, ApJ, 434, 82
- Goodman (2003) Goodman J., 2003, MNRAS, 339, 937
- Heiles (2000) Heiles C., 2000, AJ, 119, 923
- Hubeny et al. (2000) Hubeny, I., Agol, E., Blaes, O., Krolik, J. H., 2000, ApJ, 533, 710
- Hubeny et al. (2001) Hubeny, I., Blaes, O., Krolik, J. H., Agol, E., 2001, ApJ, 559, 680
- Hurt et al. (1999) Hurt T., Antonucci R., Cohen R., Kinney A., Krolik J., 1999, ApJ, 514, 579
- Jackson & Rawlings (1997) Jackson N., Rawlings S., 1997, MNRAS, 286, 241
- Jannuzi & Elston (1991) Jannuzi B. T., Elston R., 1991, ApJ, 366, L69
- Kaspi et al. (2005) Kaspi S., Maoz D., Netzer H., Peterson B. M., Vestergaard M., Jannuzi B. T., 2005, ApJ, 629, 61
- Kishimoto et al. (2001) Kishimoto M., Antonucci R., Cimatti A., Hurt T., Dey A., van Breugel W., Spinrad H., 2001, ApJ, 547, 667
- Kishimoto et al. (2003) Kishimoto M., Antonucci R., Blaes O., 2003, MNRAS, 345, 253
- Kishimoto et al. (2004) Kishimoto M., Antonucci R., Boisson C., Blaes O., 2004, MNRAS, 354, 1065
- Koratkar & Blaes (1999) Koratkar, A., Blaes, O. 1999, PASP, 111, 1
- Korhonen & Reiz (1986) Korhonen T., Reiz A., 1986, A&AS, 64, 487
- Laing (1981) Laing R. A., 1981, MNRAS, 195, 261
- Laing et al. (1994) Laing R. A., Jenkins C. R., Wall J. V., Unger S. W., 1994, ASPC, 54, 201
- Malkan (1983) Malkan M. A., 1983, ApJ, 268, 582
- Malkan (1989) Malkan M., 1989, in Theory of Accretion Disks, Proceedings of a NATO Advanced Research Workshop, ed. F. Meyer (Dordrecht: Kluwer), 19
- Moore & Stockman (1984) Moore R. L., Stockman H. S., 1984, ApJ, 279, 465
- (33) Miller, J. S., Robinson, L. B., Goodrich, R. W., 1988, in Instrumentation for Ground-Based Astronomy, ed. L. B. Robinson (New York, Springer), p. 157
- Morganti, Killeen, & Tadhunter (1993) Morganti R., Killeen N. E. B., Tadhunter C. N., 1993, MNRAS, 263, 1023
- Reid, Kronberg, & Perley (1999) Reid R. I., Kronberg P. P., Perley R. A., 1999, ApJS, 124, 285
- Rusk & Seaquist (1985) Rusk R., Seaquist E. R., 1985, AJ, 90, 30
- Shang et al. (2003) Shang Z., Wills B. J., Robinson E. L., Wills D., Laor A., Xie B., Yuan J., 2003, ApJ, 586, 52
- Shields (1978) Shields G. A., 1978, Natur, 272, 706
- Sitko & Zhu (1991) Sitko M. L., Zhu Y., 1991, ApJ, 369, 106
- Simmons & Stewart (1985) Simmons J. F. L., Stewart B. G., 1985, A&A, 142, 100
- Smith, Schmidt, & Allen (1993) Smith P. S., Schmidt G. D., Allen R. G., 1993, ApJ, 409, 604
- Smith et al. (2002) Smith, J. E., Young, S., Robinson, A., Corbett, E. A., Giannuzzo, M. E., Axon, D. J., Hough, J. H. 2002, MNRAS, 335, 773
- Smith et al. (2005) Smith J. E., Robinson A., Young S., Axon D. J., Corbett E. A., 2005, MNRAS, 359, 846
- Smith et al. (2004) Smith J. E., Robinson A., Alexander D. M., Young S., Axon D. J., Corbett E. A., 2004, MNRAS, 350, 140
- Stockman, Angel, & Miley (1979) Stockman H. S., Angel J. R. P., Miley G. K., 1979, ApJ, 227, L55
- Stockman et al. (1984) Stockman, H. S., Moore, R. L., Angel, J. R. P. 1984, ApJ, 279, 485
- Stockton & MacKenty (1987) Stockton A., MacKenty J. W., 1987, ApJ, 316, 584
- Tokunaga & Vacca (2005) Tokunaga A. T., Vacca W. D., 2005, PASP, 117, 421
- Ulvestad & Antonucci (1988) Ulvestad J. S., Antonucci R. R. J., 1988, ApJ, 328, 569
- Whittet et al. (1992) Whittet D. C. B., Martin P. G., Hough J. H., Rouse M. F., Bailey J. A., Axon D. J., 1992, ApJ, 386, 562
- Wills et al. (1992) Wills, B. J., Wills, D., Breger, M., Antonucci, R. R. J., Barvainis, R. 1992, ApJ, 398, 454
- Young et al. (1998) Young S., Hough J. H., Axon D. J., Fabian A. C., Ward M. J., 1998, MNRAS, 294, 478
- Young et al. (1999) Young, S., Corbett, E. A., Giannuzzo, M. E., Hough, J. H., Robinson, A., Bailey, J. A., Axon, D. J. 1999, MNRAS, 303, 227