Spitzer IRS spectroscopy of 3CR radio galaxies and quasars: Testing the unified schemes
With the Spitzer Space Telescope Infrared Spectrograph (IRS) we have observed seven powerful FR 2 radio galaxies and seven quasars. Both samples, the galaxies and the quasars, are comparable in isotropic 178 MHz luminosity (1026.5 W/Hz P 1029.5 W/Hz) and in redshift range (). We find for both samples similar distributions in the luminosity ratios of high- to low-excitation lines ([NeV]14.3μm / [NeII]12.8μm) and of high-excitation line to radio power ([NeV]24.3μm / P). This solves the long debate about the apparent difference of quasars and radio galaxies in favor of the orientation-dependent unified schemes. Furthermore, the luminosity ratio [OIII]500.7nm / [OIV]25.9μm of most galaxies is by a factor of ten lower than that of the quasars. This suggests that the optical emission from the central NLR is essentially absorbed (AV 3) in the powerful FR 2 galaxies and that the [OIII]500.7nm luminosity does not serve as isotropic tracer for testing the unified schemes.
Key Words.:
Galaxies: active – Galaxies: nuclei – Galaxies: quasars: general – Infrared: galaxies1 Introduction
According to the orientation-dependent AGN unified schemes both the powerful FR 2 radio galaxies and the quasars are believed to belong to the same parent population (Barthel 1989) with their observed properties depending on our viewing angle towards the obscuring dust torus (Antonucci 1993). First evidence for this hypothesis was provided by spectro-polarimetric observations in those galaxies with ”edge-on” torus, where scattering particles located above and below the dust torus allow for viewing the AGN-typical broad spectral lines of the central region (e.g. Antonucci 1984). In general a proper test of the unification is best performed by observations of isotropic quantities, which are not affected by orientation-dependent extinction or beaming. Since the fraction of the nuclear luminosity that is absorbed by dust must be re-radiated in the infrared, the optically thin far-infrared (FIR, 40-1000 m) emission is such an isotropic measure. From sensitive photometry with the ISO satellite one found similar isotropic FIR dust luminosities for radio galaxies and quasars from the 3CR catalogue, after normalisation by their likewise isotropic 178 MHz radio power (Meisenheimer et al. 2001, Haas et al. 2004). The distributions showed a large dispersion, which may be caused by the various evolutionary stages of these complex sources, and it is still under debate whether the FIR luminosity arises from starbursts rather than from the AGN itself.
Both the radio galaxies and the quasars are luminous mid-infrared (MIR, 10-40 m) emitters, and the mid- to far-infrared luminosity ratio of the 3CR sources exceeds that of pure starburst galaxies; but the radio galaxies show a lower LMIR / LFIR than quasars (Haas et al. 2004, Siebenmorgen et al. 2004). Either the emission from the putative dust torus is optically thick even at MIR wavelengths (Pier & Krolik 1993) - hence not isotropic -, or the intrinsic AGN luminosities are different supporting modifications of the orientation-dependent unification such as the receding torus model (Lawrence 1991). Further objections against the pure orientation-dependent unification come from the lower [OIII]500.7nm / P luminosity ratios of galaxies, assuming that most of the [OIII]500.7nm emission arises from the extended narrow line region not affected by central extinction.


The high- and low-excitation MIR spectral lines suffer from much less extinction than optical ones. Therefore, we observed 7 quasars (and BLRGs) and 7 radio galaxies from the 3CR catalogue. First results from this sample on the discovery of 10 m silicate emission in quasars have already been presented by Siebenmorgen et al. (2005). Here, we focus on the investigation of the emission lines.
2 Sample selection and Observations
The steep radio spectrum quasars and powerful galaxies were randomly selected from the 3CR catalogue, so that the samples match in 178 MHz luminosity as well as in redshift. Note that we do not consider FR 1 or low-power FR 2 sources, since for them the orientation-dependent unification picture may not apply. Thus, any conclusions drawn here refer to FR 2 sources with 1026.5 W/Hz P 1029.5 W/Hz and .
More specifically, the sources were selected from that sub-sample of the 3CR catalogue which (1) was not reserved by guarantee time observations and (2) was observed by ISO with sufficient S/N (Haas et al. 2004, Siebenmorgen et al. 2004) in order to provide the flux estimates required for carefully planning the Spitzer IRS observations. This ”ISO subset” provides a fairly representative sub-sample of the 3CR catalogue, since the objects varied widely in apparent brightness and the selection criteria for the sources were low cirrus foreground and good visibility to the satellite. Thus, we do not expect that the targets selected for our Spitzer IRS observations are biased in favour of MIR-loud 3CR sources.
The objects were observed between 5 and 35 m with the infrared spectrograph (IRS, Houck et al. 2004) of the Spitzer Space Telescope (Werner et al. 2004) in the two IRS low-resolution (64 / 128) modules in staring mode. Our analysis starts with the two dimensional data frames from the Spitzer pipeline (Higdon et al. 2004) using the latest calibration files. At this point, the major instrumental effects have already been removed. We subtracted the sky background, using pairs of frames, where the source appears at two different positions along the spectrometer slit. We interactively extracted the one dimensional spectra. Before averaging, parts with low reproducibility between integrations were discarded.
3 Results and Discussion
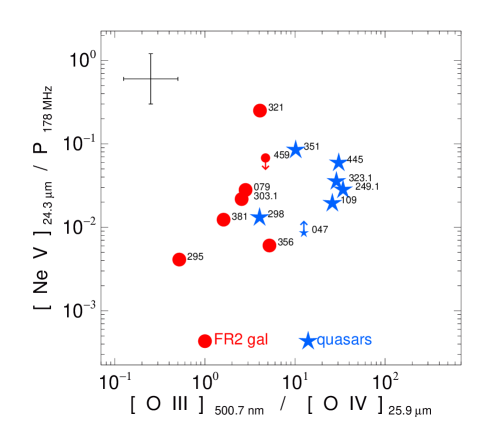
Figure 1 depicts the IRS spectra shifted to the object rest frames. The spectra show numerous emission lines as superposed on diverse continuum shapes, caused by various hot and warm dust components, and the broad silicate features around 10 and 18 m. The silicate features are typically seen in absorption for the galaxies (e.g. in 3C 079, 3C 303.1, 3C 321, 3C 459) and in emission for the quasars (e.g. in 3C 109, 3C 249.1, 3C 323.1, 3C 351). Also in the NIR (3-10 m) shortward of 7 m the continuum shows a typical difference between galaxies and quasars: in quasars it is steeply rising with decreasing wavelength while in galaxies it is flat or declining. From both the different silicate features and the bluer NIR continuum of quasars we suggest that the reported difference of the LMIR/LFIR ratio (L10-40μm/L40-1000μm) is in fact caused by suppression of the MIR continuum in galaxies and by its enhancement in quasars.
| object | type | z | DL | [Ne VI] | [S IV] | [Ne II] | [Ne V] | [Ne III] | [S III] | [Ne V] | [O IV] | [O III] | P178MHz |
|---|---|---|---|---|---|---|---|---|---|---|---|---|---|
| Mpc | 7.6 m | 10.5 m | 12.8 m | 14.3 m | 15.5 m | 18.7 m | 24.3 m | 25.9 m | 500.7 nm | ||||
| 126.2 eV | 34.8 eV | 21.6 eV | 97.1 eV | 41.0 eV | 23.3 eV | 97.1 eV | 54.9 eV | 35.1 eV | |||||
| 3C 079 | N | 0.256 | 1283 | 34.02 | 34.19 | 34.12 | 34.36 | 34.60 | 34.37 | 34.53 | 35.14 | 35.59 | 36.08 |
| 3C 295 | N | 0.461 | 2559 | 34.28 | 34.33 | 34.64 | 34.76 | 34.62 | 34.78 | 34.99 | 37.15 | ||
| 3C 303.1 | N | 0.267 | 1347 | 33.76 | 34.04 | 33.92 | 33.65 | 34.22 | 33.53 | 33.89 | 34.31 | 34.71 | 35.55 |
| 3C 321 | N | 0.096 | 435 | 33.77 | 33.90 | 33.43 a | 34.19 | 34.11 | 33.73 | 34.16 | 34.64 | 35.25 | 34.76 |
| 3C 356 | N | 1.079 | 7296 | 34.74 | 34.68 | 35.05 | 34.49 | 36.28 | 37.27 | ||||
| 3C 381 | N | 0.160 | 758 | 33.74 | 33.41 | 33.62 | 33.60 | 33.96 | 33.92 | 33.43 | 34.19 | 34.40 | 35.34 |
| 3C 459 | N | 0.220 | 1081 | 34.51 | 34.36 | 34.30 | 34.02 | 34.51 | 34.47 | 35.14 | 35.85 | ||
| 3C 047 | Q | 0.425 | 2322 | 34.53 | 34.67 b | 36.28 | 36.56 | ||||||
| 3C 109 | B | 0.306 | 1577 | 34.61 | 34.50 | 33.94 | 34.30 | 34.52 | 33.89 | 34.41 | 34.91 | 36.32 | 36.12 |
| 3C 249.1 | Q | 0.311 | 1607 | 34.57 | 33.98 | 34.46 | 34.63 | 34.00 | 34.28 | 34.86 | 36.39 | 35.83 | |
| 3C 298 | Q | 1.436 | 10427 | 36.19 | 36.29 | 35.93 | 36.36 | 37.30 c | 38.24 | ||||
| 3C 323.1 | Q | 0.264 | 1329 | 34.35 | 34.51 | 34.39 | 34.13 | 34.38 | 34.49 | 34.10 | 34.56 | 36.02 | 35.61 |
| 3C 351 | Q | 0.371 | 1975 | 34.67 | 34.66 | 35.01 | 34.99 | 34.80 | 35.06 | 36.46 | 36.13 | ||
| 3C 445 | B | 0.056 | 247 | 33.05 | 33.56 | 33.32 | 33.29 | 33.63 | 35.11 | 34.52 |
a line between two channels, b line on edge of channel,
c adopting L([OIII]) = 0.1 L(total Hα) from the mean SDSS quasar template (Vanden Berk et al. 2005)
The spectra show AGN-typical high-excitation lines like [Ne V]14.3μm, [Ne V]24.3μm and [O IV]25.9μm, as well as low-excitation lines like [Ne II]12.8μm and [S III]18.7μm. Table 1 lists the line luminosities. We estimate the uncertainty of the line fluxes from the subtraction of the underlying noisy continuum to 40%; combined with the absolute flux calibration uncertainty of 20% this results in a total line flux uncertainty of 50% which is sufficient for the conclusions drawn here. In order to compare the two samples by means of representative lines, when such a line is unobserved or poorly measured, we substitute it by another one of similar (or higher) ionisation potential with appropriately scaled strength determined from average line ratios: [Ne II]12.8μm by [S III]18.7μm, [Ne V]24.3μm by [Ne V]14.3μm (and vice versa), and [O IV]25.9μm by 3 [Ne V]24.3μm. This leaves the scatter in the line ratios below a factor of two.
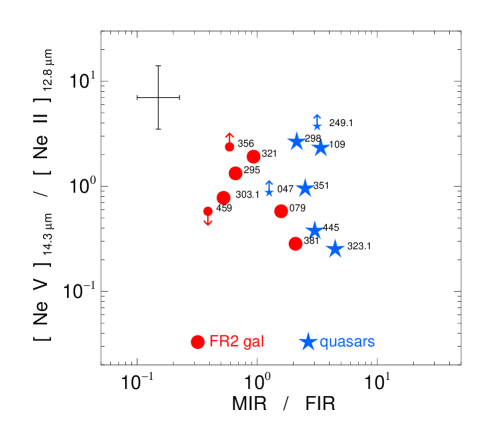
Figure 2 displays the [NeV]14.3μm / [NeII]12.8μm luminosity ratio versus LMIR / LFIR. While the radio galaxies show on average a lower LMIR / LFIR value than the quasars (by a factor 3), the distribution of [NeV]14.3μm / [NeII]12.8μm is strikingly similar for both samples: The logarithmically determined mean of the [NeV] / [NeII] ratios (and in bracketts the rms expressed as factor around this mean) are 1.1 (2.8) and 0.9 (2.1) for the quasars and galaxies, respectively. Furthermore, the [NeV]14.3μm / [NeII]12.8μm values are much higher (by a factor 100) than those found for starburst galaxies (Sturm et al. 2002), placing also the FR 2 galaxies clearly in the AGN dominated range. We find also similar results using other lines, e.g. [NeVI]7.6μm, [NeIII]15.5μm, [SIV]10.5μm.
If the unification between powerful galaxies and quasars is correct, then the ratio of central AGN luminosity to isotropic radio lobe power should be similar for both types. Fig. 3 (vertical axis) shows the luminosity ratio [NeV]24.3μm / P. Again, the distributions look similar for both samples: The logarithmically determined mean of the ratios (and in bracketts the rms expressed as factor around this mean) are 0.027 (2.2) and 0.023 (4.1) for the quasars and galaxies, respectively. This suggests that the galaxies possess intrinsic AGN luminosities similar to those of the quasars. It provides direct spectroscopic evidence in favour of the unified schemes.
How can these results be reconciled with the fact found by many authors, that galaxies show a ten times lower [OIII]500.7nm / P luminosity ratio than quasars? Does optical extinction play a role as proposed by e.g. Jackson & Browne (1990), Hes et al. (1996), Baker (1997) and di Serego Alighieri et al. (1997), or do galaxies possess a weaker central powerhouse suggested by e.g. Lawrence (1991) and Grimes et al. (2004)? We can now test these two possibilities using the [OIV]25.9μm line: it has a higher ionisation potential than the optical [OIII]500.7nm line, but is 50 times less affected by extinction. If the galaxies had intrinsically weaker AGN and hence weaker radiation fields, then one expects their [OIII]500.7nm / [OIV]25.9μm ratios to be higher than for quasars. However, this is not the case, rather we find the opposite as shown in Fig. 3 (horizontal axis). The galaxies exhibit a lower [OIII]500.7nm / [OIV]25.9μm luminosity ratio than all but one of the quasars. For this one quasar (3C 298) the [OIII]500.7nm is highly uncertain, since extrapolated from the total (broad and narrow line) Hα luminosity (Tab. 1). The logarithmically determined mean of the [OIII] / [OIV] ratios (and in bracketts the rms expressed as factor around this mean) are 16.9 (2.2) and 2.5 (2.2) for the quasars and galaxies, respectively, hence the distributions are different at more than 5. Therefore we suggest that the galaxies suffer from substantial [OIII]500.7nm extinction (AV 3), at least in the central regions and that most of the - in principle extended - NLR [OIII]500.7nm luminosity originates from the central part. This result questions the former use of the [OIII]500.7nm emission as isotropic tracer for testing the unified schemes, in particular for establishing the receding torus model. As proposed by Haas et al. (2004), it seems that not only the inner radius, but also the height of the torus increases with growing luminosity.
In contrast to our high luminosity 3CR objects, for Seyfert galaxies the luminosity ratio [OIII]500.7nm/FIR is the same for type 1 and type 2 when the objects are selected by LFIR with a 25m/60m colour criterion (Keel et al. 1994, Fig 3). This suggests that the [OIII]500.7nm emission is isotropic for those objects of relatively low luminosity. On the other hand, the mostly radio-quiet Sloan AGN seem to indicate that the ratio of type 1s to type 2s increases with luminosity, when selected by [OIII]500.7nm (Simpson 2005). This result can be qualitatively explained in the context of the unified model without recourse to a luminosity-dependent torus opening angle if the [OIII]500.7nm emission is anisotropic at high intrinsic optical/UV luminosity. For the radio galaxies, if the [OIII]500.7nm emission is mostly hidden, then relative to the broad lines it should be almost as strong in polarised flux as in total flux. Notably in three of five narrow-line radio galaxies (), di Serego Alighieri et al. (1997) found polarised [OIII]500.7nm emission.
One source (the anomalous object 3C 459) has only rather high upper limits in the high-excitation [NeV] lines, which are still consistent with the unification. Its continuum is probably mostly starlight from a post-starburst population (Miller 1981). Also, though classified as an NLRG here, some authors claim to have detected broad lines (see the ”notes” in NED). Notably, its IRS spectrum exhibits excited molecular hydrogen emission (H2 S(1) at 17.03m and H2 S(3) at 9.67m with luminosities of 1033.78 W and 1034.34 W, respectively) - to our knowledge the first such detection in a powerful FR 2 radio galaxy. Compared with [OIV]25.9μm and P this source shows also an FIR luminosity excess (Haas et al. 2004). Since 3C 459 is a compact steep spectrum radio source, we suggest that the excited molecular hydrogen emission originates from shocks due to the probably young expanding jet.
On the other hand, it is worth to note that the radio galaxy 3C 295 with a very low LFIR / P (Meisenheimer et al. 2001) lies still at the low end of the [Ne V] / P distribution, but has a rather intermediate [Ne V] /[Ne II] ratio; this indicates that despite the AGN-typical line ratio 3C 295 has exceptionally bright radio lobes possibly caused by a special evolution or environment as suggested by Haas et al. (2004).
Clearly, our data set is small and the results should finally be corroborated by larger samples from the entire Spitzer IRS data base. Nevertheless, since there are at most one (15%) or two outliers in the distributions (Figures 2 & 3), the conclusions drawn from our 27 objects may be generalized to 85% or at least 70% of the entire 3CR sources, i.e. the steep radio spectrum quasars and powerful galaxies with 1026.5 W/Hz P 1029.5 W/Hz and . Also, the dispersion in the distributions is still large and needs to be explored further, possibly allowing for recognizing evolutionary trends among these complex sources.
Acknowledgements.
This work is based on observations with the Spitzer Space Telescope operated by the JPL, Caltech, under contract with NASA. This research was supported by the Nordrhein-Westfälische Akademie der Wissenschaften. We thank the referee Robert Antonucci for his inspiring comments.References
- (1) Antonucci R.R.J., 1984, ApJ 278, 499
- (2) Antonucci R.R.J., 1993, Ann. Rev. Astron. Astrophys. 31, 473
- (3) Baker J., 1997, MNRAS 286, 23
- Barthel (1989) Barthel P.D., 1989, ApJ 336, 606
- (5) Boroson T.A., Oke J.B., 1984, ApJ 281, 535
- (6) di Serego Alighieri S., Cimatti A., Fosbury R., Hes R. 1997, A&A 328, 510
- (7) Grimes J., Rawlings S., Willott C. 2004, MNRAS 349, 503
- (8) Haas M., Müller S., Bertoldi F. et al. 2004, A&A, 424, 531
- (9) Hes R., Barthel P.D., Fosbury R., 1996, A&A 313, 423
- (10) Higdon S., Devost D., Higdon J. et al. 2004, PASP, 116, 975
- (11) Hirst P, Jackson N., Rawlings S., 2003, MNRAS 346, 1009
- (12) Houck J.R., Roellig T.L., van Cleve et al. 2004, ApJS, 154, 18
- (13) Jackson N., Browne I.W.A., 1990, Nature 343, 43
- (14) Keel W., de Grijp M., Miley G., Zheng W. 1994, A&A 283, 791
- (15) Lawrence A., 1991, MNRAS 252, 586
- (16) Mc Carthy P., Spinrad H., van Breugel W. 1995, ApJS 99, 27
- (17) Meisenheimer K., Haas M., Müller et al. 2001, A&A 372, 719
- (18) Miller J.S., 1981, PASP 93, 681
- (19) Pier, E.A., Krolik, J.H. 1993, ApJ 418, 673
- (20) Siebenmorgen R., Freudling, Krügel, Haas, 2004, A&A 421, 129
- (21) Siebenmorgen R., Haas M., Krügel, Schulz 2005, A&A 436, L5
- (22) Simpson C., 2005, MNRAS 360, 565
- (23) Sturm E., Lutz D., Verma A., et al., 2002 A&A 393, 821
- (24) Tadhunter C., Morganti R., et al. 1993, MNRAS 263, 999
- (25) Vanden Berk D., Richards G., et al. 2001, AJ 122, 549
- (26) Werner M., Roellig T., Low F., et al. 2004, ApJS, 154, 1