A study of the B and Be star population in the field of the LMC open cluster NGC2004 with VLT-FLAMES
Observations of hot stars belonging to the young cluster LMC-NGC2004 and its surrounding region have been obtained with the VLT-GIRAFFE facilities in MEDUSA mode. 25 Be stars were discovered; the proportion of Be stars compared to B-type stars is found to be of the same order in the LMC and in the Galaxy fields. 23 hot stars were discovered as spectroscopic binaries (SB1 and SB2), 5 of these are found to be eclipsing systems from the MACHO database, with periods of a few days. About 75% of the spectra in our sample are polluted by hydrogen (H and H), [S ii] and [N ii] nebular lines. These lines are typical of H ii regions. They could be associated with patchy nebulosities with a bi-modal distribution in radial velocity, with higher values (+335 km s-1) preferentially seen inside the southern part of the known bubble LMC4 observed in H i at 21 cm.
Key Words.:
Stars: early-type – Stars: emission-line, Be – Galaxies: Magellanic Clouds – Stars: binaries: spectroscopic – Stars: binaries: eclipsing – ISM: nebular lines and bands1 Introduction
The origin of the Be phenomenon, i.e. periods of spectral emission due to the presence of a circumstellar envelope around Be stars, is still debated. Fast rotation seems to be a major factor in triggering this phenomenon. To understand the Be phenomenon, it is important to know at which phase of stellar evolution on the main sequence (MS) it appears. According to a statistical study of Be stars in clusters, Fabregat & Torrejón (2000) concluded that it may occur in the second half of the MS phase. Taking into account effects due to fast rotation, Zorec (2004) concluded that the appearance of the Be phenomenon among field early-type stars is probably mass-dependent and that it may appear at any time during the MS phase. However, according to Maeder & Meynet (2000), during the MS evolution rotational speed rises in terms of critical velocity fraction (), on the one hand, and stellar rotation is faster as the metallicity of the protostellar clouds is lower, on the other hand. Thus, the formation of rapid rotators and consequently of Be stars is favoured in regions of low metallicity. Moreover, the increase of speed in during the MS evolution also favours the formation of rapid rotators, and consequently of Be stars, at the later MS stages.
To investigate this issue and to determine the evolutionary state of Be stars, (i) fundamental parameters of B and Be star populations located in regions of different metallicity must be obtained, and (ii) the specific properties of emission lines need to be determined. The new instrumentation FLAMES-GIRAFFE installed at the VLT is particularly well suited to obtain the medium resolution spectra of large samples of B and Be stars, in low metallicity regions such as the Magellanic Clouds that are needed to achieve these goals.
In this first paper we present an overview of spectroscopic results for 176 early-type stars observed in LMC NGC2004 and its surrounding field with VLT-FLAMES. The observations and the reduction process are described in Sect. 2. In Sect. 3 we present the detection of new Be stars (Sect. 3.1), a study of nebular lines (hydrogen, [N ii] and [S ii]) that pollute the stellar spectra and apparently originate from filamentary gaseous structures (Sect. 3.2), and the discovery of spectroscopic binaries (Sect. 3.3). Results are summarized in Sect. 4.
2 Observations and reduction
To obtain spectra of a significant sample of the B star population in the young cluster LMC NGC2004 and its surrounding field, we made use of the ESO VLT-FLAMES facilities, as part of the Guaranteed Time Observation programs of the Paris Observatory (P.I.: F. Hammer). The multifibres spectrograph VLT-FLAMES was used in MEDUSA mode (132 fibres) at medium resolution.
The use of the setup LR02 (396.4–456.7nm, hereafter blue spectra) is intended for determination of fundamental parameters, while the LR06 setup (643.8–718.4 nm, hereafter red spectra) is used to identify Be stars and to study the H line emission characteristics. Spectral resolution is 6400 for LR02 and 8600 for LR06. Observations (ESO runs 72.D-0245B and 73.D-0133A) were carried out in 2003 on November 24 (blue spectra) and 28 (red spectra) and in 2004 on April 12 (blue spectra) and 14 (red spectra). The observational seeing ranged from 0.4 to 0.8.
Observations with the VLT-FLAMES facilities are performed with blind pointing and therefore require very accurate astrometric data (better than 0.3) for correct positioning of the thin fibres ( = 1.2) on the targets. To identify B-type stars in the selected field and to obtain their position with the requested accuracy we used the EIS pre-FLAMES (LMC33) survey images provided by ESO (see http://www.eso.org/science/eis/eis_home.html). For all the sources extracted from EIS images, the astrometric and photometric data were extracted with the SExtractor software (Bertin & Arnouts 1996).
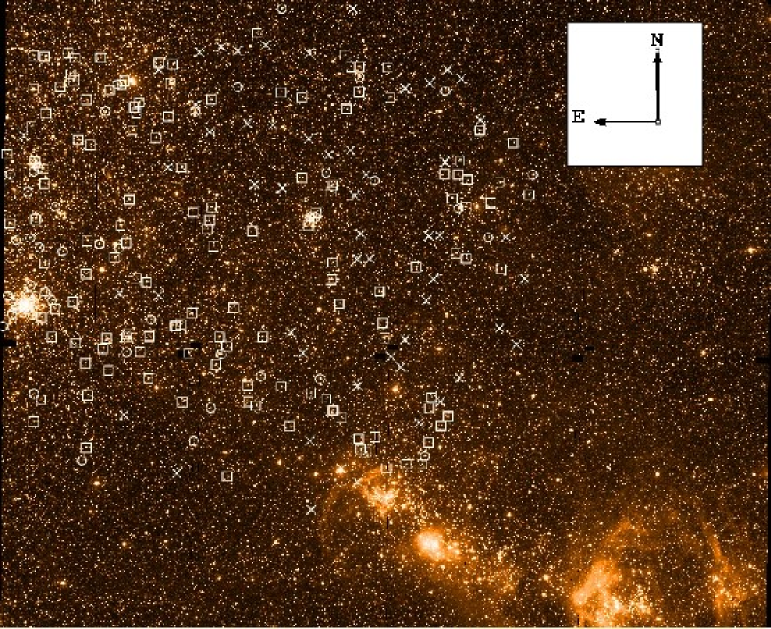
The accuracy of B and V magnitude determination is 0.2 mag. B-type candidates were pre-selected with 14 V 18 and a colour index BV 0.35, keeping in mind the intrinsic value E(B-V)=0.1 (Keller 1999) for the LMC. In addition, we chose to observe a list of known Be stars from Keller et al. (1999). All our stellar and sky fibre targets are plotted in Fig. 1.
A sample of 177 stars was observed within the two observing runs. 25 sky spectra were simultaneously obtained. 16 stars that were found to have variable radial velocity (RV) in a 4-day interval in November 2003 were observed again in April 2004.
As the V magnitude of the selected targets ranges from 13.7 to 17.8 mag, we chose a 2 and 1.5-hour integration time for the setups LR02 and LR06 respectively. This corresponds to a signal to noise ratio S/N 120 in the blue spectral range and 80 in the red spectral range for stars with V 16.4 mag. Under these conditions the S/N ratio of spectra obtained in the blue region varies from 20 for the fainter objects to 150 for the brighter ones.
Bias, flat-fields and wavelength calibration exposures (ThAr) were obtained for each stellar exposure and used to reduce the spectra. The data reduction was performed with the dedicated software GIRBLDRS developed at the Geneva Observatory (see http://girbldrs.sourceforge.net) and several tasks of the IRAF111IRAF is distributed by the National Optical Astronomy Observatories, which is operated by the Association of Universities for Research in Astronomy (AURA), Inc., under cooperative agreement with the National Science Foundation. package for extraction, calibration and sky correction of the spectra were also used.
The observed field (25′ in diameter) is centered at (2000) = 05h 29min 00s and (2000) = 67∘ 14 00. Besides the young cluster NGC 2004, this field contains several high-density groups of stars (KMHK943, 971, 963, 991, 988 and BSDL 2001). It also includes the southern part of the LMC4 (SGS 11) H i supergiant shell (Bica et al. 1999) and the northern extension of the H ii region LHA 120-N 51A. The rim of LMC4 is spotted with H ii regions rich in young stars and OB associations (Domgörgen et al. 1995).
3 Results
From the VLT-FLAMES observations with the setups LR02 and LR06 we confirm the B spectral type for 168 of the 177 observed stars. Of the remaining 9 objects, 6 are O stars (presence of strong He ii lines), 2 are A stars and 1 is a cool star.
After subtraction of the sky line contribution, it appeared that the spectra of more than two thirds of the 177 stars, as well as the totality of the sky spectra, are contaminated by nebular lines. This contamination is particularly visible in the H line. Depending on the intensity level of the nebular H line, a weak nebular contribution can also be detected in the H and H line profiles, as well as forbidden lines of [N ii] at 6548 and 6583 Å and [S ii] at 6717 and 6731 Å. When the nebular H line is very strong, a narrow emission component can also be observed in the He i line at 6678 Å. Thus, in order to produce a robust identification of stars with the Be phenomenon, we have to disentangle the circumstellar (CS) line emission component from emission produced by nebular line in polluted spectra.
3.1 Be stars
Up to now most Be stars in the LMC have been investigated with photometric surveys. In particular, Keller et al. (1999, 2000) detected numerous Be stars in NGC2004 with broad band photometry and a specific narrow filter centered at H. In this paper, medium resolution spectroscopy of Be stars in the field of NGC2004 in the LMC is presented for the first time.
Among the 25 known Be stars, called KWBBe in Keller et al. (1999), we confirm the Be character of 22 stars. However, the stars KWBBe554, KWBBe993 and KWBBe1169 did not present emission in the H line at the epochs of our observations, which could be due to the transient nature of the Be phenomenon. The stars KWBBe203 and KWBBe287, showing a discrepancy between blue and red radial velocities in November 2003, were again observed in April 2004. Both stars display conspicuous variation in the intensity of H over 5 months (see Table 1).
Moreover, among the B-type stars observed, 25 objects were found to be new Be stars (MHFBe in Table 1). This raises the total of Be stars in our sample to 47. Of this sample of Be stars, the H emission line is single-peaked for 19 objects and double-peaked for 28 objects, while 12 of the latter are shell stars (after correction of the nebular contribution in the H line profile). 26 Be stars show Fe ii in emission and 9 show red He i lines at 6678 and 7065 Å in double emission (see Table 1).
| Star | V | EW | Imax | I(V) | I(R) | FWHM | Remarks | ||
|---|---|---|---|---|---|---|---|---|---|
| (2000) | (2000) | Å | (km s-1) | ||||||
| KWBBe44 | 05 30 45.049 | -67 14 26.13 | 13.7 | 30.94 | 7.31 | 180 | (CS+neb), Fe ii | ||
| KWBBe75 | 05 30 37.690 | -67 17 39.50 | 14.4 | 65.48 | 12.97 | 246 | cl, (CS+neb), He i, Fe ii | ||
| KWBBe91 | 05 30 44.284 | -67 17 22.71 | 14.4 | 34.64 | 5.94 | 284 | cl, (CS+neb), Fe ii | ||
| KWBBe152 | 05 30 24.391 | -67 14 55.49 | 15.6 | 68.92 | 10.16 | 331 | noneb, Fe ii | ||
| KWBBe171 | 05 30 36.340 | -67 16 51.00 | 15.5 | 16.31 | 2.92 | 2.90 | 350 | cl, noneb, He i | |
| KWBBe177 | 05 30 39.582 | -67 16 49.52 | 15.3 | 21.84 | 2.75 | 2.41 | 492 | cl, sh?, CS+neb, He i, Fe iiw | |
| KWBBe203 | 05 30 48.703 | -67 16 49.31 | 15.3 | 41.96 | 7.76 | 264 | cl, (CS+neb), Fe ii | ||
| 15.3 | 47.79 | 8.61 | 261 | ||||||
| KWBBe276 | 05 29 59.358 | -67 14 46.48 | 15.8 | 51.45 | 6.06 | 6.36 | 406 | sh, (CS+neb), Fe ii | |
| KWBBe287 | 05 30 08.074 | -67 14 36.25 | 15.8 | 42.58 | 7.05 | 4.93 | sh, noneb, bin, Fe ii | ||
| 15.8 | 36.06 | 6.07 | 4.92 | ||||||
| KWBBe323 | 05 30 31.976 | -67 16 40.26 | 16.2 | 49.69 | 8.55 | 264 | cl, (CS+neb), Fe ii | ||
| KWBBe342 | 05 30 38.630 | -67 16 23.00 | 16.0 | 19.14 | 2.80 | 2.91 | 394 | cl, noneb | |
| KWBBe344 | 05 30 38.859 | -67 14 21.13 | 15.9 | 34.53 | 6.89 | 240 | noneb, Fe ii | ||
| KWBBe347 | 05 30 39.900 | -67 12 21.01 | 16.0 | 15.96 | 2.38 | 2.37 | 451 | noneb | |
| KWBBe374 | 05 30 47.799 | -67 11 36.43 | 16.4 | 33.42 | 435 | CS+neb | |||
| KWBBe579 | 05 30 27.610 | -67 13 0.209 | 16.5 | 39.51 | 4.83 | 4.74 | 445 | cl, sh, (CS+neb), Fe ii | |
| KWBBe622 | 05 30 36.223 | -67 13 27.70 | 16.9 | 21.48 | 4.49 | 4.77 | 334 | (CS+neb)? | |
| KWBBe624 | 05 30 37.040 | -67 21 02.62 | 16.7 | 43.33 | 6.13 | 5.58 | 407 | sh, noneb, Fe iiw | |
| KWBBe874 | 05 29 55.846 | -67 19 14.26 | 17.5 | 55.67 | 9.68 | 284 | (CS+neb), Fe iiw | ||
| KWBBe1055 | 05 30 29.265 | -67 17 01.65 | 17.4 | 54.76 | 6.37 | 398 | cl, sh?, (CS+neb), Fe ii | ||
| KWBBe1108 | 05 30 37.238 | -67 11 29.31 | 17.6 | 14.55 | 2.40 | 2.78 | 359 | cl, (CS+neb) | |
| KWBBe1175 | 05 30 46.960 | -67 17 39.30 | 17.7 | 40.05 | 4.94 | 4.94 | 454 | cl, sh, noneb | |
| KWBBe1196 | 05 30 50.893 | -67 18 08.51 | 17.6 | 25.81 | 4.10 | 3.81 | 407 | cl, sh, noneb | |
| MHFBe55075 | 05 30 15.660 | -67 23 54.60 | 16.0 | 3.79 | 1.35 | 1.35 | 457 | CS+neb | |
| MHFBe55920 | 05 27 42.256 | -67 23 36.58 | 16.1 | 20.61 | 6.03 | 145 | (CS+neb), Fe ii | ||
| MHFBe59721 | 05 29 25.670 | -67 23 02.40 | 16.5 | 4.47 | 1.36 | 1.52 | 369 | CS+neb | |
| MHFBe66252 | 05 29 18.200 | -67 21 37.10 | 16.3 | 15.45 | 2.27 | 532 | (CS+neb), Fe ii | ||
| MHFBe72704 | 05 28 29.430 | -67 20 20.10 | 14.9 | 1.01 | 1.02 | 1.04 | 230 | noneb | |
| MHFBe73013 | 05 28 55.994 | -67 20 14.55 | 16.1 | 25.68 | 397 | CS+neb, Fe iiw | |||
| MHFBe77796 | 05 29 13.609 | -67 19 18.70 | 14.9 | 16.84 | 3.85 | 3.85 | 258 | noneb, He i | |
| MHFBe85028 | 05 29 45.000 | -67 17 50.50 | 16.1 | 6.50 | 1.63 | 1.64 | 476 | sh, noneb, He i | |
| MHFBe101350 | 05 30 34.640 | -67 14 45.30 | 15.3 | 10.81 | 2.52 | 2.57 | 315 | sh?, noneb | |
| MHFBe103914 | 05 27 15.216 | -67 14 10.15 | 15.0 | 45.95 | 8.15 | 271 | (CS+neb), Fe ii | ||
| MHFBe107771 | 05 28 34.651 | -67 13 23.97 | 16.4 | 4.33 | 1.29 | 1.31 | 510 | cl, CS+neb | |
| MHFBe107877 | 05 28 34.260 | -67 13 25.90 | 15.2 | 36.77 | 4.68 | 5.10 | 373 | cl, noneb, He i, Fe ii | |
| MHFBe108272 | 05 28 32.127 | -67 13 23.68 | 16.4 | 4.49 | 1.39 | 1.36 | 341 | cl, CS+neb | |
| MHFBe110827 | 05 27 28.582 | -67 12 56.81 | 14.9 | 34.21 | 3.51 | 3.56 | 508 | cl, sh, noneb, Fe ii | |
| MHFBe116297 | 05 28 06.021 | -67 11 47.43 | 16.1 | 10.56 | 2.21 | 2.17 | 331 | noneb | |
| MHFBe118313 | 05 26 55.945 | -67 11 27.09 | 15.0 | 59.50 | 10.15 | 265 | (CS+neb), He i, Fe iiw | ||
| MHFBe118784 | 05 28 27.565 | -67 11 28.50 | 14.8 | 29.42 | 4.64 | 331 | noneb, He i, Fe ii | ||
| MHFBe119521 | 05 30 35.252 | -67 11 19.10 | 16.3 | 9.67 | 1.73 | 1.74 | 574 | cl, noneb | |
| MHFBe132079 | 05 30 05.496 | -67 08 53.45 | 16.2 | 40.14 | 7.27 | 262 | noneb, Fe ii | ||
| MHFBe132205 | 05 29 25.872 | -67 08 53.93 | 14.7 | 32.90 | 7.14 | 212 | cl, (CS+neb), Fe ii | ||
| MHFBe136844 | 05 27 35.241 | -67 07 54.43 | 15.1 | 57.53 | 9.99 | 274 | (CS+neb), Fe ii | ||
| MHFBe137325 | 05 29 07.009 | -67 07 49.28 | 16.3 | 7.39 | 2.02 | 2.02 | 298 | noneb | |
| MHFBe138610 | 05 30 00.332 | -67 07 44.02 | 14.8 | 5.04 | 1.64 | 1.65 | 319 | cl, noneb | |
| MHFBe140012 | 05 28 13.281 | -67 07 20.77 | 14.9 | 14.59 | 2.55 | 2.55 | 429 | cl, sh?, noneb, He i | |
| MHFBe155603 | 05 28 47.760 | -67 04 25.70 | 14.7 | 41.71 | 6.33 | 300 | noneb, Fe ii |
3.1.1 Characteristics of the H line emission
The equivalent width (EW), maximum intensity (Imax for a single peak, and I(V) and I(R) for the violet and red peaks respectively in a double peak emission) and the FWHM of the circumstellar H emission measured for each Be star are given in Table 1. The FWHM of the CS H emission line ranges between 145 and 575 km s-1. The telluric lines like the nebular lines are resolved and the FWHM of the H nebular line is 55 km s-1 greater than the instrumental FWHM (35 km s-1). An example of H nebular line is shown in Fig. 2 with the telluric lines removed. Thus, a Be star is easily distinguishable from a B star showing H nebular contribution, except when the is low and/or the CS emission is very weak.
However, a fraction of Be stars shows a nebular contribution in their spectrum easily detected by the presence of [N ii] and [S ii] lines, but not always distinguishable in H when the CS emission in this line is strong and when the RVs of nebular and CS components are similar. This problem is chiefly met in low or moderate Be stars. In these cases the nebular H line emission contributes to overestimation of Imax and underestimation of the FWHM of the CS emission line. To a lesser degree it also leads to overestimation of EW.

Examples of H lines polluted by the nebular contribution are given in
Fig. 2:
(a) shows an example of a B star (MHF54565) with strong nebular
emission lines;
(b), (c), (d) illustrate Be stars (MHFBe107771, MHFBe108272 and
MHFBe59721) displaying 2 distinct V and R peaks plus a central nebular line;
(e) shows a Be spectrum (MHFBe73013) with nebular and CS emissions
severely blended into a single peak profile;
(f) illustrates the undetectable presence of a nebular line in the strong CS
H emission of a Be star (KWBBe1055).
With the fibres located on sky positions (without stars in the background), we determine all parameters (FWHM, intensity) of the H and [S ii] nebular lines, and we obtain their intensity ratio: [S ii]/H = 0.2 0.1(see Section 3.2). As the intensity and RV of [S ii] 6717 line could be measured in each Be spectrum, and assuming that the nebular [S ii]/H ratio is the same for sky spectra and stellar spectra, it is possible to subtract the corresponding H nebular contribution from the emission line profile. Consequently, we can state precisely whether the H CS emission is single, double or affected by a shell component for KWBBe91, KWBBe177, KWBBe203, KWBBe374, KWBBe874, KWBBe1055, MHFBe73013, MHFBe77796, MHFBe107771, MHFBe108272, MHFBe136844 and MHFBe155603.
For all Be stars presented in Table 1, we find no clear correlation between the FWHM and the EW of H emission lines. Nevertheless, some general trends can be derived:
-
•
A single-peak emission is generally associated with large EW ( 20 Å) and to narrow to moderate FWHM ( 350 km s-1).
-
•
A double-peak emission without shell contribution is associated with a small EW.
-
•
A double-peak emission with a strong shell feature is associated with a large FWHM ( 400 km s-1), whatever the EW is.
-
•
Fe ii emission lines are generally present in Be stars with EW 20 Å.
These trends are agree fairly well with the conclusions derived by Dachs et al. (1986) in their study of bright galactic Be stars. Note, however, that the minimum H EW required for Fe ii emission lines to become visible in galactic Be stars is EW 7 Å according to Hanuschik (1987). Although their study and ours do not use the same Fe ii lines, the difference in the EW limits between galactic and Magellanic Be stars is consistent with their metallicity difference.
In addition, all the KWBBe stars show a strong H emission (EW Å) compared with the MHFBe stars discovered in this paper. This is probably a selection effect due to the photometric H index criteria used by Keller et al. (1999), which could not detect Be stars with weak emission.
The determination of fundamental parameters (temperature Teff, gravity , ) will be the subject of a forthcoming paper (Martayan et al., in preparation). In this study however, we make use of our results on values obtained by comparison between the observed spectra and a grid of synthetic spectra in the spectral domain 4000-4500 Å, which contains 5 strong helium lines. The adopted metallicity and abundances for the synthetic spectra are those derived for the LMC (Korn et al. 2002).
For the H line, we find a correlation on the one hand between and FWHM on one hand, and on the other hand between ()/() (where is the peak separation velocity) and EW, as found for galactic Be stars by Dachs et al. (1986) and Hanuschik et al. (1988), and refined by Zamanov et al. (2001). This provides evidence for a rotationally supported CS envelope. Taking into account the fact that the dispersion of points for galactic Be stars is similar to that for LMC Be stars (see Fig. 2a, Zamanov et al 2001), the average slope of the peak separation versus the equivalent widths of galactic Be stars determined by Zamanov et al. (2001) is comparable to ours (see Fig. 3).
Nevertheless, we note that Be stars in the LMC with strong ”shell” (filled triangles in Fig. 3) are located on the right in the diagram, above the mean correlation. The increase of the peak separation in those objects is an opacity effect (see eq.(7) in Hanuschik et al. 1988). It indicates that Be stars in shell phases have denser disks. This result obtained for LMC Be stars confirms the similar result of Moujtahid et al. (1999) in their study of photometric data translated into a spectrophotometric frame of galactic Be stars (see also Kogure 1989).


3.1.2 Proportion of Be stars
We determine the percentage of Be stars found on the one hand in the observed clusters and OB concentrations and on the other hand in the field close to NGC2004. “Be stars” are all non-supergiant late O, B and early A-type stars that have shown some emission in their Balmer lines at least once (Jaschek et al. 1981). This definition is also used here.
Excluding the area covered by the study of Keller et al. (1999), where we observed 22 known KWBBe stars and 1 new Be star, we discovered 24 other new Be stars among the remaining 131 observed O, B, A-type stars. They represent 18.3% of this unbiased sample. 6 of these Be stars seem to be located in OB concentrations or in small clusters, and 18 are located in the field outside the clusters.
The percentages of Be stars in the clusters and in the field surrounding NGC 2004, but excluding NGC 2004 itself and its stars, are thus the following:
-
•
In clusters and OB associations we find 7 Be stars and 12 normal absorption-line O, B stars. We obtain a mean percentage N(Be)/N(B+Be)= 42% 28%. The large error bar is due to the low number of observed stars in clusters and associations.
-
•
For statistical analysis in the field of NGC2004, we use two methods. We exclude the area covered by the study of Keller et al. (1999). This represents 17 Be stars and 95 B stars, i.e. 15% of Be stars. In the second method, we exclude only the clusters instead of the entire area. This represents 28 Be stars and 112 B stars, i.e. 20% of the Be stars. The mean percentage for the field of NGC2004: N(Be)/N(B+Be)=17.5% 2.5%.
Due to the characteristics of the instrumentation, which do not make it possible to position many fibres in a small angular size region (), and due to the characteristics of our survey conducted in two single epochs and the variable nature of the Be phenomenon, the above figures should be considered as a rough estimate of the frequency of Be stars inside the clusters. Nevertheless, we can draw the following conclusions:
-
•
The study by Fabregat (2003) shows a clear difference between the Be star content of young galactic clusters compared with the content of the surrounding galactic field. This implies that the Be star population in co-eval stellar samples is not representative of the population in mixed-age samples in the field. Our results for Be star contents in clusters and in the field of the LMC are similar to those of previous studies in the Galaxy. Moreover, the percentage of Be stars we determined is close to the estimate made by Keller et al. (2000) in young LMC clusters.
-
•
The frequency of Be stars in the LMC field is comparable to
the mean frequency in the galactic field, which is about 20% for the early B subtypes (Zorec & Briot, 1997). This result is in agreement with that of Keller et al. (1999), who found that the fraction of Be stars compared with B-type stars lies between 10 to 27% in the field population around the LMC clusters they studied and is 11% for the field around the cluster NGC2004. As the metallicity of the LMC is significantly lower than the galactic metallicity, this result casts doubt on the dependence of Be frequency on metallicity as proposed by Maeder et al. (1999).
3.2 Nebular lines
| Binary | V | RV2003 | RV2003 | RV2004 | RV2004 | MACHO | Remarks | ||
|---|---|---|---|---|---|---|---|---|---|
| (2000) | (2000) | 11/24 | 11/28 | 04/12 | 04/14 | ||||
| MHF64847 | 05 27 32.04 | -67 21 53.20 | 15.13 | +396 | +264 | +364 | +221 | no var | |
| MHF65587 | 05 28 23.46 | -67 21 41.30 | 16.01 | +322 | +276 | +297 | +273 | no var | |
| MHF71137 | 05 28 46.65 | -67 20 40.90 | 15.62 | +308 | +265 | +263 | +279 | no var | |
| MHF79301 | 05 29 11.05 | -67 18 58.90 | 15.61 | +316 | +296 | +313 | +301 | no var | SB? |
| MHF81906a | 05 30 04.67 | -67 18 39.60 | 14.90 | +415 | +323 | no var | SB2 | ||
| MHF81906b | +186 | +384 | |||||||
| MHF83937a | 05 29 33.98 | -67 18 06.80 | 14.87 | +305 | +265 | +305 | +296 | no var | SB2 |
| MHF83937b | +305 | +350 | +305 | +296 | |||||
| MHF87970a | 05 29 08.34 | -67 17 18.30 | 15.10 | +263 | +403 | +340 | +257 | 7.117 | SB2 |
| MHF87970b | +496 | +121 | +280 | +512? | |||||
| MHF91603 | 05 28 03.40 | -67 16 33.20 | 15.19 | +318 | +291 | +321 | +300 | no var | SB? |
| MHF94292a | 05 28 24.68 | -67 16 04.10 | 15.26 | +428 | +367 | +199 | +412 | no var | SB2 |
| MHF94292b | +164 | +220 | +390 | +172 | |||||
| MHF98013 | 05 30 32.65 | -67 15 25.70 | 14.82 | +267 | +330 | +265 | +322 | no data | |
| MHF102053 | 05 29 56.24 | -67 14 32.95 | 16.26 | +349 | +295 | no data | |||
| MHF103207 | 05 30 13.56 | -67 14 27.10 | 14.94 | +205 | +444 | no data | |||
| MHF109251 | 05 28 31.95 | -67 13 11.90 | 15.95 | +283 | +249 | no var | SB? | ||
| MHF110467 | 05 27 25.31 | -67 12 52.50 | 15.70 | +266 | +323 | no var | |||
| MHF111340a | 05 27 14.43 | -67 12 40.90 | 16.16 | +453 | +167 | +492 | +263 | 1.074 | SB2 |
| MHF111340b | +142 | +453 | +70 | +361 | |||||
| MHF112849a | 05 29 54.86 | -67 12 41.00 | 14.81 | +358 | +299 | +227 | +262 | no data | SB2 |
| MHF112849b | +115 | +270 | +461 | +315 | |||||
| MHF113048 | 05 26 57.53 | -67 12 18.95 | 16.38 | +283 | +251 | no var | SB? | ||
| MHF127573a | 05 27 19.79 | -67 09 34.60 | 16.46 | +378 | +260 | +371 | +217 | 2.932 | SB2 |
| MHF127573b | +100 | +260 | +163 | ||||||
| MHF128963 | 05 30 38.29 | -67 09 32.70 | 15.95 | +315 | +274 | no var | SB? | ||
| MHF133975 | 05 29 50.61 | -67 08 30.00 | 16.27 | +241 | +352 | +233 | +344 | no data | |
| MHF136274a | 05 28 13.38 | -67 07 58.50 | 16.28 | +365 | +276 | +292 | +287 | no var | SB2 |
| MHF136274b | +163 | +276 | +292 | +287 | |||||
| MHF141891 | 05 28 00.77 | -67 06 55.50 | 16.29 | +230 | +288 | +264 | +231 | 2.975 | |
| MHF149652 | 05 28 58.67 | -67 05 29.20 | 16.50 | +338 | +276 | +261 | +295 | 1.458 |
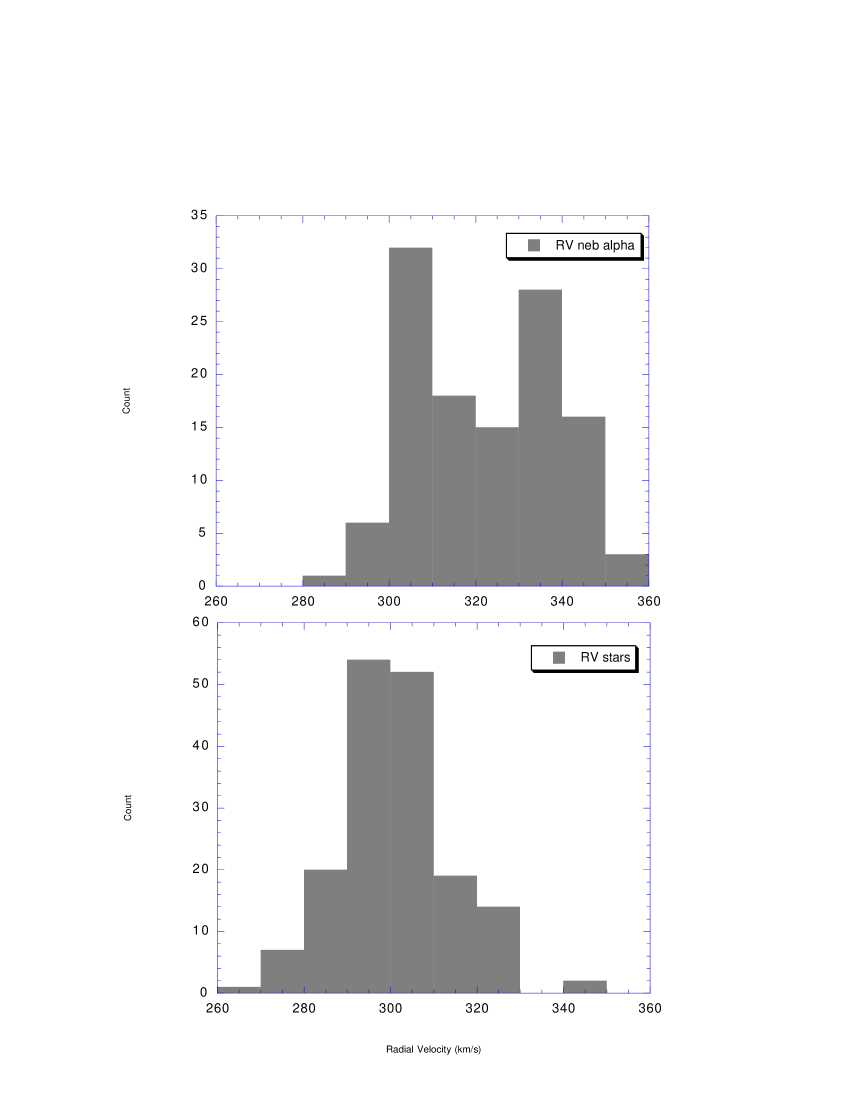
The radial velocity and the strength of nebular lines (H, [N ii] and [S ii]) have been determined, as well as the radial velocity of strong photospheric lines (H, H, H, He i and Mg ii). The accuracy is 10 km s-1. The statistical distribution of stellar and nebular RVs is given in Fig. 4. The distribution is Gaussian for stellar RVs with a maximum around +300 km s-1 while it is bi-modal for nebular RVs with peaks at +305 and +335 km s-1. After comparing stellar and nebular RVs for each star, no clear link is found between the stellar object and the nebular emission in its spectrum.
Thus, there is apparently no physical link between stars and the structures giving rise to the nebular lines.
In Fig. 5 we plot the position of stars, with and without nebular lines, and of sky fibres in the field. Different symbols are used to distinguish stars in which the nebular emission has low or high RVs, as well as stars with strong nebular lines. From Fig. 5, it can be seen that high and low nebular RVs are not randomly distributed over the field but seem to be organized in structures that look like filaments. The higher velocities centered around +335 km s-1 are observed in the eastern and northwestern parts of the field, while the lower velocities, centered around +305 km s-1, are observed in the southwestern part. Higher intensity is generally found in nebulosities with the lowest H radial velocities. However, stars with no nebular H line, also indicated in Fig. 5, are found in isolated regions of the observed field, reflecting the patchy nature of nebulosities in this part of the LMC.
The mean value of the [S ii] 6717/6731 ratio is 1.4, typical of LMC bubbles (Skelton et al. 1999). The [N ii]/H ratio is lower than 0.1; the S[II](6717 or 6731 Å)/H ratio ranges between 0.1 and 0.3. These values are close to those found for the H ii regions in the LMC.
The patchy distribution with a variable density, seen in the analysis of the nebular lines H, [N ii] and [S ii], agrees fairly well with was the results of H i distribution survey (Staveley-Smith et al. 2003). Indeed, the H i distribution has revealed that the body of the LMC is punctuated by large holes and has a generally mottled appearance. One of the main H i gaps in the LMC corresponds to LMC4. The southern inner limit of the LMC4 supergiant shell, taken from Kim et al. (1999), crosses the field we observed with the VLT-GIRAFFE multi-object spectrograph (see Fig. 5). The LMC4 H i supergiant shell is centered at (2000)=05h 31min 33s and (2000) = -66∘ 40 28, its shell radius is r(sh) = 38.737.7 and its systemic heliocentric velocity is RV = +306 km s-1 (Kim et al. 1999); note that the shell radius previously determined by Meaburn (1980) is larger by 12′.
Our study of nebular lines shows that:
-
•
Higher-velocity nebulosities (RVnebH=+335 km s-1 on average) appear to coincide with the southern inner H i gas in LMC4.
-
•
Lower-velocity nebulosities (RVnebH=+305 km s-1 in average) are preferentially detected at the rim of LMC4 and have the same RV as the systemic RV of the bubble.
-
•
The separation between lower and higher velocities roughly corresponds to the inner limit of the LMC4 H i supergiant shell.
-
•
The strong intensity of nebular lines observed in the southern (S-W) part of the field is easily explained by the vicinity of the H ii region LHA 120-N 51A.
3.3 Binaries
Discrepancies between stellar radial velocities of blue and red lines (interval of 4 days in November 2003 and 2 days in April 2004) greater than 2 = 18 km s-1 allow us to detect 18 binaries and to suspect 5 others of binarity (see Table 2). The binary nature of the latter objects may be questionable because the discrepancies observed in the radial velocities are between 2 and 3 and further observations are therefore needed to confirm their binary nature. Among the 23 binaries, 8 objects are SB2.
Despite the small number of spectra obtained for each object, it is possible to roughly estimate the systemic velocity and the mass ratio m1/m2 for the SB2 systems using a graphical method (Wilson 1941) based on the linear relation between the velocity of each component of the system. Results are given in Table 3.
In addition, we searched for light curves of the new SB systems in the MACHO database. All the sources in the MACHO database have been identified thanks to their GIRAFFE coordinates and fall inside a radius smaller than 1″. Among the 18 identified sources, 5 stars are found to be eclipsing binaries: MHF87970 (SB2), MHF111340 (SB2), MHF127573 (SB2), MHF141891 (SB1) and MHF149652 (SB1); two of them seem to show a total eclipse (MHF127573 and MHF149652). For these eclipsing binaries the orbital period is determined using 3 different methods: the CLEAN algorithm (Roberts et al. 1987), the Least Squares method and the PDM method (Stellingwerf 1978). The periods are given in Table 2.
Illustrations of the most characteristic systems, associated with their MACHO light curve when available, are given in Figs 6 to 12. The light curve magnitudes are expressed in instrumental units.
-
•
MHF83937, MACHO 60.8070.1685 (see Fig. 6): In the blue range, spectral lines show a single component only in November 2003 and April 2004. Splitting is observed in the red range in November 2003, but in April 2004 the red lines become deeper and again single, which indicates an eclipse phase. The mass ratio is about 1. This star has been observed by MACHO but no periodicity could be found.

Figure 6: Spectroscopic VLT-GIRAFFE observations of the binary star MHF83937 -
•
MHF87970, MACHO 60.7950.16 (see Fig. 7): An interchange of position between the primary and secondary line profiles was observed at both epochs of observations (2003 and 2004). The estimated mass ratio is about 2.8. The deeper and narrower component is attributed to the secondary star. Note that the Mg ii 4481 line always shows a single component with the same RV as the secondary star. This secondary is probably a giant A star. From MACHO data it was possible to determine the orbital period Porb = 7.117 d. The light curve indicates that the system is an eclipsing one with 2 roughly identical minima, which means that the 2 components of the system have approximately the same luminosity.

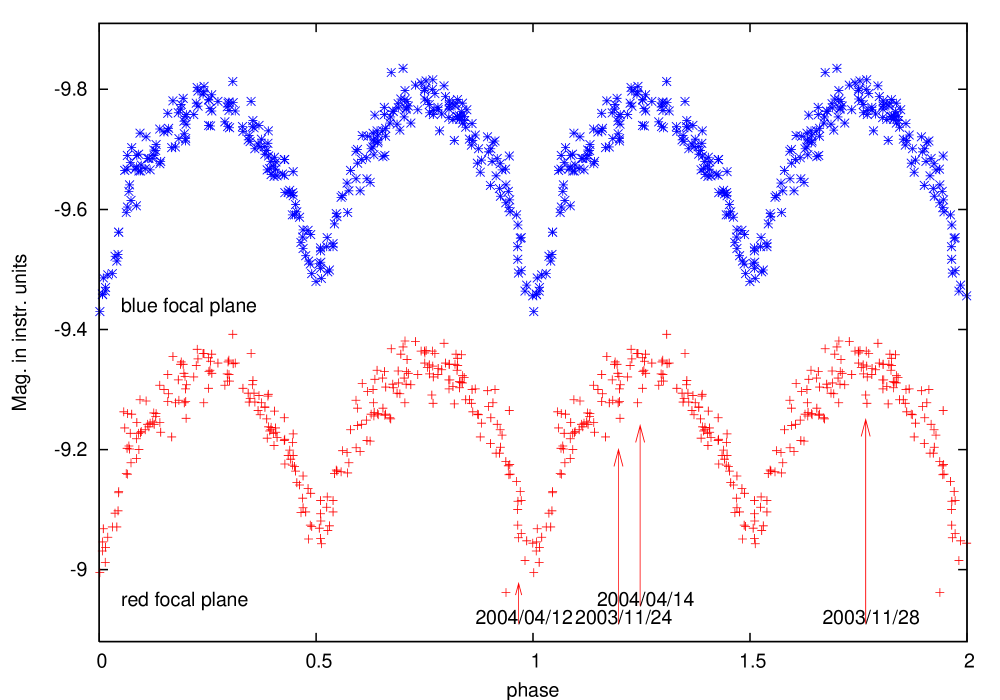
Figure 7: Observations of the binary star MHF87970. Top: spectroscopic VLT-GIRAFFE data; bottom: MACHO data folded in phase with Porb = 7.117 d. -
•
MHF94292, MACHO 60.7629.23 (see Fig. 8): Hydrogen and helium lines are double in each spectrum and line profile interchanges of position are observed over 2 days in 2004. This implies that the orbital period is a few days but no periodicity can be determined from MACHO data. The mass ratio is about 1.

Figure 8: Spectroscopic VLT-GIRAFFE observations of the binary star MHF94292. Table 3: Systemic radial velocity and mass ratio of the binary SB2 systems discovered in the region surrounding of NGC2004. Accuracy is about 20 km s-1 on RVsyst and for mass ratio. Binary RVsyst m1/m2 km s-1 MHF81906 +311 1.3 MHF83937 +307 MHF87970 +338 2.8 MHF94292 +294 1.0 MHF111340 +304 1.2 MHF112849 +289 2.3 MHF127573 +260 MHF136274 +290 -
•
MHF111340, MACHO 60.7566.36 (see Fig. 9): The blue spectrum in 2003 and 2004 shows 2 widely separated components. In 2003 the red spectrum, obtained 4 days after the blue one, displays an interchange in the component positions. In 2004 the red spectrum, taken 2 days after the blue one, probably shows an interchange of position as well, but it is at the limit of detectability due to a poor S/N ratio and to the presence of a strong nebular line at H. Estimated mass ratio is about 1.2. A short orbital period was found in the MACHO data, Porb = 1.074 d.
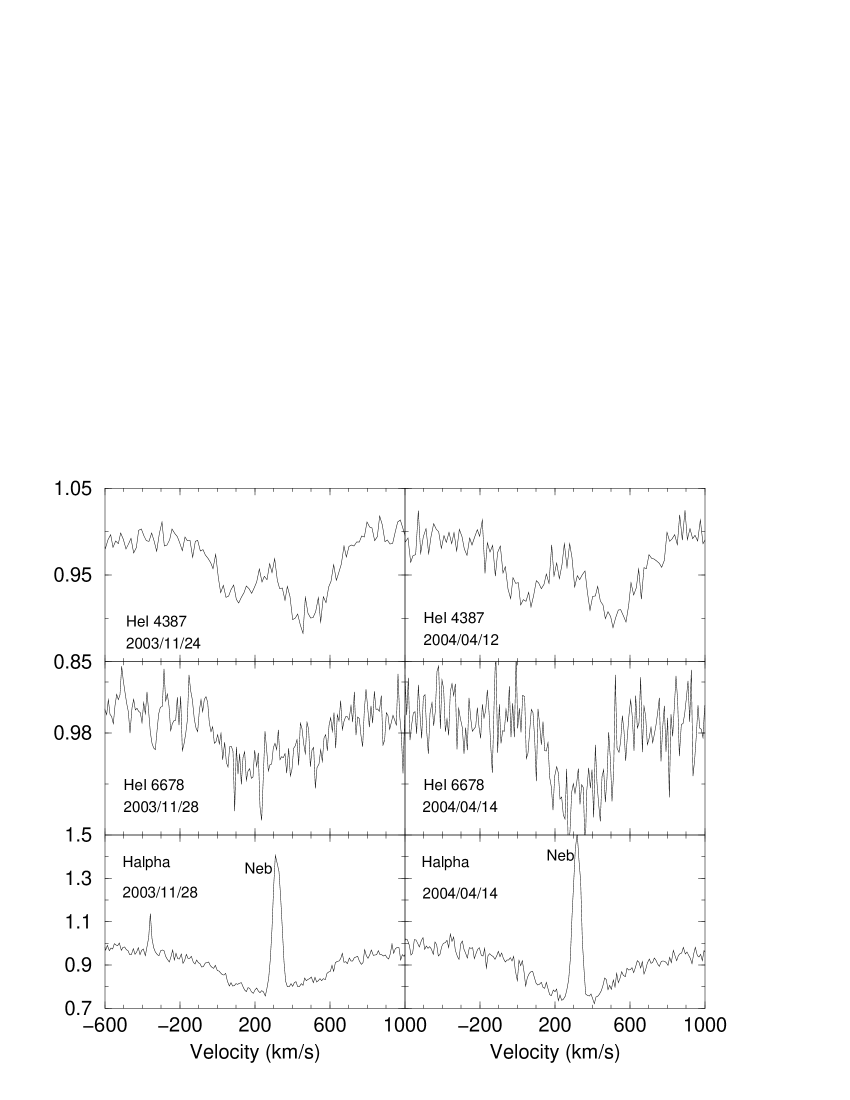
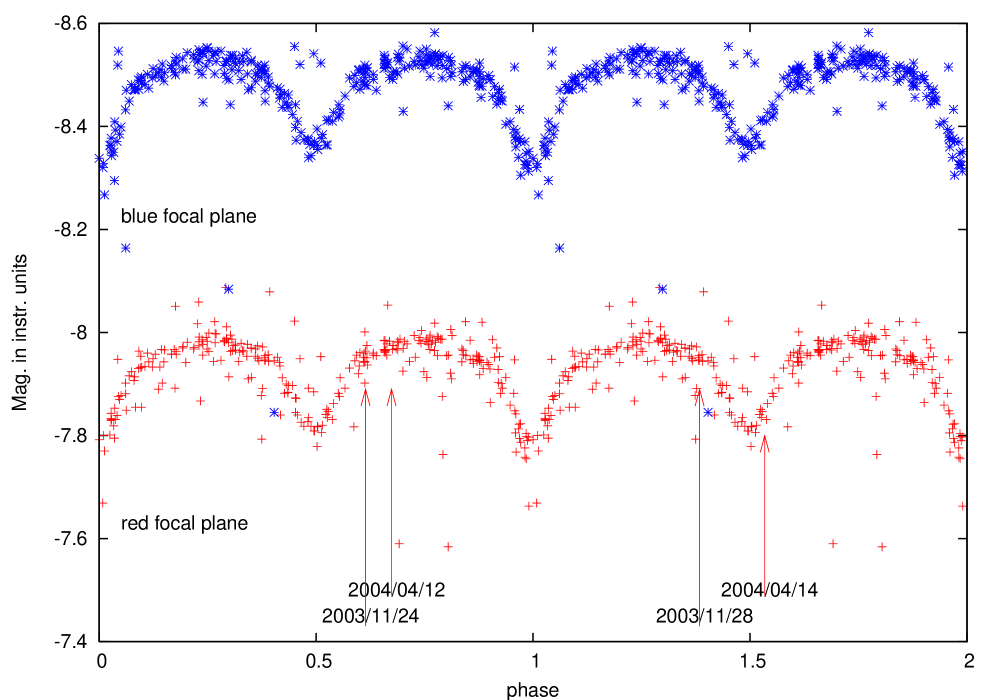
Figure 9: Observations of the binary star MHF111340. Top: spectroscopic VLT-GIRAFFE data; bottom: MACHO data folded in phase with Porb = 1.074 d. -
•
MHF127573, MACHO 60.7710.39 (see Fig. 10): Blue He i lines are double in November 2003 and April 2004 and red ones are very noisy but shifted compared to the blue ones observed 4 and 2 days before, respectively. H is highly disturbed by a nebular component but is fainter and broader in April 2004 than in November 2003. This suggests a splitting of the line due to the secondary at about +300 km s-1. The orbital period determined from the MACHO data is 2.932 d. Flat-bottomed light curve indicates a total eclipse with 2 slightly unequal minima. The mass ratio is about 1.

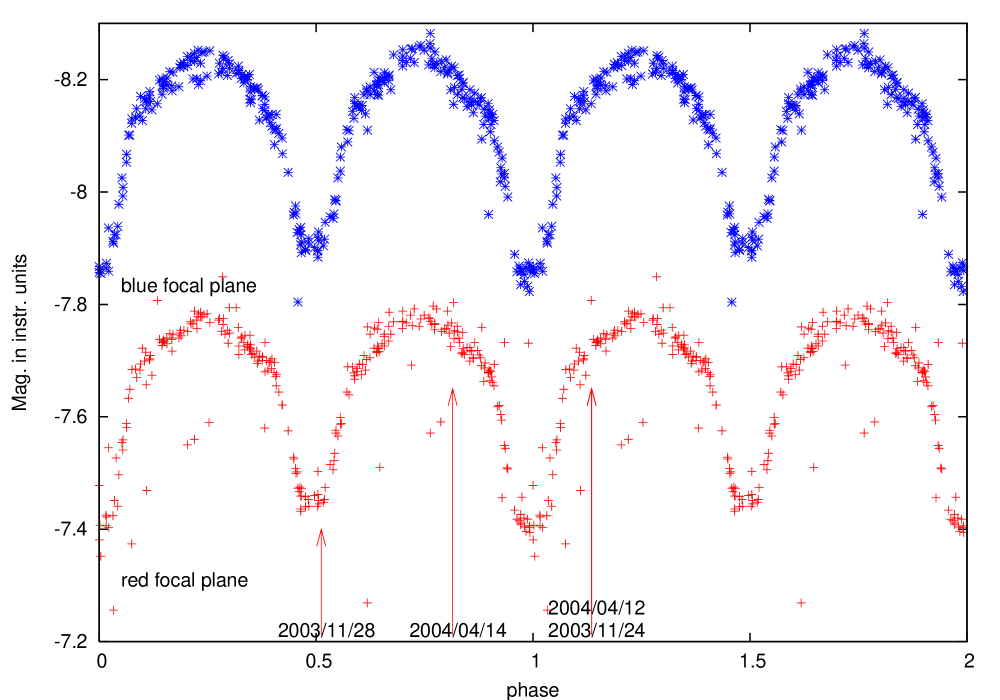
Figure 10: Observations of the binary B star MHF127573. Top: spectroscopic VLT-GIRAFFE data; bottom: MACHO data folded in phase with Porb = 2.932 d. -
•
MHF141891, MACHO 60.7710.36 (see Fig. 11): This B-type star is a SB1 system. A faint nebular H line disturbs the photospheric line profile, but it seems that the profile obtained in 2004 is larger, in equivalent width, than the profile obtained in 2003. This could indicate that the secondary spectrum is at the limit of detection. The MACHO data allow the determination of an orbital period of 2.975 d, the light curve being typical of an eclipsing binary with 2 unequal minima. The eclipse is partial.

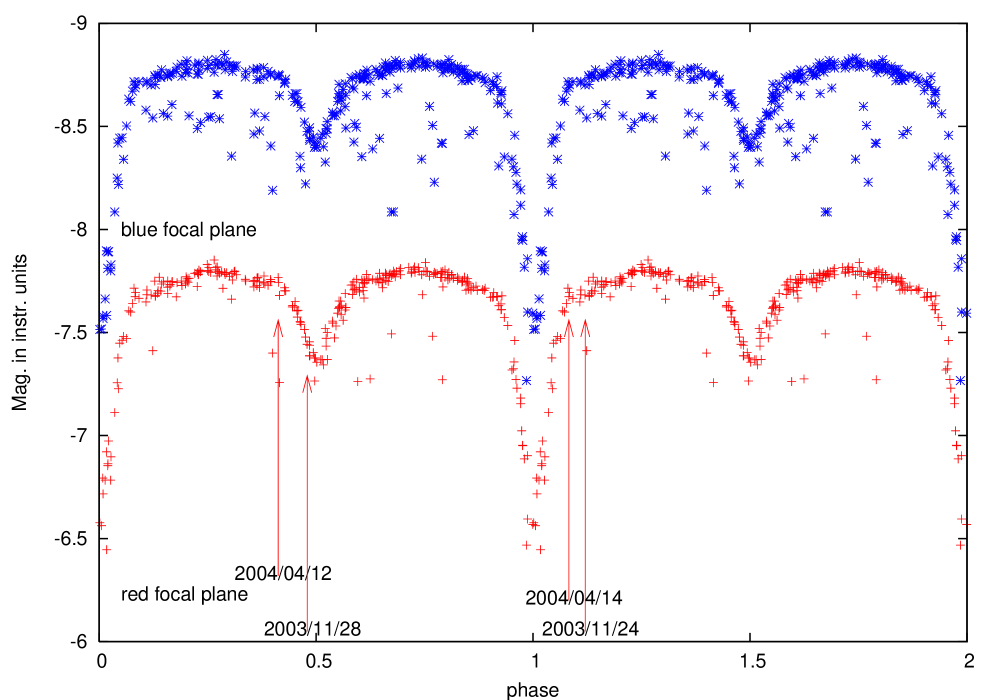
Figure 11: Observations of the SB1 B star MHF141891. Top: spectroscopic VLT-GIRAFFE data; bottom: MACHO data folded in phase with Porb = 2.975 d. -
•
MHF149652, MACHO 60.7953.36 (see Fig. 12): This binary system always shows a single spectrum on our spectroscopic observations. However, the light curve obtained from the MACHO data folded in phase with the orbital period Porb = 1.458 d is typical of a total eclipsing binary with 2 unequal minima.

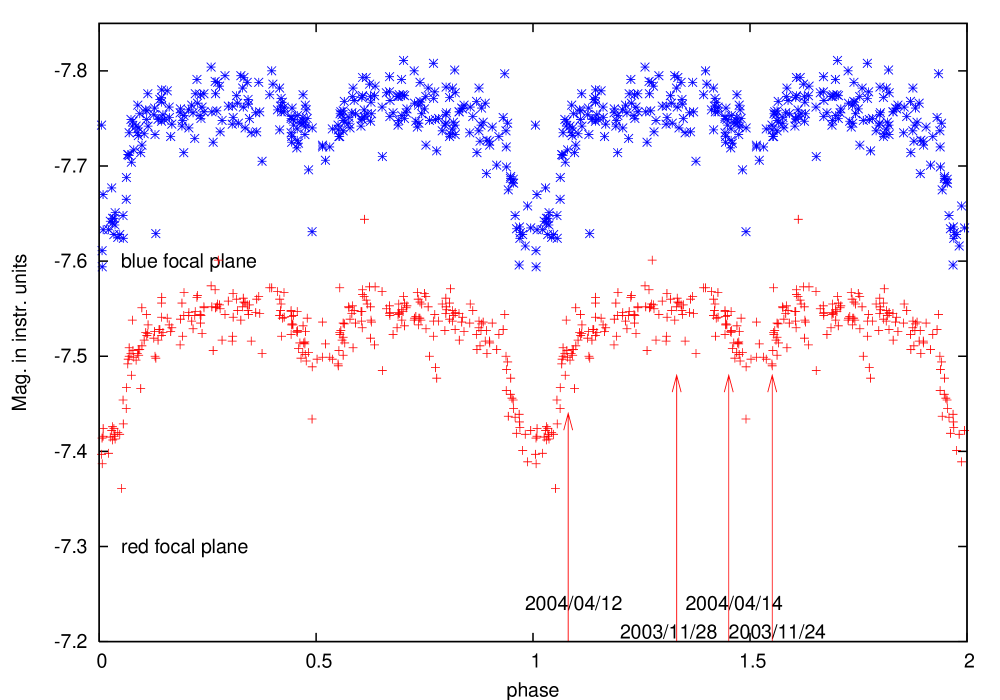
Figure 12: Observations of the SB1 B star MHF149652. Top: spectroscopic VLT-GIRAFFE data; bottom: MACHO data folded in phase with Porb = 1.458 d.
The percentage of binaries among our sample is 12%. This is probably a lower limit, since only systems with relatively short periods can be detected with our observations. In the Galaxy the rate of spectroscopic binaries is 20% for early-type stars.
4 Conclusion
For the first time, medium resolution spectroscopic observations of a large sample of B and Be stars in the LMC-NGC2004 region are presented. 25 new Be stars have been identified in the field as well as small clusters and OB concentrations.
The high capability of the VLT-GIRAFFE multi-object spectrograph allowed us to identify nebular lines that pollute 75% of the star spectra observed. Careful study enabled us to disentangle these lines from the CS contribution in Be stars. We were therefore able to separate Be stars with genuine single-peak from double-peak H emission lines. Characteristics of the H emission line have been investigated through spectral parameters (FWHM, EW, peak separation). No noticeable difference was found between the LMC and galactic Be stars.
The proportion of Be stars compared to B-type stars was found to be of the same order in the Large Magellanic Cloud and in the Galaxy fields. Thus metallicity does not seem to strongly influence the apparition of the Be phenomenon.
A by-product of the observations of B-type stars in the LMC region is the study of nebular H, [S ii] and [N ii] lines. We found that the nebulosities in which these lines are formed are not related to the B and Be stars of the sample. The RV distribution of these nebular lines is bi-modal and peaks at +305 and +335 km s-1, while it is Gaussian for the stellar lines. The nebular structures located in the north-eastern part of the field observed with VLT-GIRAFFE have higher RV (+335 km s-1) and lower density than those located in the southern-western part (+305 km s-1) next to the H ii region LHA 120-N51A. The patchy nature of the nebulosities in the LMC, already detected on a large scale by H i surveys, is widely confirmed on a small scale by this study.
Finally, we identified 23 new binary systems, of which 5 have still to be confirmed. 8 systems are SB2 and their systemic RV and mass ratio have been derived. Using the MACHO database, 5 systems have been found to be eclipsing binaries, which allows us to accurately determine their orbital period. The systems MHF111340 and MHF149642 have very short orbital periods: 1.074 and 1.458 d respectively. Of the 8 SB2 we detected from VLT-FLAMES spectra and the 5 systems we identified with MACHO light curves, three are in common (MHF87970, MHF111340, MHF136274).
A study of the fundamental parameters of the B and Be stars of this sample will be presented in a forthcoming paper (Martayan et al., in preparation).
Acknowledgements.
We would like to thank Dr H. Flores for the success and good quality of the observing run in November 2003. We thank Drs M.R. Cioni and J. Smoker for their help during the observing run in April 2004. We thank M. Mekkas for his technical support. We also thank the referee Dr T. Rivinius for his constructive remarks. This paper utilizes public domain data originally obtained by MACHO Project, whose work was performed under the joint auspices of the U.S. Department of Energy, National Security Administration by the University of California, Lawrence Livermore National Laboratory under contract No. W-7405-Eng-48, the National Science Foundation through the Center for Particle Astrophysics of the University of California under cooperative agreement AST-8809616, the Mount Stromlo and Siding Spring Observatory, part of the Australian National University. This research has made use of the Simbad database and Vizier database maintained at CDS, Strasbourg, France.References
- (1) Bertin, E. , Arnouts, S. 1996, A&AS 117, 393
- (2) Bica, E.L.D., Schmitt, H.R., Dutra, C.M., Oliveira, H.L. 1999, AJ 117, 238
- (3) Dachs, J., Hanuschik, R., Kaiser, D., Rohe, D. 1986, A&A 159, 276
- (4) Davies, R. D., Elliott, K. H., Meaburn, J. 1976, MmRAS 81, 89
- (5) Domgörgen, H., Dalhem, M., Dettmar, R.-J. 1995, A&A 296, 523
- (6) Fabregat, J. 2003, Interplay of Periodic, Cyclic and Stochastic Variability in Selected Areas of the H-R Diagram, ed. C. Sterken, ASP Conf. Ser. vol. 292, 65
- (7) Fabregat, J., Torrejón, J. M. 2000, A&A 357, 451
- (8) Hanuschik, R.W., 1987, A&A 173, 299
- (9) Hanuschik, R.W., Kozok, J.R. , Kaiser, D. 1988, A&A 189, 147
- (10) Jaschek, M., Slettebak, A., Jaschek, C. 1981, Be Stars Newsl. No. 4, 9
- (11) Keller, S.C. 1999, AJ 118, 889
- (12) Keller, S.C., Wood, P.R., Bessell, M.S. 1999, A&AS 134, 489
- (13) Keller, S.C., Bessell, M.S., Da Costa, G.S. 2000, AJ 119, 1748
- (14) Kim, S., Dopita, M.A., Staveley-Smith, L., Bessel, M.S. 1999, AJ 118, 2797
- (15) Kogure, T. 1989, Ap&SS 163, 7
- (16) Korn, A.J., Keller, S.C. , Kaufer, A. et al. 2002, A&A 385, 143
- (17) Maeder, A., Meynet, G. 2000, ARAA 38, 143
- (18) Maeder, A., Grebel, E.K., Mermilliod, J.C. 1999, A&A 346, 459
- (19) Meaburn, J. 1980, MNRAS 192, 365
- (20) Moujtahid, A., Zorec, J., Hubert, A.M. 1999, A&A 349, 151
- (21) Roberts D.H., Lehár J., Dreher J.W. 1987, AJ 93, 968
- (22) Skelton, B.P., Waller, W.H. et al. 1999, PASP 111, 465
- (23) Staveley-Smith, L., Kim, S., Calabretta, M. R. et al. 2003, MNRAS 339, 87
- (24) Stellingwerf, R.F. 1978, ApJ 224, 953
- (25) Wilson, O.C. 1941, ApJ 93, 29
- (26) Zamanov, R.K., Reig, P., Marti, J. et al. 2001, A&A 367, 887
- (27) Zorec, J. 2004 in Proceedings of the IAU Symposium 215 on Stellar Rotation, Cancun, Mexico, November 11-15 2002, ed. A. Maeder & P. Eenens, 73
- (28) Zorec, J., & Briot, D. 1997, A&A 318, 443