Spectral changes during dipping in low-mass X-ray binaries due to highly-ionized absorbers
X-ray observations have revealed that many microquasars and low-mass X-ray binaries (LMXBs) exhibit narrow absorption features identified with resonant absorption from Fe xxv and Fe xxvi and other abundant ions. In many well studied systems there is evidence for blue-shifts, indicating outflowing plasmas. We succesfully model the changes in both the X-ray continuum and the Fe absorption features during dips from all the bright dipping LMXBs observed by XMM-Newton (EXO 0748676, XB 1254690, X 1624490, MXB 1659298, 4U 1746371 and XB 1916053) as resulting primarily from an increase in column density and a decrease in the ionization state of a highly-ionized absorber in a similar way as was done for XB 1323619. This implies that the complex spectral changes in the X-ray continua observed from the dip sources as a class can be most simply explained primarily by changes in the highly ionized absorbers present in these systems. There is no need to invoke unusual abundances or partial covering of extended emission regions. Outside of the dips, the absorption line properties do not vary strongly with orbital phase. This implies that the ionized plasma has a cylindrical geometry with a maximum column density close to the plane of the accretion disk. Since dipping sources are simply normal LMXBs viewed from close to the orbital plane this implies that ionized plasmas are a common feature of LMXBs.
Key Words.:
X-ray binaries – Accretion, accretion disks – X-rays: individual: EXO 0748676, XB 1254690, X 1624490, MXB 1659298, 4U 1746371, XB 19160531 Introduction
Around 10 galactic low-mass X-ray binaries (LMXBs) exhibit periodic dips in their X-ray intensity. The dips recur at the orbital period of the system and are believed to be caused by periodic obscuration of a central X-ray source by structure located in the outer regions of a disk resulting from the impact of the accretion flow from the companion star into the disk (White & Swank 1982). The depth, duration and spectral properties of the dips vary from source to source and from cycle to cycle. The spectral changes during LMXBs dips are complex and cannot be well described by a simple increase in column density of cold absorbing material with normal abundances (e.g., Courvoisier et al. 1986; Smale et al. 1992).
Modeling of these spectral changes provides a powerful means of studying the structure and location of the emitting and absorbing regions in LMXBs. Two approaches have been used. Initially, in the “absorbed plus unabsorbed” approach (e.g., Parmar et al. 1986) the persistent (non-dipping) spectral shape was used to model spectra from dipping intervals. The spectral evolution during dipping was accounted for by a large increase in the column density of the absorbed component, and a decrease of the normalization of the unabsorbed component. The latter decrease was attributed to electron scattering in the absorber. More recently, in the “complex continuum” approach (e.g., Church & Balucinska-Church 1995), the X-ray emission is assumed to originate from a point-like blackbody, or disk-blackbody component, together with an extended power-law component. This approach primarily models the spectral changes during dipping intervals by the partial and progressive covering of the power-law emission from an extended source. The absorption of the point-like component is allowed to vary independently from that of the extended component, and usually no partial covering is included.
The improved sensitivity and spectral resolution of Chandra and XMM-Newton is allowing narrow absorption features from highly ionized Fe and other metals to be observed from a growing number of X-ray binaries. These features were first detected from the micro-quasars GRO J165540 (Ueda et al. 1998; Yamaoka et al. 2001) and GRS 1915+105 (Kotani et al. 2000; Lee et al. 2002). More recent Chandra High-Energy Transmission Grating Spectrometer (HETGS) observations of the black hole candidate H 1743322 (Miller et al. 2004b) revealed the presence of blue-shifted Fe xxv and Fe xxvi absorption features indicative of a highly-ionized outflow. The LMXB systems that exhibit narrow X-ray absorption features are all known dipping sources (see Table 5 of Boirin et al. 2004) except for GX 13+1. This source shows deep blue-shifted Fe absorption features in its HETGS spectrum, again indicative of outflowing material (Ueda et al. 2004).
Boirin et al. (2005) examined the changes in the equivalent widths, s, of the Fe xxv and Fe xxvi absorption features seen from XB 1323619 during persistent and dipping intervals. They found evidence for the presence of less-ionized material in the line of sight during dips consistent with a decrease in the photo-ionization parameter, , from erg cm s-1 to erg cm s-1, while the equivalent hydrogen column density, , of the ionized absorber increased from () 1022 atom cm-2 to () 1022 atom cm-2. There was also a smaller increase in the equivalent hydrogen column of neutral material, , from atom cm-2 to atom cm-2. During persistent intervals almost all the abundant elements, except for Fe, are fully ionized, whilst during dips this is not the case. This results in the presence of absorption edges and many additional absorption features that blend together causing an apparent change in the 1–10 keV continuum measured by XMM-Newton. Boirin et al. (2005) went on to demonstrate that the changes in the source 1–10 keV continuum during dips are consistent with being due primarily to changes in the ionized absorber and that there is no need to invoke unusual abundances or complex continuum models to explain them.
Similar changes in the Fe xxvi and Fe xxv absorption line s during dips have been reported from X 1624490 (Parmar et al. 2002) and XB 1916053 (Boirin et al. 2004). In the case of MXB 1659298, whilst Sidoli et al. (2001) report that there is no obvious orbital dependence of the s of the Fe absorption features, their Fig. 4 shows that the ratio of Fe xxv/Fe xxvi s is at a maximum during dips, consistent with the presence of less-ionized material. As pointed out by Boirin et al. (2005), since highly-ionized absorption features are seen from many other dip sources, changes in ionized absorbers may also explain the overall variations in X-ray spectra observed during LMXB dipping intervals as a class. Here, we examine this prediction by generalizing the analysis performed on XB 1323619 to all the other bright dipping sources observed by XMM-Newton: EXO 0748676, XB 1254690, X 1624490, MXB 1659298, 4U 1746371, and XB 1916053. The overall properties of these sources are given in Table 1, while the previously reported XMM-Newton results are summarized in Table LABEL:tab:lines. XB 1323619 is included for completeness and comparison. The previously bright dip source 4U 1755338 was observed by XMM-Newton (Angelini & White 2003), but is too faint for a detailed spectral study and is not discussed further.
| LMXB | Dips/ | |||
|---|---|---|---|---|
| (hr) | (erg s-1) | (kpc) | Eclipses | |
| XB 1916053 | 0.8 | 4.4 | 9.3 | D |
| XB 1323619 | 2.9 | 5.2 | 10 | D |
| EXO 0748676 | 3.8 | 3.4 | 10 | D,E |
| XB 1254690 | 3.9 | 10.4 | 10 | D |
| 4U 1746371 | 5.8 | 10.1 | 10.7 | D |
| MXB 1659298 | 7.1 | 34.4 | 15 | D,E |
| X 1624490 | 21 | 47.5 | 15 | D |
| LMXB | Continuum | Gaussian features near 7 keV | Reference | ||||
|---|---|---|---|---|---|---|---|
| model | Absorption | Emission | |||||
| Ident. | (keV) | (eV) | (keV) | (eV) | |||
| XB 1916053 | dbb+pl | Fe xxv | 6.65 | 30 | Boirin et al. (2004) | ||
| Fe xxvi | 6.95 | 30 | |||||
| XB 1323619 | bb+pl | Fe xxv | 6.68 0.04 | 25 | 6.6 | Boirin et al. (2005) | |
| Fe xxvi | 6.97 0.05 | 24 | |||||
| XB 1254690 | dbb+pl | Fe xxvi Ly | 6.95 0.03 | 27 | Boirin & Parmar (2003) | ||
| Fe xxvi Ly | 8.20 | 17 9 | |||||
| MXB 1659298 | bb+cpl | Fe xxv | 6.64 0.02 | 33 | 6.47 | 160 | Sidoli et al. (2001) |
| Fe xxvi | 6.90 | 42 | |||||
| X 1624490 | bb+pl | Fe xxv | 6.72 0.03 | 7.5 | 6.58 | 78 | Parmar et al. (2002) |
| Fe xxvi | 7.00 0.02 | 16.6 | |||||
2 Data analysis
The XMM-Newton Observatory (Jansen et al. 2001) includes three 1500 cm2 X-ray telescopes each with an European Photon Imaging Camera (EPIC) at the focus. Two of the EPIC imaging spectrometers use MOS CCDs (Turner et al. 2001) and one uses pn CCDs (Strüder et al. 2001). Reflection Grating Spectrometers (RGS, Den Herder et al. 2001) are located behind two of the telescopes. Since the pn has an effective area a factor of 5 higher at 7 keV and a better energy resolution than the MOS CCDs, we concentrate on the analysis of pn data. Table 3 gives details of the observations and modes used. The pn was operated in either Timing or Small Window mode. We obtained all data products from the XMM-Newton public archive and reduced them using the Science Analysis Software (SAS) version 6.0.0 and calibration files released on 30 June 2004, except for (1) the XB 1254690 data, which were reduced using SAS version 5.4.1 and (2) the EXO 0748676 data which were reduced with version 6.1.0. In order to minimize the effect of any background variations on the extracted spectra, we excluded from the analysis intervals where the 10 keV pn count rate (one CCD) was 1 s-1, except for XB 1254690 (see Sect. 3.3).
| LMXB | Start time | Mode | Filter | ||
|---|---|---|---|---|---|
| (yr mon dy hr:mn) | (ks) | (s-1) | |||
| XB 1916053 | 2001 Sep 25 04:14 | 16.5 | Timing | Medium | 75 |
| EXO 0748676 | 2003 Nov 12 08:23 | 94.6 | SW | Medium | 30 |
| XB 1254690 | 2001 Jan 22 15:49 | 17.6 | Timing | Thin1 | 190 |
| 4U 1746371 | 2002 Sep 19 11:59 | 45.6 | SW | Medium | 110 |
| MXB 1659298 | 2001 Feb 20 08:28 | 31.6 | SW | Thin1 | 160 |
| X 1624490 | 2001 Feb 12 07:29 | 57.5 | SW | Medium | 75 |
In pn Timing mode, only one CCD chip (corresponding to a field of view of 13644) is used and the data from that chip are collapsed into a one-dimensional row (44) to be read out at high speed, the second dimension being replaced by timing information. This allows a time resolution of 30 s, and photon pile-up occurs only for count rates 1500 s-1, much brighter than any of the sources analyzed here. Pile-up occurs when two or more photons hit the same, or adjacent, pixels during a single CCD read-out cycle, and is accounted for as a single event with an energy that is the sum of the energies of the individual photons. Pile-up reduces the observed flux of a source and makes the spectrum artificially harder than it actually is. Only single and double events (patterns 0 to 4) were selected to reduce pile-up effects. Source events were extracted from 53′′ wide columns centered on the source positions. Background events were obtained from columns of the same width, but centered well away from the sources.
In pn Small Window mode, only a 6363 pixel region of the central CCD is read out every 5.7 ms. The count rates of the sources observed in Small Window mode are close to, or above, the 100 s-1 level, above which pile-up effects become important (Strüder et al. 2001). Multiple events that are incorrectly assigned as single should not produce additional line features. We used the SAS task epatplot, which utilizes the relative ratios of single- and double-pixel events which deviate from standard values in case of significant pile-up, as a diagnostic tool in the pn camera Small Window mode data. As expected, this showed that the persistent spectra extracted for all the sources observed in Small Window mode were affected by pile-up. We investigated further the importance of properly correcting for count pile-up in Small Window mode by extracting events in annuli of inner radii 15, 20, and 25′′ and an outer radius of 30′′ centered on the PSF core for MXB 1659298. This source was chosen because it has the highest count rate in Small Window mode (see Table 3). We compared then the results of spectral fits to those obtained when the PSF core was included. We obtained consistent spectral results once events within a radius of 15′′ were excluded. We repeated a similar process for all the sources affected by pile-up and excluded events from the inner 925, 175, and 15′′ radius core of the point spread function (PSF) from the pn spectra of EXO 0748676, 4U 1746371 and MXB 1659298, respectively. In order not to produce any additional uncertainties, we used the same extraction regions for the dip spectra for these sources.
Figure 1 shows the EPIC pn 0.6–10 keV lightcurves of the sources studied here. All the sources except for 4U 1746371 show deep dipping activity. Regular eclipses are visible from EXO 0748676 and MXB 1659298. XMM-Newton has made a number of observations of EXO 0748676 and we chose the 2002 November 12 observation since the dips appeared to be unusually prominent. X 1624490 appears to be already in a deep dip at the start of the observation, and only one dip is seen from XB 1254690 close to the end of the observation. We first excluded X-ray bursts and eclipses from the lightcurves and then selected intervals flagged with thick horizontal lines in Fig. 1 for the extraction of dip spectra and dip-free intervals for the persistent emission spectra. Within the dipping intervals, we extracted between 1 and 5 spectra for each source based on the intensity selection criteria given in Table LABEL:tab:dipselection. EXO 0748676 and MXB 1659298 spectra with dip depths 80% of the persistent emission were excluded from the analysis since they are strongly influenced by background counts.

| Dip Level | Dip depth |
|---|---|
| 1 | 15 % |
| 2 | 15–30 % |
| 3 | 30–50 % |
| 4 | 30–65 % |
| 5 | 65–80 % |
3 Spectral results
| LMXB | (keV) | Mission | Reference | |
|---|---|---|---|---|
| XB 1916053 | 1.87 | 80 | BeppoSAX | Church et al. (1998) |
| XB 1323619 | 1.96 | 44 | BeppoSAX | Bałucińska-Church et al. (1999) |
| EXO 0748676 | 1.27 | 44 | BeppoSAX | Sidoli et al. (2005) |
| XB 1254690 | 1.28 | 5.9 | R–XTE | Smale et al. (2002) |
| 4U 1746371 | 0.39 | 3.5 | BeppoSAX | Parmar et al. (1999) |
| MXB 1659298 | 1.21 | 7.1 | BeppoSAX | Oosterbroek et al. (2001) |
| X 1624490 | 2.00 | 12 | BeppoSAX | Bałucińska-Church et al. (2000) |
We performed spectral analysis using XSPEC (Arnaud 1996) version 11.2, and SPEX (Kaastra et al. 1996) version 2.00.11. We used throughout the photo-electric cross sections of Morrison & McCammon (1983) to account for absorption by neutral gas with solar abundances (abs model within SPEX, and wabs model in XSPEC). Spectral uncertainties are given at 90% confidence (= 2.71 for one interesting parameter), and upper limits at 95% confidence. The values obtained from SPEX were calculated using the expected errors based on the model rather than the observed errors (see the SPEX user’s manual). We quote all s with positive values for both absorption and emission features. We rebinned the EPIC pn spectra to over-sample the full-width at half-maximum () of the energy resolution by a factor 3, and to have a minimum of 25 counts per bin to allow the use of the statistic. To account for systematic effects we added quadratically a 2% uncertainty to each pn spectral bin.
In order to study the different sources in a systematic manner, we used for all the spectra the same continuum consisting of blackbody and power-law components modified by neutral absorption (the abs*(bb+pl) model in SPEX). For each source we fit simultaneously all the EPIC pn spectra of the persistent and dipping intervals with the continuum parameters tied together, while we allowed to vary all the other parameters. We included Gaussian emission profiles when emission features were evident near 1 keV and/or 6 keV. The 1 keV feature has been previously modeled either as an emission line, or as an edge, and its nature is unclear (e.g., Sidoli et al. 2001; Boirin & Parmar 2003; Boirin et al. 2004, 2005). Examination of the spectral residuals reveals strong absorption features around 7 keV for all the sources except EXO 0748676 and 4U 1746371. To account for these narrow features, we included absorption from a photo-ionized plasma (xabs in SPEX) in the spectral model.
The xabs model of SPEX treats, in a simplified manner, the absorption by a thin slab composed of different ions, located between the ionizing source and the observer. It assumes that the angle subtended by the slab as seen from the ionizing source is small. Therefore, emission from the slab and scattering by the slab of the ionizing source into the line-of-sight are neglected, and only absorption and scattering out of the line-of-sight by the slab are considered. The processes taken into account are the continuum and the line absorption by the ions and scattering out of the line-of-sight by the free electrons in the slab. Most continuum opacities are taken from Verner & Yakovlev (1995), while line opacities and wavelengths for most ions are taken from Verner et al. (1996) (see the details and additional references in the SPEX user’s manual). The relative column densities of the ions are coupled through a photo-ionization model. Using codes such as CLOUDY (Ferland 2003), and assuming a broad-band ionizing continuum from infra-red to hard X-rays, the ionic column densities of a photo-ionized slab can be pre-calculated for different values of . SPEX reads in the grid of pre-calculated ionic column densities during the fitting process. In this paper, we use a grid of ionic column densities pre-calculated using CLOUDY and assuming that the ionizing continuum for each source may be represented by a cutoff power-law () with a power-law index, , obtained from the fits to the EPIC pn persistent spectra with the cutoff energy, , fixed to the value measured with BeppoSAX or R-XTE (see Table LABEL:tab:ioniz-cont).
The parameters of the xabs model that were allowed to vary are , and . is the equivalent hydrogen column density of the ionized absorber in units of atom cm-2. is the ionization parameter of the absorber, defined as , where is the luminosity of the ionizing source, the electron density of the plasma and the distance between the slab and the ionizing source. is expressed in units of erg cm s-1, but we will omit the units when quoting values in this paper. is the turbulent velocity broadening of the absorber in km s-1, defined as , where is the total width of a line and the thermal contribution.
We present now the results of the fits for each of the sources individually before discussing the general properties of the absorbers in dipping LMXBs in Sect. 4.
| Persistent | Dip 1 | Dip 2 | Dip 3 | Dip 4 | Dip 5 | ||
| Comp. | |||||||
| Parameter | |||||||
| pl | |||||||
| 2.25 0.03 | |||||||
| ( ph. s-1 keV-1) | 10.0 0.2 | ||||||
| bb | |||||||
| (keV) | 1.95 0.04 | ||||||
| ( cm2) | 0.65 0.08 | ||||||
| abs | |||||||
| ( cm-2) | 0.432 0.002 | 0.444 0.004 | 0.450 0.006 | 0.54 0.02 | 0.60 0.02 | 0.89 0.07 | |
| xabs | |||||||
| ( cm-2) | 4.2 0.5 | 9 2 | 16 2 | 22 2 | 28 2 | 54 3 | |
| (erg cm s-1) | 3.05 0.04 | 2.84 0.04 | 2.75 0.02 | 2.62 | 2.55 0.04 | 2.52 | |
| (km s-1) | 2300 | 50 30 | 90 25 | 120 | 220 | 160 | |
| gau | |||||||
| (keV) | 0.89 0.03 | 0.92 0.04 | 0.88 0.04 | ||||
| (keV) | 0.2 | 0.2 | 0.2 | ||||
| (1044 ph s-1) | 0.6 0.1 | 0.6 0.1 | 0.5 0.3 | ||||
| (10-10 erg cm-2 s-1) | 2.6 | 2.4 | 2.0 | 1.5 | 1.2 | 0.7 | |
| (d.o.f.) | 1.30 (1264) | ||||||
| Exposure (ks) | 9.1 | 2.1 | 1.1 | 0.9 | 0.6 | 0.8 | |
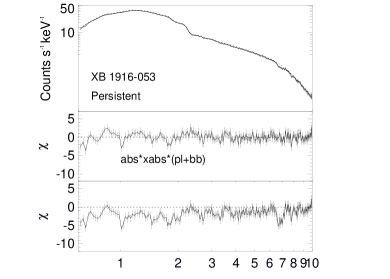

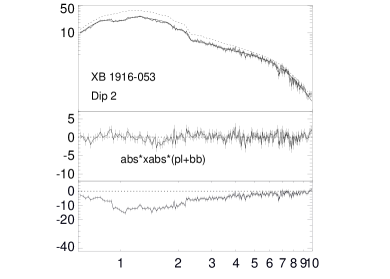

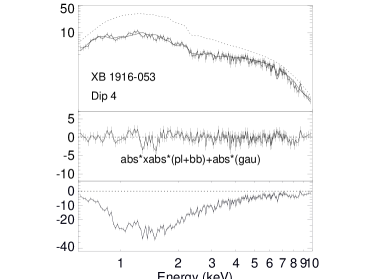

3.1 XB 1916053
Results of the fits of the XB 1916053 persistent and dipping spectra to the abs*xabs*(pl+bb) + abs*(gau) SPEX model are shown in Fig. 2 and the best-fit parameter values are listed in Table LABEL:tab:bestfit-1916. The line and continuum changes can be primarily modeled by changes in the ionized absorber with increasing from to atom cm-2 while decreases from to , with a smaller change in the amount of neutral absorption, , which increases from to atom cm-2. The 1 keV feature is only visible in the Dip 3 to Dip 5 spectra (see Table LABEL:tab:dipselection for Dip definition). The strongest absorption lines in the persistent spectrum are from Fe xxv and Fe xxvi with s of 34 eV and 21 eV, respectively. The Fe xxv and Fe xxvi Ly features are also predicted by the xabs model with s of 7 eV and 4 eV, respectively. During dipping, the of the Fe xxvi line decreases and a feature is observed at an energy 6.6 0.1 keV, possibly originating from a blend of Fe xxv to Fe xix lines. The best-fit value of is for the persistent spectrum. This is significantly lower than the value of 3.92 reported by Boirin et al. (2004). This difference may be explained by the fact that their result is based on the photo-ionized model by Kallman & Bautista (2001) which assumes an ionizing continuum consisting of a power-law with = 1 while we use as ionizing continuum a cutoff power-law of = 1.87 and = 80 keV (see Table 5).
| Persistent | Dip 1 | Dip 2 | Dip 3 | Dip 4 | Dip 5 | ||
| Comp. | |||||||
| Parameter | |||||||
| po | |||||||
| 1.57 0.05 | |||||||
| ( ph. s-1 keV-1) | 3.9 0.2 | ||||||
| bb | |||||||
| (keV) | 1.9 0.1 | ||||||
| ( cm2) | 0.49 0.07 | ||||||
| abs | |||||||
| ( cm-2) | 0.11 | 0.11 | 0.11 | 0.21 | 0.27 0.12 | 0.24 | |
| xabs | |||||||
| ( cm-2) | 3.5 0.2 | 2.3 0.3 | 3.3 0.3 | 4.9 0.3 | 7.8 0.4 | 15.5 0.5 | |
| (erg cm s-1) | 2.45 0.02 | 2.38 0.05 | 2.23 0.07 | 2.23 0.05 | 2.21 0.04 | 2.26 0.03 | |
| (km s-1) | 13 6 | 10 | 26 | 84 | 140 | 130 | |
| gau | |||||||
| (keV) | 0.569 (fixed) | ||||||
| (keV) | 0.20 | 0.20 | 0.20 | 0.20 | 0.17 0.01 | 0.15 | |
| (1044 ph s-1) | 1.85 | 2.3 | 1.6 | 2.9 | 2 | 0.4 | |
| gau | |||||||
| (keV) | 0.915 (fixed) | ||||||
| (keV) | 0.18 0.03 | 0.20 | 0.13 | 0.20 | 0.11 0.04 | 0.11 0.03 | |
| (1044 ph s-1) | 0.18 0.03 | 0.17 0.03 | 0.09 | 0.13 0.04 | 0.06 | 0.04 0.02 | |
| (10-10 erg cm-2 s-1) | 2.2 | 2.3 | 2.1 | 1.9 | 1.6 | 1.3 | |
| (d.o.f) | 1.21 (1341) | ||||||
| Exposure (ks) | 17.6 | 4.4 | 3.6 | 8.2 | 7.1 | 8.6 | |
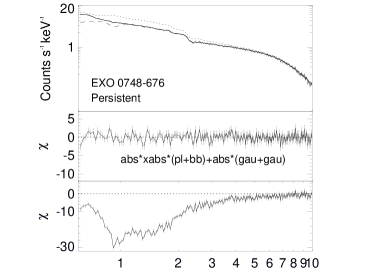
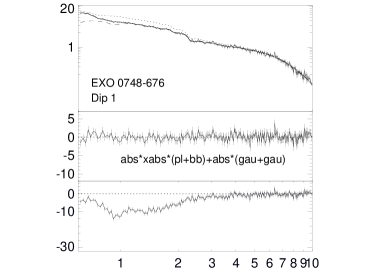
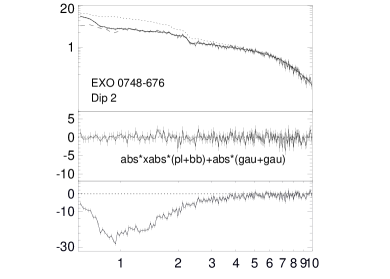
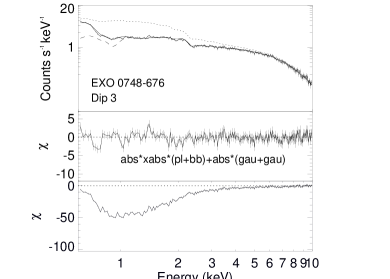


3.2 EXO 0748676
Narrow X-ray absorption lines have been detected from EXO 0748676 during X-ray bursts (Cottam et al. 2002), but such features have not been detected during persistent or dipping intervals. The 0.6–10 keV pn persistent spectrum was first fit using a blackbody and a power-law model, together with photo-electric absorption by neutral material. The fit is unacceptable with a of 10 for 235 degrees of freedom (d.o.f.) due mainly to the presence of strong soft excesses at 2 keV and 1 keV. Even though no strong narrow absorption lines are evident, we investigated the possibility that the soft excesses result from the presence of an ionized absorber by fitting the persistent spectrum with the standard abs*xabs*(pl+bb) SPEX model. A minimum value of atom cm-2 (Sidoli et al. 2005) was imposed on to prevent this parameter going to unrealistically low values. The soft excesses were both well modeled by the ionized absorber, but the fit is still formally unacceptable with a of 3 for 232 d.o.f. Examination of the residuals reveals narrow emission features at energies 2 keV, which were modeled by including two Gaussian emission lines at , and keV, the energies of inter-combination lines of O vii and Ne ix, respectively. The fit is now significantly improved with a of 1.4 for 225 d.o.f. Next we fit the persistent and dipping spectra together in the usual manner with the model abs*xabs*(pl+bb)+abs*(gau+gau). The best-fit parameters are given in Table 7 and the spectra are shown in Fig. 3. The changes in the continuum can be modeled primarily by changes in the ionized absorber with a large increase in from (3.5 0.2 atom cm-2 to (15.5 0.5 atom cm-2 while decreases from 2.45 0.02 to 2.26 0.03. A smaller increase in the amount of neutral absorption from to (0.24 atom cm-2 is required. The ionized absorber is not well constrained due to the absence of strong individually resolved absorption features in the spectra. In contrast, strong absorption edges are evident, which are produced e.g., in the persistent emission, by O viii and Ne x at 0.87 and 1.36 keV with optical depths of 0.39 and 0.09, respectively.
| Persistent | Dip 1 | Dip 2 | Dip 3 | ||
| Comp. | |||||
| Parameter | |||||
| pl | |||||
| 2.09 0.02 | |||||
| ( ph. s-1 keV-1) | 19.4 | ||||
| bb | |||||
| (keV) | 1.09 0.02 | ||||
| ( cm2) | 16.1 0.7 | ||||
| abs | |||||
| ( cm-2) | 0.346 0.002 | 0.340 0.003 | 0.350 0.006 | 0.39 0.01 | |
| xabs | |||||
| ( cm-2) | 8.4 0.3 | 18.6 0.8 | 25 2 | 47 3 | |
| (erg cm s-1) | 4.3 0.1 | 3.9 0.3 | 2.98 | 2.94 0.05 | |
| (km s-1) | 2800 1900 | 70 | 130 35 | 350 | |
| gau | |||||
| (keV) | 6.8 0.1 | ||||
| (keV) | 2.0 | ||||
| (1044 ph s-1) | 0.08 0.01 | ||||
| gau | |||||
| (keV) | 1.00 0.02 | 0.99 0.04 | 1.07 0.03 | 1.06 0.05 | |
| (keV) | 0.2 | 0.2 | 0.2 | 0.2 | |
| (1044 ph s-1) | 0.28 0.06 | 0.22 0.07 | 0.2 | 0.2 | |
| (10-10 erg cm-2 s-1) | 6.4 | 5.8 | 4.8 | 3.4 | |
| (d.o.f.) | 1.23 (846) | ||||
| Exposure (ks) | 11.5 | 2.7 | 0.6 | 0.2 | |


3.3 XB 1254690
The XMM-Newton lightcurve of XB 1254690 shows evidence for enhanced background counting rates at the time of occurrence of the dip, with background peak count rates 10 s-1, compared to a source count rate of 90 s-1 during deepest dipping. For this reason Boirin & Parmar (2003) did not examine the spectral changes during the dip seen from XB 1254690. Since this is the only XMM-Newton observation of a dip from XB 1254690, we included the dip data in our analysis. We caution that even though background subtraction is not critical for such a bright source, the spectral fits may be affected by the enhanced background. The best-fits of the persistent and dipping emission of XB 1254690 to the abs*xabs*(pl+bb) + abs*(gau) SPEX model are shown in Fig. 4 and the parameter values given in Table LABEL:tab:bestfit-1254. The changes in the continuum can be modeled primarily by changes in the ionized absorber with increasing from to atom cm-2 while decreases from to with a smaller increase in the amount of neutral absorption, from (0.346 0.002 to (0.39 0.01 atom cm-2.
The deepest line in the persistent spectrum is identified with Fe xxvi 1s-2p Ly with an of eV and is superposed on a broad emission feature with an energy of 6.8 0.1 keV and a normalization of (0.08 0.01 photon s-1 (see Fig. 4). The second strongest line is identified with a mixture of Fe xxvi 1s-2p Ly and Ni xxviii with an of eV. During dipping, the of the Fe xxvi line decreases and lines of less-ionized species of Fe, such as Fe xxv, appear.
3.4 4U 1746371
No narrow X-ray absorption features have been reported for this source. The observation starts during a dip and two more complete dips are present in the lightcurve (Fig. 1). The dips are very shallow (85% of the persistent emission remains) and difficult to identify. We find a dip recurrence period of 5.1 hr, in agreement with the value of 5.16 0.01 hr reported in Bałucińska-Church et al. (2004). The observation was divided into persistent and dip spectra which were fit separately using an absorbed power-law and blackbody wabs(bb+pl) model. The fit quality is acceptable with s of 1.32 and 1.23 for 229 d.o.f for persistent and dip spectra, respectively. Examination of the residuals reveals a broad emission feature at an energy of 6.4 keV in both spectra. This feature was modeled as a Gaussian emission line with energies of keV and keV, widths () of 0.85 keV and s of 181 55 eV and 175 60 eV for the persistent and dip spectra, respectively. This results in s of 1.23 and 1.14 for 226 d.o.f. The F-statistic values of 6.33 and 7.38 indicate that the probability of such a decrease occurring by chance is and . A Gaussian absorption line with an energy of keV, a width () of 0.80 keV and an of eV is the best-fit to the absorption feature in the persistent spectrum. This results in a of 1.21 for 223 d.o.f. The F-statistic value of 2.19 indicates that the probability of such a decrease occurring by chance is only 0.09. Table LABEL:tab:fouru-xspec gives the best-fit parameters and the residuals are shown in Fig. 5.
The Fe xxvi narrow absorption feature indicates the presence of a highly-ionized absorber. The upper limit to a narrow feature at the energy of Fe xxv is 5 eV. We then fit the persistent and dip spectra simultaneously with the abs*xabs*(pl+bb)+abs*(gau+gau) model of SPEX. Unfortunately, due to the shallowness of the Fe xxvi feature the highly-ionized absorber is not well constrained and the best-fit values of are highly correlated with variations in the normalization of the continuum.
3.5 MXB 1659298
The best-fit parameters of the MXB 1659298 persistent and dipping emission to the abs*xabs*(pl+bb) + abs*(gau+gau) SPEX model are shown in Table LABEL:tab:bestfit-1659 and the spectra and residuals in Fig. 6. The changes in the continuum can be modeled primarily by a change in the ionized absorber with increasing from (11.1 0.6 to (53 3 atom cm-2 while decreases from 3.8 0.1 to with a smaller change in the amount of neutral absorption, which increases from (0.306 0.003 to (0.71 0.04 atom cm-2.
The 1 keV feature is not visible in the Dip 1 and 2 spectra. The 7 keV broad emission feature is only present in the persistent spectrum. The strongest absorption lines in the persistent spectrum are identified with Fe xxv and Fe xxvi with s of 32 eV and 48 eV, respectively (see Fig. 6). Fe xxv and Fe xxvi Ly absorption features are also predicted by the xabs model with s of 9 eV and 12 eV, respectively. During dipping, the of the Fe xxvi line decreases and the feature observed at an energy of keV is identified with a blend of Fe xxv to Fe xix lines.
From all the studied sources MXB 1659298 shows the deepest Fe xxv and Fe xxvi absorption lines and is the only dipping LMXB which shows strong narrow absorption lines in the RGS (Sidoli et al. 2001). The latter features are produced by O viii 1s-2p, 1s-3p, 1s-4p and Ne x 1s-2p, at 18.95, 16.00, 15.21 0.01 and 12.15 and indicate the presence of less ionized material than that responsible for the Fe xxv and Fe xxvi absorption features. Thus, the absorbing material may have a range of ionization states: the material closer to the compact object may be more ionized and produce the Fe xxv and Fe xxvi lines while the one farther from the compact object may be less ionized and produce the O viii and Ne x lines. The latter features are however not predicted by the xabs model. This is probably because when fitting an absorber with only one ionization state, the Fe xxv and Fe xxvi lines dominate over the O viii and Ne x lines due to their larger s. We next performed a fit to the persistent RGS first order spectra with the SPEX abs*xabs*(pl) model. The RGS dipping spectra have too few counts for spectral fitting. We find = (0.287 0.007 atom cm-2, = atom cm-2, = 3.1 0.3 and = 190 km s-1. The uncertainties in these parameters are large in comparison with those found for the pn fit. Despite the uncertainties, a less ionized absorber is required by the RGS data compared to the pn. Narrow absorption features of O viii 1s-2p, 1s-3p, 1s-4p and Ne x 1s-2p are predicted by the xabs model with s of 2.2, 0.7, 0.3 and 2.0 eV, respectively. These values are slightly lower than those found by Sidoli et al. (2001) of 2.6 0.4, 1.3 0.4, 1.6 0.4 and 2.1 0.4 eV for the corresponding lines. This difference may be explained by our use of a complete photo-ionized absorber rather than individual spectral features. Thus, the assumption of a range of different ionization states for the absorber seems correct. However, when we added a second absorber to our model with fixed to the RGS value and performed a fit to the pn persistent spectrum, the of the fit did not improve significantly. This suggests that the nature of the absorber is even more complex. Alternatively, the O viii and Ne x features may be too weak in the pn spectrum to constrain properly the second ionized absorber, since such features have been reported only in the RGS data, which has a resolution ( of 300 compared to 12 for the pn at 1 keV.
| Comp. | Parameter | Value |
|---|---|---|
| wabs | ( cm-2) | 0.37 0.01 |
| pl | 1.69 0.03 | |
| (photon keV-1 cm-2 s-1) | 0.115 0.003 | |
| bb | (keV) | 1.28 0.04 |
| () | (3.6 0.2) | |
| Emission | (keV) | 6.45 |
| (keV) | 0.85 | |
| (eV) | 181 55 | |
| Fe xxvi | (keV) | 6.9 0.1 |
| absorption | (keV) | 0.80 |
| (eV) | 30 15 |

| Persistent | Dip 1 | Dip 2 | Dip 3 | Dip 4 | Dip 5 | ||
| Comp. | |||||||
| Parameter | |||||||
| pl | |||||||
| 1.96 0.03 | |||||||
| ( ph. s-1 keV-1) | 51 2 | ||||||
| bb | |||||||
| (keV) | 1.14 0.03 | ||||||
| ( cm2) | 59 5 | ||||||
| abs | |||||||
| ( cm-2) | 0.306 0.003 | 0.302 0.005 | 0.34 0.01 | 0.40 0.02 | 0.47 0.04 | 0.71 0.04 | |
| xabs | |||||||
| ( cm-2) | 11.1 0.6 | 20 2 | 19 4 | 18 3 | 24 3 | 53 3 | |
| (erg cm s-1) | 3.8 0.1 | 3.7 0.2 | 2.9 0.1 | 2.55 | 2.42 | 2.42 | |
| (km s-1) | 700 | 150 | 160 | 140 | 140 | 110 | |
| gau | |||||||
| (keV) | 6.4 0.2 | ||||||
| (keV) | 2 | ||||||
| (1044 ph s-1) | 0.53 0.08 | ||||||
| gau | |||||||
| (keV) | 0.99 0.03 | 0.96 0.03 | 0.92 0.03 | 0.93 0.02 | |||
| (keV) | 0.11 | 0.15 0.09 | 0.2 | 0.2 | |||
| (1044 ph s-1) | 0.4 0.2 | 1.7 | 3 2 | 2.2 0.6 | |||
| (10-10 erg cm-2 s-1) | 9.7 | 8.9 | 7.9 | 6.6 | 5.4 | 2.9 | |
| (d.o.f.) | 1.22 (1096) | ||||||
| Exposure (ks) | 11.8 | 2.16 | 0.48 | 0.56 | 0.35 | 1.33 | |


3.6 X 1624490
| Dip 1 | Dip 2 | Dip 3 | Dip 4 | Dip 5 | ||
| Comp. | ||||||
| Parameter | ||||||
| pl | ||||||
| 1.90 | ||||||
| ( ph. s-1 keV-1) | 120 | |||||
| bb | ||||||
| (keV) | 1.20 | |||||
| ( cm2) | 64 | |||||
| abs1 | ||||||
| ( cm-2) | 10.7 0.5 | 11.8 0.9 | 14 2 | 31 2 | 59 | |
| xabs | ||||||
| ( cm-2) | 13 2 | 15 4 | 27 4 | 29 4 | 68 9 | |
| (erg cm s-1) | 3.6 0.2 | 3.2 0.3 | 2.9 0.2 | 3.0 0.2 | 3.3 | |
| (km s-1) | 280 | 140 | 128 | 94 | 110 | |
| Halo | ||||||
| abs2 | ||||||
| Halo ( cm-2) | 10.7 0.5 | |||||
| etau | ||||||
| 1.8 0.2 | ||||||
| (10-10 erg cm-2 s-1) | 8.3 | 7.5 | 5.8 | 4.0 | 2.0 | |
| (d.o.f.) | 1.15 (729) | |||||
| Exposure (ks) | 0.3 | 0.1 | 0.2 | 0.4 | 0.9 | |


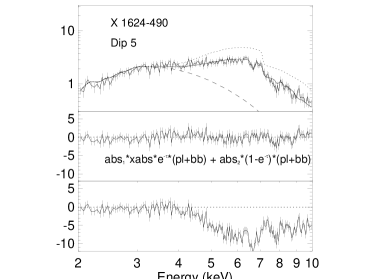
The radial intensity profile of the source obtained using the EPIC pn image revealed a constant excess in intensity at large radii (30′′) during both persistent and dipping intervals, demonstrating the presence of a dust-scattering halo, first detected from this source by Angelini et al. (1997). The galactic column density of X 1624490 is high ( atom cm-2, Parmar et al. 2002), so that a dust scattered halo is expected. To model this we used abs1*xabs*e-τ(bb+pl) + abs2*(1-e-τ)*(bb+pl). The first component represents the contribution of the source reduced by a factor e-τ (component etau in SPEX), corresponding to scattering out of the line of sight. The scattering into the line of sight due to the halo is represented by the second component and is expected to be the same for persistent and dipping spectra. is defined as E-2, where is the optical depth at 1 keV and E-2 is the theoretical energy dependence of the dust scattering cross-section. Unfortunately, the X 1624490 persistent spectrum is strongly piled-up and counts from the inner circle of 20′′ radius had to be excluded. Thus, the resultant spectra contain a larger fraction of the halo component. For this reason we decided to use only the dipping spectra for the fit, since then the inner 20′′ radius circle does not have to be excluded and there is a larger contribution from direct source emission. We imposed a lower limit of 1.90 to the power-law photon index, , to prevent it becoming negative without significantly changing the of the fit. The value of 1.90 was taken from Parmar et al. (2002) (their value of = 2.02 0.12 gives a minimum value of 1.90). The of the neutral absorber for the Dip 1 spectrum was coupled to the value of for the halo, assuming that the source must be at least as absorbed as the halo. The best-fits parameters for the dipping emission of X 1624490 are shown in Table LABEL:tab:bestfit-1624 and the spectra and residuals in Fig. 7. Significant changes in both the ionized and neutral absorbers are required to obtain satisfactory fits with increasing from (10.7 0.5 to atom cm-2 and from (13 2 to (68 9 atom cm-2. The value of decreases from 3.6 0.2 to 3.0 0.2 between Dip 1 and Dip 4. For Dip 5 the value of is not well constrained and we can only give a lower limit of . Below 5 keV the contribution of the halo (dashed line) dominates during the deepest dip stages. The optical depth of the dust, = 1.8 0.2, is consistent with that found by Bałucińska-Church et al. (2000) of 2.4 0.4.
4 Ionized absorber properties
Examination of the spectral fit results (Tables 6 to 11) shows that we are able to successfully account for the complex changes in the 0.6–10 keV continuum and absorption lines during dips from the LMXB studied here (with the exception of 4U 1746371 where the dips are very shallow) by large increases in the column density, , and decreases in the amount of ionization, , of a highly-ionized absorber, together with much smaller increases in the of a neutral absorber (for X 1624490 the increase in the column densities of the neutral and ionized absorbers are comparable). The s of the lines predicted by xabs are consistent with previous measurements for the persistent emission (see Table 2).
During the persistent intervals, the values of are poorly constrained, except for EXO 0748676 (see Tables 6 to 11). This is evidence for the absorption lines being unsaturated, i.e. on the linear part of the curve of growth, where the increases linearly with the column density, independently of the velocity broadening. In contrast, in the deep dipping spectra, the values of tend to be poorly constrained whereas is well constrained. This indicates that the lines are probably saturated and their s do not strongly depend on the column density, but rather increase with velocity broadening. EXO 0748676 is very likely in a saturated regime already in the persistent emission. This is indicated by the well constrained value together with the presence of absorption edges stronger than the narrow absorption features.
We tried to model the spectral changes during dipping emission of the studied LMXBs by changes only in the highly-ionized absorbers present in these systems, but we could not obtain successful fits when the deep dipping spectra are included, unless the of the neutral absorber is allowed to vary. As an example, we could adequately model the XB 1916053 persistent and dipping spectra when the was fixed for the persistent, Dip 1 and Dip 2 spectra ( = 1.36 for 1266 d.o.f.), but the fit quality became unacceptable when we fixed the of the deeper (Dip 3 to Dip 5) spectra, with structured residuals evident 2 keV and a = 2.44 for 1269 d.o.f. This means that the spectral evolution requires changes in both the ionized and the neutral absorbers.
For all the sources, the strongest absorption lines in the persistent spectra are the Fe xxv and Fe xxvi 1s-2p transitions except for XB 1254690, where the absorber is the most highly ionized with = 4.2 0.2 and only the Ly and Fe xxvi absorption features are evident. EXO 0748676 and 4U 1746371 do not exhibit strong absorption lines. Our analysis indicates that the EXO 0748676 absorber is significantly less ionized than in the other LMXBs studied with = . This could indicate that the intervals identified as “persistent” in Fig. 1 are not actually dip-free, and the source may be continuously dipping. This idea is supported by the large fraction of time that the source appears to be dipping, the well constrained value of during the “persistent” interval (Table 7) which may indicate that the source is already in the saturated line regime reached by the other sources only during dipping (see above), and by the low luminosity when compared to the other sources with similar values of (Table 1). In contrast, for 4U 1746371 the non-detection of an Fe xxv absorption feature and the evidence of one from Fe xxvi indicate a highly-ionized absorber, similar to the one in XB 1254690. If the absorbing material is almost completely ionized, no strong absorption lines will be observed. Alternative explanations for the lack of deep absorption lines in 4U 1746371 include an unusually low metallicity (e.g., Parmar et al. 1999), or a viewing angle outside of the ionized plasma.
In order to investigate the effect of uncertainties in the ionizing continuum on the spectral parameters for the ionized absorbers, we performed fits to the XB 1254690 spectra, using ionizing continua generated with, and without, the 5.9 keV cutoff. Variations in are likely to dominate the uncertainties in the ionizing continuum since the cutoff measurements cannot be obtained from fits to the pn spectra, due to the restricted energy range of this instrument (0.6–10 keV), whilst the power-law indices are directly fit up to 10 keV. XB 1254690 was chosen for this analysis since it has the lowest cutoff energy in Table LABEL:tab:ioniz-cont, except for 4U 1746371, which only exhibits shallow dips. The best-fit values of and are consistent within the errors for both ionization continua, while decreases by 0.3 when the cutoff is not included. Since this represents an extreme range of the likely ionization continua, the actual uncertainties due to variations in the cutoff of the ionizing continuum are likely to be significantly smaller than this.
The changes in absorber properties for each source as it evolves from persistent to deep dipping do not strongly depend on the ionizing continuum used. Figure 8 shows the evolution of and from persistent to the deepest dip intervals for each source. A similar evolution of decreasing and increasing is observed for all sources, being the evolution stronger from persistent to Dip 2 stages than between dips. For EXO 0748676, the evolution of the highly-ionized absorber is unusually small compared to the other sources. This could be explained if EXO 0748676 were in a continuous dipping state (see above). Figure 9 shows the evolution of , with respect to the ionized absorber, , from persistent to deepest dip intervals for each source. The increase of is small in comparison to . XB 1254690 shows a particularly small increase in compared to the other sources. This may indicate that we are viewing XB 1254690 at an inclination angle such that the line of sight is not obscured by additional neutral material at any orbital phase and the dips result only from additional obscuration by the ionized absorber. Thus, the source may be being viewed relatively far from the plane of the accretion disk and only the ionized absorber significantly intercepts the line of sight. This special geometry and small changes in the size of the ionized absorber may explain the remarkable complete occasional disappearance of dipping activity from this source (Smale et al. 2002; Boirin & Parmar 2003). If this picture is correct, the large changes in observed from X 1624490 during dips would indicate that we are viewing this source very close to the plane of the accretion disk.


Table 12 shows the changes in the properties of the neutral and highly-ionized absorbers from persistent (Dip 1 for X 1624490) to deepest dip phases. We include in this table results for XB 1323619 derived from the spectral fits presented in Boirin et al. (2005). These authors fixed the normalizations of the dipping spectra to that of the persistent spectrum, thus a larger change in the neutral absorber column may be necessary to account for the changes when compared to fitting simultaneously the persistent and dipping spectra, as was done for the other sources. It is interesting that the eclipsing binaries EXO 0748676 and MXB 1659298 (together with the non-eclipsing system X 1624490) show the largest change in . This suggests that the size of the change in may be related to the inclination angle. This supports the idea that we are seeing X 1624490 and XB 1254690 very close to, and relatively far from, the planes of the accretion disks. Alternative explanations for the large increase in for X 1624490 include the high luminosity of this source, uncertainties in modeling the dust scattering halo, or an absorber rich in blobs of neutral material. Furthermore, XB 1254690 and XB 1323619, which show the smallest relative changes of , have also the less deep dips, consistent with viewing the sources relatively far from the disk plane. We do not find a correlation between the dip depth and the change in or . EXO 0748676 and MXB 1659298, which show the deepest dips, have also the lowest values of during the deepest dips. The change in is approximately the same for all the sources except EXO 0748676. This is shown in Fig. 10 by plotting the changes of the neutral and ionized absorbers versus and of the studied sources. Note that we have excluded X 1624490 from this figure, whose persistent emission has not been analyzed, and EXO 0748676, which may be continuously dipping. In contrast to , the change of appears to increase with the source and .
| LMXB | pers | gal | / | pers | pers | dip | Dip | ||
|---|---|---|---|---|---|---|---|---|---|
| (pers-gal) | depth | ||||||||
| XB 1916053 | 0.432 0.002 | 0.46 0.07 | 0.27 | 2.8 0.4 | 4.2 0.5 | 50 3 | 3.05 0.04 | 2.52 | 80% |
| XB 1323619a | 3.50 0.02 | 0.7 0.2 | 1.57 | 0.4 0.1 | 3.8 0.4 | 33 2 | 3.9 0.1 | 3.13 0.07 | 75% |
| EXO 0748676 | 0.11 | 0.13 | 0.11 | 3.5 0.2 | 12.0 0.5 | 2.45 0.02 | 2.26 0.03 | 85% | |
| XB 1254690 | 0.346 0.002 | 0.04 0.01 | 0.31 | 1.0 0.3 | 8.4 0.3 | 39 3 | 4.3 0.1 | 2.94 0.05 | 50% |
| MXB 1659298 | 0.306 0.003 | 0.40 0.04 | 0.19 | 3.5 0.4 | 11.1 0.6 | 42 3 | 3.8 0.1 | 2.42 | 85% |
| X 1624490b | 10.7 0.5 | 48 | 2.22 | 5.7 | 13 2 | 55 9 | 3.6 0.2 | 3.3 | 80% |
aValues for XB 1323619 are derived from the spectral fits in Boirin et al. (2005).
00footnotetext: bThe changes for X 1624490 are calculated
between the Dip 1 and Dip 5 stages.

It is interesting to compare the values of the ionization parameter for the different sources. Since , the relation between and can provide information about the distance between the absorbing material and the ionizing source, . Figure 11 shows the ionized absorber parameters and as a function of and source luminosity for the persistent emission. Note that we excluded X 1624490 and EXO 0748676 from this figure (see above). The and of the absorbers in our sample appear to increase with luminosity. Since the luminosity is proportional to the mass accretion rate, this suggests that the column of the ionized absorber increases with the mass accretion rate. MXB 1659298 has a lower than the less luminous XB 1254690. This indicates that either or are much larger for MXB 1659298 than for XB 1254690. Assuming a constant , the evolution of with log suggests that for low sources, the change of is small compared to the , while for sources with 1037 erg s-1, increases faster than . There may also be a correlation between or and . The increase of with log indicates that the system period is less important than the luminosity of the system for the degree of ionization of the plasma, since otherwise systems with small , and correspondingly smaller distances between the source and the absorber, should ionize more effectively the absorbing material.

We can compare the thickness of the slab of ionized absorbing material, , with the distance between the ionizing source and the slab, . Since and /, we can calculate the ratio, , as . We estimated a range of possible ratios for persistent and deepest dip emission taking into account the uncertainties in the determination of and . We considered the circularization radius as the minimum possible value for and 0.8, where is the radius of the Roche lobe, as the maximum possible value for . We assumed that the accretion occurs via Roche lobe overflow and calculated the radii from (eqs. 4.16 from Frank et al. 1992, and 4.18 from Shore et al. 1994). In the determination of the largest uncertainty is given by the uncertainty in the distance. We calculated an average value for the distance from all the values given in the literature and considered an uncertainty of 3 kpc for each source (see Table 13).
We note that during dipping emission EXO 0748676 and MXB 1659298, which have relatively cool absorbers ( 2.5) and show deep and sharp dips, have , while the sources with more ionized absorbers have . During persistent emission, all the values of are consistent with (taking uncertainties into account) except for XB 1916053 and EXO 0748676, which show small values of ( 0.04-0.6) and the smallest values of . This may indicate that the material responsible for the ionized absorption seen during persistent emission is clumpy and located at the outer edge of the accretion disk for XB 1916053 and EXO 0748676 and distributed on a significant fraction of the accretion disk for the other sources.
| LMXB | r | dist | (d/r)pers | (d/r)dip |
|---|---|---|---|---|
| (1010 cm) | (kpc) | |||
| XB 1916053 | 1.1-2.0 | 6-12 | 0.07-0.5 | 0.3-2 |
| XB 1323619 | 1.5-4.2 | 7-13 | 0.5-5 | 0.9-8 |
| EXO 0748676 | 1.7-4.9 | 5-11 | 0.04-0.6 | 0.1-2 |
| XB 1254690 | 1.7-4.9 | 8-14 | 1-12 | 0.3-3 |
| MXB 1659298 | 2.1-7.0 | 10-16 | 0.4-3 | 0.07-0.6 |
| X 1624490 | 3.8-13.3 | 12-18 | 0.3-2 | 0.8-6 |
5 Discussion
We have demonstrated that the complex changes in the 0.6–10 keV continuum and absorption lines during dips from most of the LMXBs studied may be self-consistently understood as resulting from large increases in and decreases in of a highly-ionized absorber, together with much smaller increases in the of a neutral absorber. These changes are similar to those found by Boirin et al. (2005) for XB 1323619. We do not need to invoke unusual abundances or partial coverage of an extended emission region to account for these changes.
Narrow X-ray absorption lines were first detected from the superluminal jet sources GRO J165540 (Ueda et al. 1998; Yamaoka et al. 2001) and GRS 1915+105 (Kotani et al. 2000; Lee et al. 2002). GRO J165540 has been observed to undergo deep absorption dips (Kuulkers et al. 1998) consistent with observing the source at an inclination angle of – (e.g., Orosz & Bailyn 1997; Van der Hooft et al. 1998). Recently Chandra HETGS observations of the black hole candidates GX 3394, XTE J1650500 and H 1743322 (Miller et al. 2004a, b) have revealed the presence of variable, blue-shifted, highly-ionized absorption features which are interpreted as evidence for outflows. While Fe xxv and Fe xxvi features are present in the H 1743322 spectrum, GX 3394 and XTE J1650500 show O viii and Ne ix or Ne ii features from less ionized material. These features suggest that a warm absorber analogous to those seen in many Seyfert galaxies is present in systems such as GX 3394 and XTE J1650500 (Miller et al. 2004a). In contrast, Miller et al. (2004b) propose for H 1743322 a highly-ionized absorber, which may be a precursor to the cooler outflows observed in GX 3394 and XTE J1650500. XMM-Newton observations of the LMXB GX 13+1 revealed absorption features due to Ca xx, Fe xxv and Fe xxvi (Sidoli et al. 2002) and an ionized outflow with a velocity of 400 km s-1 was reported by Ueda et al. (2004). Blueshifted outflows have not been detected from any of the dipping LMXBs (Sidoli et al. 2001; Parmar et al. 2002; Boirin & Parmar 2003; Boirin et al. 2004, 2005). However, these results are all obtained with the EPIC which has a factor 4 poorer energy resolution than the HETGS at 6 keV limiting the sensitivity to shifts 1000 km s-1. Since dipping sources are simply normal LMXBs viewed from close to the orbital plane, this also implies that ionized absorbers, frequent in micro-quasars and AGNs (e.g., Reynolds 1997; Blustin et al. 2005), are also a common feature of LMXBs. Outside of the dips, the properties of the absorption lines do not appear to vary strongly with orbital phase. This suggests that the ionized plasma in LMXBs has a cylindrical geometry with a maximum column density close to the plane of the accretion disk.
The spectral changes during dips from LMXBs are often modeled using the “progressive covering”, or “complex continuum” approach (e.g., Church & Balucinska-Church 1995; Barnard et al. 2001). There the X-ray emission is assumed to originate from a point-like blackbody, or disk-blackbody component, together with an extended power-law component. This approach models the spectral changes during dipping intervals by the partial and progressive covering of the extended component by an opaque absorber. We have self-consistently demonstrated that changes in the properties of an ionized absorber provide an alternative explanation for the overall spectral changes during dips from all the dipping LMXBs studied by XMM-Newton. Further investigations and particularly the high spectral resolution observations of LMXBs expected from Astro-E2 should allow many of the features predicted by the ionized absorber model to be characterized and outflowing plasmas in LMXBs to be studied.
Acknowledgements.
Based on observations obtained with XMM-Newton, an ESA science mission with instruments and contributions directly funded by ESA member states and the USA (NASA). M. Díaz Trigo acknowledges an ESA Fellowship. SRON is supported financially by NWO, the Netherlands Organization for Scientific Research. We thank the anonymous referee for helpful comments.References
- Angelini et al. (1997) Angelini, L., Parmar, A., & White, N. 1997, in Astr. Soc. of the Pacific Conf. Series, 685
- Angelini & White (2003) Angelini, L. & White, N. E. 2003, ApJ, 586, L71
- Arnaud (1996) Arnaud, K. A. 1996, in ASP Conf. Ser. 101: Astronomical Data Analysis Software and Systems V, 17
- Bałucińska-Church et al. (2004) Bałucińska-Church, M., Church, M. J., & Smale, A. P. 2004, MNRAS, 347, 334
- Bałucińska-Church et al. (2000) Bałucińska-Church, M., Humphrey, P. J., Church, M. J., & Parmar, A. N. 2000, A&A, 360, 583
- Bałucińska-Church et al. (1999) Bałucińska-Church, M., Church, M. J., Oosterbroek, T., et al. 1999, A&A, 349, 495
- Barnard et al. (2001) Barnard, R., Balucińska-Church, M., Smale, A. P., & Church, M. J. 2001, A&A, 380, 494
- Blustin et al. (2005) Blustin, A. J., Page, M. J., Fuerst, S. V., Branduardi-Raymont, G., & Ashton, C. E. 2005, A&A, 431, 111
- Boirin et al. (2005) Boirin, L., Méndez, M., Díaz Trigo, M., Parmar, A. N., & Kaastra, J. S. 2005, A&A, 436, 195
- Boirin & Parmar (2003) Boirin, L. & Parmar, A. N. 2003, A&A, 407, 1079
- Boirin et al. (2004) Boirin, L., Parmar, A. N., Barret, D., Paltani, S., & Grindlay, J. E. 2004, A&A, 418, 1061
- Church & Balucinska-Church (1995) Church, M. J. & Balucinska-Church, M. 1995, A&A, 300, 441
- Church et al. (1998) Church, M. J., Parmar, A. N., Balucinska-Church, M., et al. 1998, A&A, 338, 556
- Cottam et al. (2002) Cottam, J., Paerels, F., & Mendez, M. 2002, Nature, 420, 51
- Courvoisier et al. (1986) Courvoisier, T. J. L., Parmar, A. N., Peacock, A., & Pakull, M. 1986, ApJ, 309, 265
- Den Herder et al. (2001) Den Herder, J. W., Brinkman, A. C., Kahn, S. M., et al. 2001, A&A, 365, L7
- Dickey & Lockman (1990) Dickey, J. M. & Lockman, F. 1990, ARA&A
- Ferland (2003) Ferland, G. J. 2003, ARA&A, 41, 517
- Frank et al. (1992) Frank, J., King, A. R., & Raine, D. J. 1992, Accretion power in astrophysics (Cambridge and New York, Cambridge University Press)
- Jansen et al. (2001) Jansen, F., Lumb, D., Altieri, B., et al. 2001, A&A, 365, L1
- Kaastra et al. (1996) Kaastra, J. S., Mewe, R., & Nieuwenhuijzen, H. 1996, in UV and X-ray Spectroscopy of Astrophysical and Laboratory Plasmas. Frontiers science series, no.15, 411
- Kallman & Bautista (2001) Kallman, T. & Bautista, M. 2001, ApJS, 133, 221
- Kotani et al. (2000) Kotani, T., Ebisawa, K., Dotani, T., et al. 2000, ApJ, 539, 413
- Kuulkers et al. (1998) Kuulkers, E., Wijnands, R., Belloni, T., et al. 1998, ApJ, 494, 753
- Lee et al. (2002) Lee, J. C., Reynolds, C. S., Remillard, R., et al. 2002, ApJ, 567, 1102
- Miller et al. (2004a) Miller, J. M., Raymond, J., Fabian, A. C., et al. 2004a, ApJ, 601, 450
- Miller et al. (2004b) Miller, J. M., Raymond, J., Homan, J., et al. 2004b, ArXiv Astrophysics e-prints, astro-ph/0406272
- Morrison & McCammon (1983) Morrison, R. & McCammon, D. 1983, ApJ, 270, 119
- Oosterbroek et al. (2001) Oosterbroek, T., Parmar, A. N., Sidoli, L., in’t Zand, J. J. M., & Heise, J. 2001, A&A, 376, 532
- Orosz & Bailyn (1997) Orosz, J. A. & Bailyn, C. D. 1997, ApJ, 477, 876
- Parmar et al. (2002) Parmar, A. N., Oosterbroek, T., Boirin, L., & Lumb, D. 2002, A&A, 386, 910
- Parmar et al. (1999) Parmar, A. N., Oosterbroek, T., Guainazzi, M., et al. 1999, A&A, 351, 225
- Parmar et al. (1986) Parmar, A. N., White, N. E., Giommi, P., & Gottwald, M. 1986, ApJ, 308, 199
- Reynolds (1997) Reynolds, C. S. 1997, MNRAS, 286, 513
- Ritter & Kolb (2003) Ritter, H. & Kolb, U. 2003, A&A, 404, 301
- Shore et al. (1994) Shore, S. N., Livio, M., & van den Heuvel, E. P. J. 1994, Interacting Binaries (Springer Verlag)
- Sidoli et al. (2001) Sidoli, L., Oosterbroek, T., Parmar, A. N., Lumb, D., & Erd, C. 2001, A&A, 379, 540
- Sidoli et al. (2005) Sidoli, L., Parmar, A. N., & Oosterbroek, T. 2005, A&A, 429, 291
- Sidoli et al. (2002) Sidoli, L., Parmar, A. N., Oosterbroek, T., & Lumb, D. 2002, A&A, 385, 940
- Smale et al. (2002) Smale, A. P., Church, M. J., & Bałucińska-Church, M. 2002, ApJ, 581, 1286
- Smale et al. (1992) Smale, A. P., Mukai, K., Williams, O. R., Jones, M. H., & Corbet, R. H. D. 1992, ApJ, 400, 330
- Strüder et al. (2001) Strüder, L., Briel, U., Dennerl, K., et al. 2001, A&A, 365, L18
- Turner et al. (2001) Turner, M. J. L., Abbey, A., Arnaud, M., et al. 2001, A&A, 365, L27
- Ueda et al. (1998) Ueda, Y., Inoue, H., Tanaka, Y., et al. 1998, ApJ, 492, 782
- Ueda et al. (2004) Ueda, Y., Murakami, H., Yamaoka, K., Dotani, T., & Ebisawa, K. 2004, ApJ, 609, 325
- Van der Hooft et al. (1998) Van der Hooft, F., Heemskerk, M. H. M., Alberts, F., & van Paradijs, J. 1998, A&A, 329, 538
- Verner et al. (1996) Verner, D. A., Verner, E. M., & Ferland, G. J. 1996, Atomic Data and Nuclear Data Tables, 64, 1
- Verner & Yakovlev (1995) Verner, D. A. & Yakovlev, D. G. 1995, A&AS, 109, 125
- White & Swank (1982) White, N. E. & Swank, J. H. 1982, ApJ, 253, L61
- Yamaoka et al. (2001) Yamaoka, K., Ueda, Y., Inoue, H., et al. 2001, PASJ, 53, 179