The Luminosity Function of Early-type Field Galaxies at
Abstract
We measure the luminosity function of morphologically selected E/S0 galaxies from to using deep high resolution Advanced Camera for Surveys (ACS) imaging data. Our data extend 2 magnitudes deeper than the Deep Groth Strip Survey (DGSS). At , we find and , and at , we find . Our morphologically selected luminosity functions are similar in both shape and number density to other morphologically selected luminosity functions (e.g., DGSS), but we find significant differences to the luminosity functions of samples selected using morphological proxies like colour or SED. The difference is due to incompleteness from blue E/S0 galaxies, which make up to of the sample and contamination from early-type spirals. Most of the blue E/S0 galaxies have similar structural properties to the red E/S0s and could passively evolve to form giant red ellipticals at . However, the bluest, , have much smaller Sersic parameters and would evolve into much fainter galaxies. These may be the progenitors of dwarf ellipticals. We demonstrate the need for both morphological and colour information to constrain the evolution of E/S0 galaxies.
1Institute for Astronomy, Royal Observatory,
Blackford Hill, Edinburgh, EH9 3HJ, UK.
2Department of Physics and Astronomy, Johns Hopkins
University, 3400 North Charles Street, Baltimore, MD 21218, USA.
3http://acs.pha.jhu.edu/general/personnel/sci-team/
1 Introduction
The luminosity function (LF) of galaxies is the number density of galaxies as a function of absolute magnitude, and is often parameterized using the Schechter Function [1], where it is described by three numbers: , the magnitude at which the number of bright galaxies rapidly decreases; , the space density at , and the faint end slope which characterizes the ratio of dwarf galaxies to giant galaxies. Models of galaxy formation and evolution must be able to account for these parameters, which vary with galaxy type. Over the past few years, the luminosity function of high redshift () galaxies have been studied extensively through the use of deep, wide-area surveys. Some of the more notable efforts include the Canada-France Redshift Survey (CFRS, [2]), the Calar Alto Deep Imaging Survey (CADIS, [3]), the Deep Groth Strip Survey (DGSS, [4]), and the Classifying Objects by Medium Band Observations (COMBO-17, [5], [6]). Most of these use deep, ground-based images with spectroscopic or photometric redshifts to construct the luminosity function, but do not have the spatial resolution to measure the structural properties of galaxies at higher redshifts.
Without information on the structural properties, ground-based surveys have resorted to using colour information as a proxy for morphologies, whether this information comes in the form of a best-fit spectral energy distribution (e.g. [5], [6]), or a rest-frame colour cut (e.g. [2]). This can result in apparently discrepant results. For example, COMBO-17 originally found that the elliptical/S0 (E/S0) galaxies that produce of the B-band luminosity density only contributed at . By contrast, using morphological classification, the DGSS found that luminosity density of E/S0s has increased by a factor of almost 2 over this range. Either the luminosity of ellipticals has increased over time relative to other types of galaxies or that the differences in colour-selection and morphological-selection have produced apparently inconsistent results between these surveys.
Surveys using the Hubble Space Telescope (HST) such as the DGSS have been able to reliably morphologically classify and measure structural parameters for galaxies with mag, but over much smaller areas of sky than the deep ground based surveys. These HST surveys have discovered a population of blue E/S0 galaxies (e.g. [7], [8]) that have similar luminosities to standard red E/S0 galaxies, making up of the sample [7]. Objects such as these demonstrate the inherent weakness of using colour as a proxy for morphology. Dynamical masses suggest the these blue E/S0 galaxies are less massive than red E/S0 galaxies, [9], but resolution effects make it hard to get reliable masses. Even so, the blue E/S0 galaxies may yet evolve into high mass red E/S0s through a combination of luminosity evolution that reddens the stellar population and dry mergers that increase mass [10].
Luminosity evolution occurs when there is new star-formation, or when the stellar population ages, and does not necessarily imply any change in the mass or number of stars in a galaxy. Colours can also be affected by dust or AGNs. Structural parameters such as the size and shape are better indicators of the morphological evolution, since they are only weakly dependent on the age of the stellar population and are mainly determined by dynamical characteristics such as total mass and angular momentum. The size and shape of the galaxy will not change significantly unless mass is added via mergers or accretion. Small changes in the apparent shape and size do occur when star-formation is localized, but these are much weaker changes than the variation in SED or colour. Thus morphology is a more robust indicator of the nature of a galaxy: but it requires good resolution.
In this article, we examine the effect that colour and morphological selection have on the measurement of the E/S0 luminosity function. We use the improved resolution and sensitivity and field-of-view of the ACS, to determine the morphologies of galaxies to deeper limits and over wider areas than before. We use structural parameters to test whether blue E/S0 galaxies are progenitors of red E/S0 galaxies and what evolution has taken place from to .
2 Data
For details on all the fields, methods and equations, see the published paper [12]. The data were extracted from 5 fields observed by the ACS as part of GTO observations. The fields were selected to give accurate photometric redshifts (3 or more filters), to not have any primary targets in the range and to not contain any strong lensing clusters at lower redshifts. The 5 targets were NGC 4676, UGC 10214, TN J1338 1942, TN J0924 2201 and the Hubble Deep Field North (HDFN). The combined area of these fields is .
Our final sample contains 72 galaxies, 10 of which have spectroscopic redshifts, and the rest have photometric redshifts determined using BPZ [13]. We calculate the rest-frame Johnson B-band from the ACS or bands, where the k-correction is minimal at . Both bands are used depending on the dataset. Converting from these filters to the Johnson B-band removes any differences particular to the passband.
We calculate the half-light radius and total magnitude of each galaxy using GALFIT [14]. In each case we fitted a single Sersic profile. An initial sample was morphologically classified using a semi-automated method, combining an eyeball classification to remove galaxies that are obviously not E/SO and an automatic selection of those with Sersic parameter and . We find that a limit of for and for , , gives us reliable morphologies and photometric redshifts. A redshift range is limited by reliable k-corrections and photometric redshifts.
The sample contains 32 galaxies and the sample contains 40 galaxies. Since our samples are morphologically selected rather than colour or SED selected we will be able to study the colour evolution of the galaxies.
3 Properties of Early Type Galaxies
An unbiased look at the colours of E/S0 galaxies is important, not only for understanding their star formation history, but also for understanding the role that colour selection has in isolating large samples of these objects at high redshift. Such colour (or SED) selections have already been employed in the CFRS, CADIS, and COMBO-17 surveys and are relatively cheap to perform, requiring only ground-based imaging over large areas of the sky. Morphologies and structural properties are, by contrast, much more expensive to acquire, requiring the unique high resolution capabilities of HST.
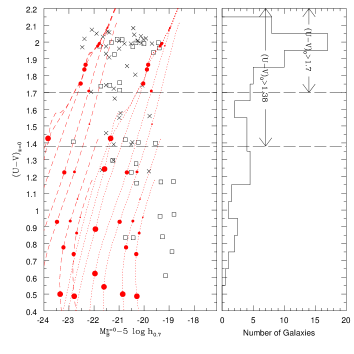
The left-hand plot of Fig. 1 shows the absolute B-band magnitude against the rest-frame (AB) colour. We find a significant range in colours of early-type galaxies, with the majority having . Those with have colours similar to the classic red ellipticals [6]. The red colours are consistent with an old coeval population of stars. While there is a slight colour-magnitude relationship for galaxies, the red sequence is blurred by a combination of the wide redshift range and errors in the photometric redshifts. For the remainder of the paper we define galaxies with as ‘red’ and galaxies with as ‘blue’.
There are a large number of blue early-type galaxies. These have a broad colour distribution, implying a wide range in age or metallicity, with some ongoing star-formation. There is also a wide range in absolute magnitude for , , but only the very faintest galaxies have .
Fig. 1 also shows the expected evolutionary tracks of galaxies with different masses and decay timescales. Galaxies undergoing pure luminosity evolution with an exponentially decaying star-formation rate as described above will move along these tracks from blue to red. The tracks show that these galaxies, regardless of the decay timescale, reach a maximum B-band luminosity at and then they gradually fade as they redden. While most of the E/S0s have and some have , the bluer E/S0s, , have and those with have only . Note that these results should be treated with caution given their obvious dependence on our simple exponentially decaying model. The very brightest of the blue E/S0s will end up amongst the red sequence that has already formed, but most will end up extending the sequence to fainter absolute magnitudes, given pure luminosity evolution. Dry merging amongst elliptical galaxies may also help produce more luminous red ellipticals in the local universe [10].
Early-type galaxies have gone through a period of high star-formation, and the youngest of these galaxies are being systematically missed by ground-based surveys that select by colour or SED, rather than morphology [12].
When we look at the structural properties of galaxies it is important to understand the selection effects [12]. To compare galaxies within each redshift range, we use a sample that is volume-limited from , with mag and kpc.
To study the structural parameters, we look at the distributions of the half-light radius and the Sersic parameter . To compare each distribution we calculate the biweight and biweight-scale. In both cases there is no change between the two redshift ranges for the biweight size kpc, and the biweight Sersic parameter and there is no significant difference in the biweight sizes of red or blue early-types in either redshift range. However, blue galaxies have a steeper Sersic profile than red galaxies ( vs ). The larger values of are consistent with bluer galaxies having a starburst in the cores: the central regions will be slightly brighter, making the galaxies appear more concentrated [7]. However, at fainter luminosities , the distributions become significantly different, particularly in the Sersic parameter. Red E/S0s at lower luminosities are slightly smaller, with and . Blue E/S0s at lower luminosities have and .
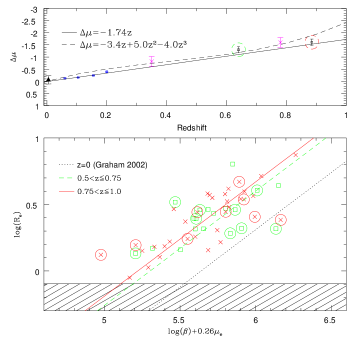
We find that our data has a good fit to the photometric plane [11]. The photometric plane for our data is plotted in the right hand side of Fig. 1 and compared to the result [11] result.
There is significant change in the offset of the photometric plane with redshift. There is also a small change in offset between the red and blue galaxies, which is due to the variation in the Sersic parameter with colour. Since we have already shown that both and have no significant evolution, the evolution in the photometric plane must be due to evolution in . In the top panel of the figure, we calculate the change in compared to [11]. We also plot results from other surveys, the Sloan Digital Sky Survey [17] and the DGSS [16], at and . The variation is linear with redshift, . Our results are similar the fundamental plane results for E/S0 galaxies in the DGSS, [8].
4 The Luminosity Function of E/S0 Galaxies
We calculate luminosity functions for 3 different samples in both of the redshift ranges [12]. The first sample is our full sample, which is a morphological selection. Our second sample is a ’red’ sample, with (in addition to the morphological selection) and our final sample is a ’very red’ sample, with . We fit Schechter functions to the LFs and use the faint-end slope value () to constraint the LFs.
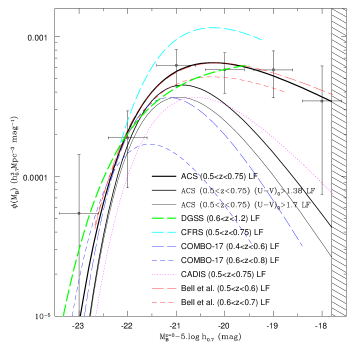
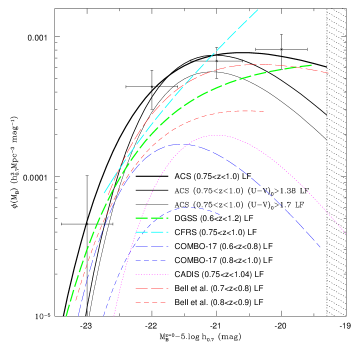
In Fig. 2 we compare the LFs with each other and with other rest-frame B luminosity functions for early-type galaxies. They are split into two redshift ranges, (left) and (right). In each case, we have converted from the given cosmology to , , km s-1Mpc-1 and the magnitudes to AB magnitudes. The points with error-bars are those for our morphologically selected luminosity function. The black lines show our LFs, with the thick line showing the morphologically selected sample, the medium-thick line showing the sample and the thin line showing the sample. The main difference is between the morphologically-selected sample and the colour-selected sample, with little difference between the sample and the sample. This difference occurs at the faint end, where most of the very blue galaxies are. The blue lines with long dashes and short dashes show the original COMBO-17 LFs [5] at and , respectively ( and respectively in the right hand plot), while the equivalent red lines show the COMBO-17 LFs with new colour-selections [6]. The magenta-line shows the CADIS LF [3]. The cyan line represents the CFRS [2] LF, and the green line shows the DGSS [4] LF. The original COMBO-17 and CADIS LFs select objects classified as E-Sa from SED templates and should be best matched to the sample. The CFRS should be best matched to the sample and the DGSS is morphologically selected and so can be compared to the full sample. Overall we find that our LFs evolve with a mag decrease in luminosity and () decrease in number density from to . The faint-end slope becomes shallower as the colour-selection becomes stricter, increasing from to to .
The present study has similar luminosity functions to the DGSS, see Fig. 2, especially in the lower redshift sample. The DGSS was not able to constrain the faint end slope, so they used a value , based on the morphologically selected low redshift luminosity functions [4]. Our sample goes almost 2 magnitudes deeper than the DGSS and hence we are able to constrain the faint end slope: is shallower than the DGSS LF, but is much steeper than the colour-selected luminosity functions.
When we compare the samples selected with , we find that the CFRS is not a good match to the ACS LF: the space density is about twice as high in the CFRS as our measurement. In the higher redshift range, the CFRS luminosity function is a closer match for mag, but again overestimates the number of galaxies for lower luminosities. This suggests that there is some contamination by late-type galaxies such as Sa/Sbc spirals, which are removed by our morphological selection, as well as incompleteness to bluer early-type galaxies.
The CADIS LF [3] and original COMBO-17 LF [5] both closely resemble the ACS , LF, with offsets of magnitudes either way, which is within the errors. However the original COMBO-17 LF has a much lower space density, which is also much lower than the ACS , LF. At higher redshift there are increasing disparities (by factors of 10) between the original COMBO-17 and the ACS LFs. The new COMBO-17 LFs [6], which use a colour-selection based upon the evolution of the red-sequence, give results that are very close to our morphologically selected sample for their and LFs, but still underestimate the space density at .
Simple colour cuts, will inevitably lead to contamination from spirals or miss many red ellipticals if passive evolution is not taken into account. However, even when evolution is accounted for, the blue ellipticals will be missed in a colour-selected sample. Bell [6] has determined that they miss of the elliptical population in their sample but also have about contamination in their sample. The proportions change at higher redshift making the LFs more disparate.
These results show that there is a wide variation in the luminosity functions reported and that selection effects have a systematic effect on the results. In particular, for colour-selected samples, we noted a significant underestimate of the faint end slope compared with morphologically selected samples. The space density of galaxies also varied greatly from survey to survey.
5 Conclusions
From the analysis of the colours and structural properties of E/S0 galaxies at , it is apparent that bright (), ‘blue’ E/S0 galaxies are not significantly different from bright ‘red’ E/S0 galaxies in terms of their structural parameters, and there is no significant evolution in the structural parameters. However, there is evolution in the luminosity ( mag) of these galaxies as demonstrated by the photometric plane and LFs. At , the blue E/S0s will be only slightly less luminous than the ‘red’ galaxies, and there will be significant overlap, see Fig. 1. Fainter () ‘blue’ E/S0 galaxies are smaller with lower Sersic parameters than their ‘red’ counterparts. These galaxies often have extremely blue colours and are likely to be much less massive. The evolution tracks Fig. 1 suggests that these will fade by mag as their stellar populations age. This is consistent with these galaxies becoming present day dwarf ellipticals.
Using deep high resolution optical data we are able to measure the morphological E/S0 luminosity function almost 2 magnitudes deeper than the DGSS and constrain the faint end slope of the LF. We find a fairly flat faint end slope , slightly shallower than low redshift luminosity functions for morphologically selected E/S0s but much steeper than colour-selected samples.
Using purely photometric information (colour, SED) to select the galaxy sample misses the bluer early types, and may lead to contamination from Sa/Sbc spiral galaxies or other red galaxies. As shown in Fig 2 this leads to a large variation in the measurement of the luminosity function which can lead to significantly different conclusions on the evolution of galaxies.
Acknowledgements. ACS was developed under NASA contract NAS5-32865 and this research has been supported by NASA grant NAG5-7697. The STScI is operated by AURA Inc., under NASA contract NAS5-26555. We are grateful to Ken Anderson, Jon McCann, Sharon Busching, Alex Framarini, Sharon Barkhouser, and Terry Allen for their invaluable contributions to the ACS project at JHU.
References
- [1] Schechter P. 1976, ApJ, 203, 297
- [2] Lilly S.J., Tresse L., Hammer F., Crampton D., Le Fevre O. 1995, ApJ, 455, 108
- [3] Fried J.W. et al. 2001, A&A, 367, 788
- [4] Im M. et al. 2002, ApJ, 571, 136
- [5] Wolf C., Meisenheimer K., Rix H.-W., Borch A., Dye S., Kleinheinrich M. 2003, A&A, 401, 73
- [6] Bell E.F. et al. (GEMS Team) 2004, ApJL, 600, 11
- [7] Menanteau F., Ellis R.S., Abraham R.G., Barger A.J., Cowie L.L. 1999, MNRAS, 309, 208
- [8] Gebhardt K. et al. 2003, ApJ, 597, 239
- [9] Im M. et al. 2001, AJ, 122, 750
- [10] Faber, S.M. et al. 2005, ApJ, submitted
- [11] Graham A.W., 2002, MNRAS, 334, 859
- [12] Cross N.J.G., et al. 2004, AJ, 128, 1990
- [13] Benítez N. 2000, ApJ, 536, 571
- [14] Peng C. Y., Ho L. C., Impey C. D., Rix H.-W., 2002, AJ, 124, 266
- [15] Bruzual G., Charlot S., 2003, MNRAS, 344, 1000
- [16] Schade D. et al. 1999, ApJ, 525, 31
- [17] Bernardi M. et al. 2003, AJ, 125, 1849