Spectral lags caused by the curvature effect of fireballs
Abstract
Recently, Shen et al. (2005) studied the contributions of curvature effect of fireballs to the spectral lag and showed that the observed lags could be accounted for by the effect. Here we check their results by performing a more precise calculation with both the formulas presented in Shen et al. (2005) and Qin et al. (2004). Several other aspects which were not considered in Shen et al. (2005) are investigated. We find that in the case of ultra-relativistic motions, both formulas are identical as long as the whole fireball surface is concerned. In our analysis, the previous conclusion that the detected spectral lags could be accounted for by the curvature effect is confirmed, while the conclusion that the lag has no dependence on the radius of fireballs is not true. We find that introducing extreme physical parameters is not the only outlet to explain those observed large lags. Even for the larger lags () (see Norris et al. 2005), a wider local pulse () could account for it. Some conclusions not presented in Shen et al. (2005) or those modified in our analysis are listed below: a) lag with 2; b) lag is proportional to the local pulse width and the of the observed light curves; c) a large lag requires a large and a small as well as a large ; d) when the rest frame spectrum varies with time, the lag would become larger; e) lag decreases with the increasing of ; f) lag E within the certain energy range for a given Lorentz factor; g) lag is proportional to the opening angle of uniform jets when .
keywords:
relativity – gamma-rays: bursts –gamma-rays: theory.1 Introduction
It is common that there is a spectral lag between different energy channels in gamma-ray bursts (see, e.g. Cheng et al. 1995; Norris et al. 1996, 2000; Wu & Fenimore 2000; Chen et al. 2005). Although There are several attempts to explain the origin of the spectral lag (See, e.g., Salmonson 2000; Ioka & Nakamura 2001; Schaefer 2004; Kocevski et al. 2003a), the problem remain unresolved.
Recently, Shen et al. (2005) (hereafter Paper I) tentatively studied the contribution of curvature effect of fireball to the lag, and the resulting lags are very closed to the observed one. In fact, in their paper introducing extreme physical parameters such as or is not the only outlet to explain those observed large lags. A reasonable intrinsic pulse width , i.e., hundreds to thousands of seconds, which could produce the lag of s based on their model, could also account for it.
Qin (2002) had derived in a much detail the flux intensity based on the model of highly symmetric expanding fireballs, where the Doppler effect of the expanding fireball surface is the key factor to be concerned, and no terms are omitted in his derivation, therefore the formula is applicable to the cases of relativistic, sub-relativistic, and non-relativistic motions and to those of spherical fireballs or uniform jets. With this formula, Qin (2003, 2004) derived the observed photon count rate of a fireball (See Eq. (1) in the paper).
A detailed comparison between Shen et al. (2005) and Qin et al. (2004) model (hereafter Paper II) gives rise to the conclusion that the two models are identical when the following conditions are satisfied. Firstly, as shown in equation (8) of Paper II, the two quantities, local time and observed time t, are related by , where is the initial local time, is the radius of the fireball measured at , and D is the distance of the fireball to the observer. When taking and , one would find that the above relation will become the one determined by equation (3) in Paper I (where T is referred to as observed time defined in Paper I). Secondly, in equation (3) of Paper II, the integral lower and upper limit are determined by and , respectively, where and are confined by the concerned area of the fireball surface, and and are confined by the local time range of emission. For such a local pulse, and , when taking and (i.e., the photons reaching the observer come from the whole surface of the fireball), one would obtain and (where ), which are consistent with the integral lower and upper limit in equation (4) of Paper I, respectively. In a word, the mainly difference between the two models is that, Shen et al. neglected the constraint of the local pulse and the concerned area of fireball surface on the integral lower and upper limit of the observed flux (see equation (4) in their paper), which plays a important role in producing the observed light curves. Strictly, when dealing with uniform jets with a small opening angle such as , the formula presented in Shen et al. (2005) would fail to be applied.
We in this paper check their results by performing a more precise calculation with the two models, at the same time, several other aspects which were not considered in Shen et al. (2005) are investigated, such as lag’s dependence on energy and opening angle (in Section 2). The previous conclusion that the observed spectral lags could be accounted for by the curvature effect is confirmed and some new results are obtained. For example, lag decreases with the increase of radius of fireball other than weakly dependent on it. Lag , in the case of fixing the local pulse width, which is identical with that, lag in the case of fixing the intrinsic pulse width, obtained by Shen et al. (2005). Accordingly an interesting question arises: would the two approaches always lead to identical results? which will be discussed in Section 3. And then we give our discussions and conclusions in the last section.
2 Theoretical analysis on spectral lags
Under the assumption that a fireball expands isotropically with a constant Lorentz factor and the radiation is independent of direction, the expected count rate of the fireball measured within frequency interval can be calculated with equation (21) in paper II, which can be rewritten as follows
| (1) |
Note that the formula is in terms of the integral of , which is a dimensionless relative local time defined by , where is the emission time in the observer frame, called local time, of photons emitted from the concerned differential surface of the fireball ( is the angle to the line of sight), is the initial local time which could be assigned to any values of , and is the radius of the fireball measured at . Variable is a dimensionless relative observation time defined by , where is the distance of the fireball to the observer, and is the observation time measured by the distant observer. In formula (1), represents the development of the intensity magnitude of radiation in the observer frame, called as a local pulse function, and describes the rest frame radiation mechanisms.
Light curves determined by equation (1) are dependent on the integral limits and , which are determined by the concerned area of the fireball surface, together with the emission ranges of the radiated frequency and the local time. But for commonly adopted mechanisms, such as the bremsstrahlung, Comptonized and synchrotron radiations, they cover the entire frequency band, and do not provide constraints on the integral limits (see equations (14) and (15) in Qin 2002). Thus the integral limits are only determined by and where and are the lower and upper limit of confining , and and are confined by the concerned area of the fireball surface. The radiations are observable within the range of (see Paper II).
Because peak times of different light curves associated with different frequency intervals or different energy bands are different, following Shen et al. (2005), we define the spectral lag as the time between the peaks of the light curves in two different channels, a lower energy channel and a higher energy channel . In the following, we will investigate on what parameters the lags are dependent in terms of the fireball model.
For the sake of simplicity, we employ in the following a local Gaussian pulse and employ the Band function as a rest frame radiation spectrum which was frequently and rather successfully employed to fit the spectra of GRBs (see, e.g., Schaefer et al. 1994; Ford et al. 1995; Preece et al. 1998, 2000) to study the issue. A local Gaussian pulse and the Band function are written as
| (2) |
and
| (3) |
respectively, where , and are constants, and are the low and high energy indices in the rest frame, respectively, and is the rest frame peak frequency. Typical values of the low and high energy indices coming from statistical analysis are and , respectively (see Preece et al. 1998, 2000).
Due to the constraint to the lower limit of , which is (see Paper II), we assign so that the interval between and would be large enough to make the rising phase of the local pulse close to that of the Gaussian pulse. From (2) one can obtain , which leads to , where is the FWHM of the Gaussian pulse. From the relation between and , one gets . In the following, we assign , cm, , , and
2.1 Lag’s dependence on the Lorentz factor and the local pulse width
As shown in Qin et al. (2004), the Lorentz factor and the local pulse width are important in producing the light curve observed. We wonder if the Lorentz factor and the local pulse width play important roses in producing a lag. The spectral lag of GRBs could be found either in hight BATSE energy channels or in lower Ginga ones (see, e.g., Cheng et al. 1995; Chen et al. 2005; Norris et al. 1996, 2000; Wu & Fenimore 2000). We consider the following three different energy channel pairs: BATSE channels 1 and 3, BATSE channels 1 and 4, and Ginga channels between 2-10 keV and 50-100 keV (marked as , and , respectively).
As suggested by observation, the value of the peak energy of the GRB’s spectrum is mainly distributed within keV (See Preece et al. 2000) and peaks at about 250 keV. Here we assume 250 keV and 50 keV as the typical values of the peak energy of hard and soft bursts, respectively. In addition, we assume that typical hard and soft bursts come from the same Lorentz factor of the expanding motion of the fireball surface and differ only in their rest fame peak energy . As derived in Qin (2002), when taking into account the Doppler effect of fireballs, the observed peak energy would be related with the peak energy of the typical rest frame Band function spectrum (, ) by . In a recent work, the Lorentz factors of a GRB sample were found to be distributed mainly within (100, 400) and to peak at about 200 (Qin et al. 2005a). So, when assigning to be the Lorentz factor of these sources, one would find the typical values of the rest frame peak energy of hard and soft bursts are 0.75 keV and 0.15 keV respectively.
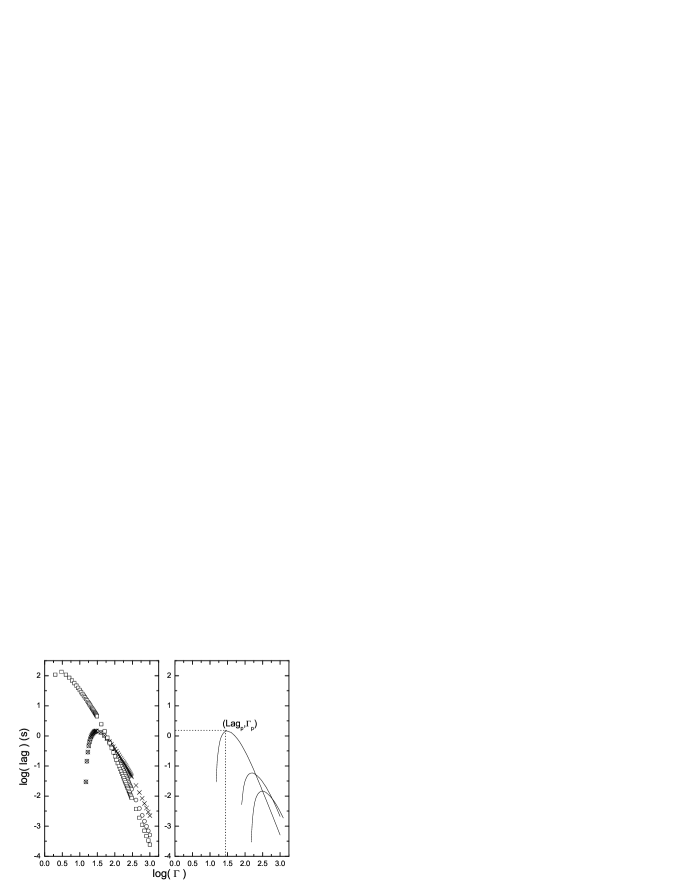
Presented in Figs. 1 and 2 are the relationships between the lag and the Lorentz factor as well as between the lag and the local pulse width, .
We find from the left panel in Fig. 1 that each of the three kinds of lag has a peak value. The Lorentz factor corresponding to this peak value is denoted by (where subscript “p” stands for “peak”). The lags increase with when ; the contrary is observed when . For , the lags decrease with the Lorentz factor in the law of with 2 for the three kinds of lag. The figure exhibits within the range of (note that current GRB models suggest that the gamma-ray photons come from a relativistically expanding fireball surface with Lorentz factor , see Piran 2005). The result and that obtained by Shen et al. (2005) are identical (note that here we fix the local pulse width instead of the co-moving pulse width). One can check that, when the local pulse width is large enough, for a fixed rest frame peak energy the observed peak energy would increase with following the law of for the adopted Band function spectrum (as shown in Qin 2002). According to the law of , the lag will have a peak value when shifting from a higher energy channel to a lower one, which could be observed in Fig. 1. Fig. 1 shows that the relationship between the lag and would differ according to different rest frame peak energy , which suggests that, in producing a lag, not only the Lorentz factor is important but also the rest frame peak energy plays a role.
Fig. 2 shows that the lag increases with the local pulse width following the law of , and it obeys the law of , the same as that shown in Fig. 1. However, as suggested by Fig. 2, the dependence of the lag on the local pulse width is much obvious than that on the Lorentz factor and the rest frame peak energy (see Fig. 1). In a recent work, Lu et al. (2005a) found that based on the same model (Qin 2002, Qin et al. 2004) , where is the full width at half-maximum of the GRB’s light curve. Thus one could come to , which is in agreement with the observation that wider pulses were found to produce longer lags (see Norris et al. 1996, 2001, 2005).
2.2 Lag’s dependence on spectral parameters of the Band function
We know that different values of the spectral parameters (i.e., , and ) of the Band function are associated with different mechanisms (see Band et al. 1993). Let us study the impact of the mechanisms on the spectral lag in the following.
We first investigate the lag’s dependence on the observed peak energy of the spectrum. Ignoring the minute difference caused by various factors, we assume that the following relationship holds in any situations concerned in this paper: (one can check that, for photons emitted from an ejecta moving towards the observer, ). This relationship tells us that the observed peak energy is proportional to or when the other is fixed. The lag’s dependence on the observed peak energy in the case of varying with when fixing is similar to those discussed in . For the sake of comparison, we convert the right panel of Fig. 1 to the last panel of Fig. 3 by applying the relationship. In addition, we explore the lag’s dependence on the observed peak energy in the case of varying with when fixing .
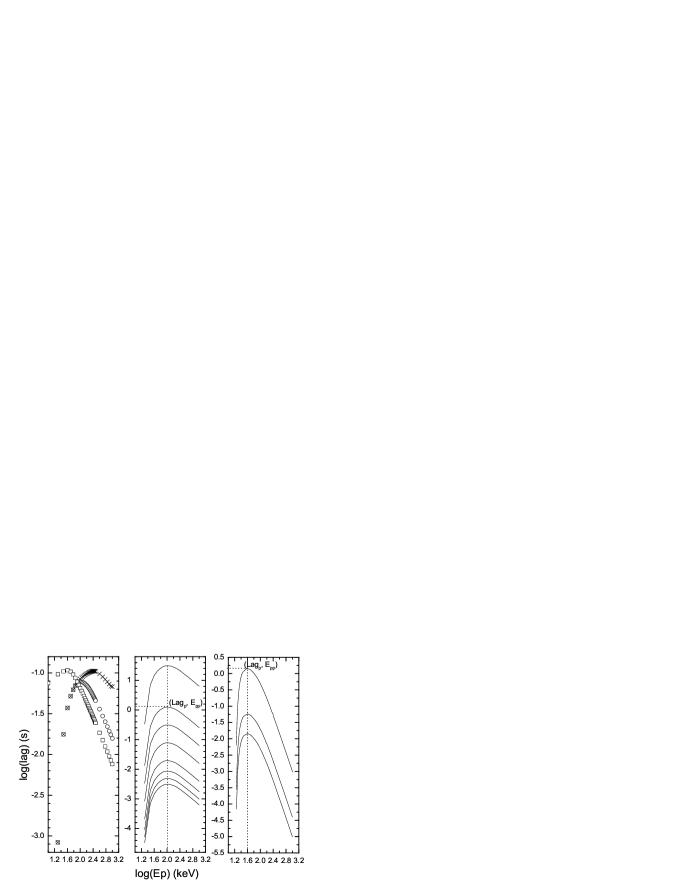
One would find from the left panel of Fig. 3 that, similar to Fig. 1, when varies with for a fixed , each of the three kinds of lag has a peak lag () as well.
To make clear what causes the relationships shown in Fig. 3, we divide the light curves of equation (1) into two parts, with one being contributed from the low-energy portion of the rest frame Band function spectrum and the other from the high-energy portion, and explore how the peak times, , of the light curves are affected by the observed peak energy when it shifting through the channel (see Figs. 4 and 5).


Let us denote the channel concerned by (for the first channel of BATSE, it is , while for the third channel, it is ). From Figs. 4 and 5 some conclusions could be reached. For a certain value of the Lorentz factor (here we take ), when , the contributions to the light curves mainly come from the rest frame high-energy portion. According to the Doppler effect, this amount of energy would mainly come from the area of the fireball surface around the line of sight, i.e., (where is the angle to the line of sight). In other words, energy arising from the rest frame high-energy portion (photons with when emitted) emitted from the area with would shift into the channel concerned, and thus the peak time of the corresponding light curves would keep almost unchanged (see Fig. 5). When increases, the contributions to the light curves from the low-energy portion become larger since the corresponding photons begin to shift into the channel concerned. At the same time, some high energy photons emitted from the area corresponding to a larger fall into the channel as well, and due to the well-known time delay their contributions to the observed light curves cause a larger (see Fig. 5). It is the difference of of two different channels that leads to a lag (see Fig. 1). When is fixed, the situation is quite different. In this case, the enhancement of comes from the increasing of . A large corresponds to a large which makes the light curve narrower (i.e., , see Qin et al. 2004; Lu et al. 2005a ). As a result, sharply decreases with (see the upper panels of Fig. 4 and the right panel of Fig. 5). Note that, since the influence of the Lorentz factor is very significant (as ), the difference of of two different channels is hardly detectable in the right panel of Fig. 5.
Figs. 6 and 7 show that the lag increases with the low energy spectral index of the rest frame Band spectrum and it decreases with the high energy spectral index of the spectrum. The relationships also follow in both cases. Compared with that associated with the low energy spectral index, the variation of the lag with respect to the increase of is relatively mild, where and are almost unchanged (see Fig. 7).
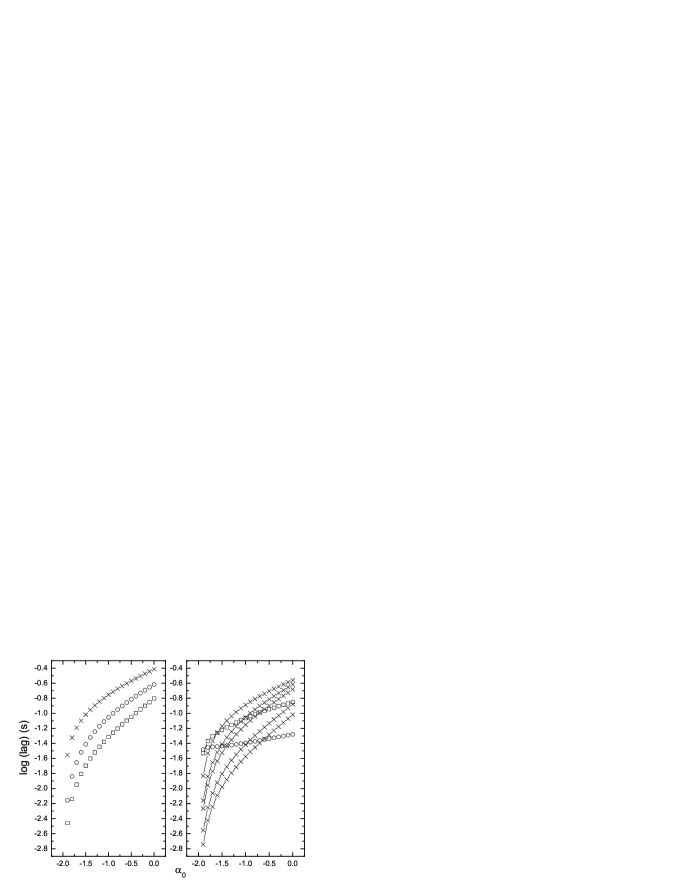
To investigate what causes the relationships shown in Figs. 6 and 7, once more we divide the light curves of equation (1) into two parts, as done in Fig. 4, here different and are adopted (see Figs. 8 and 9).


Fig. 8 shows that, for BATSE channel 3 and in the case of , when is fixed, the contribution from the rest frame low-energy portion to the light curve decreases slightly with the increasing of , whereas the contribution from the rest frame high-energy portion slightly increases with the increasing of . The peak time of the first channel light curve of BATSE rises more rapidly than that of the third channel (see Fig. 8). Note that, to shift into the channel observed, photons of the rest frame high-energy portion must be those emitted from the area of larger , and it must be this that leads to the increasing of with the increase of . The difference of of the two channel light curves causes the lag (see Fig. 6).
From Fig. 9 we find a slightly different situation. For BATSE channel 3 and in the case of , when is fixed, the contribution from the rest frame high-energy portion to the light curve is significant only when is close to . The peak time of the first channel light curve is almost unchanged with the increase of . Only when is low enough, the contribution from the rest frame high-energy portion to the light curve could become significant. In this situation, the peak time of the third channel would rise with the increase of (see Fig. 9). This is because that when is low photons of the rest frame high-energy portion emitted from the area of larger would shift into the channel observed, and then the index would play a role.
2.3 Spectral lag in the case of a rest frame spectrum varying with time
It is common that the spectrum parameters of many GRBs are observed to vary with time (see Preece et al. 2000). We are curious how the lag’s dependence on and would be if the rest frame spectrum develops with time. As most of GRBs show “hard-to-soft” evolutionary feature (see e.g., Ford et al. 1995; Fishman et al. 1995; Band, David L. 1997; Preece et al. 1998;), here we consider a simple case where the rest frame spectrum is a Band function with its indices and the peak energy decreasing with time. Like Qin et al. (2005b), we assume a simple evolution of indices and and peak energy which follow , and for . For , , and , while for , , and . We take k=0.1, 0.5 respectively (they correspond to different rates of decreasing) to investigate the lag’s dependence.
Let us employ local Gaussian pulse (2) to study this issue. We adopt and and and .


Figs. 10 and 11 show the dependence of lag on the Lorentz factor and the local pulse width in the case when parameters of the rest frame spectrum vary with time. We find that, when the spectral parameters decrease with time, the lags are larger than that associated with the case when the spectral parameters are fixed. The larger the decreasing speed (say, k=0.5), the more obvious the effect.

Kocevski et al. (2003a) argued that the observed lag is the direct result of spectral evolution and found the observed lag increases with the peak energy’s decay rate. Motivating by this, we take , , and allow varying with time. Illustrated in Fig. 12 is the relationship between the and the rest frame peak energy decaying rate, , which is in agreement with the observed result found by Kocevski et al. (2003a). The dependence of lag on the varying speed in the case of the rest frame spectrum parameters and varying wit time is also shown in Fig. 12. We find it common that the lag increases with the increasing of . The increasing of lag in the case when the rest frame peak energy decreasing with time is much more obvious than that in the case when indexes and decreasing with time.
2.4 Lag’s dependence on energy
In a previous study, Wu & Fenimore (2000) detected no larger lags in lower energy bands. However, we find from the above analysis that the following relation holds in almost all the cases concerned: . Motivated by this, we investigate in the following in much detailed the time lag’s dependence on energy. We adopt a typical Band function spectrum with , and as the rest frame radiation form to study this issue.
There are three instruments in the Swift telescope payload, and two of them could detect high energy photons with the XRT ranging from 0.2 keV to 10 keV and the BAT ranging from 15 keV to 150 keV (http:). We consider a wide band ranging from 0.2 keV to 8000 keV which covers both the Swift and BATSE bands. This band is divided into the following uniformly ranging channels (where ): [, ]=[0.2, 0.4] keV, [0.5, 1] keV, [1, 2] keV, [2, 4] keV, [5, 10] keV, [10, 20] keV, [20, 40] keV, [50, 100] keV, [100, 200] keV, [200, 400] keV, [500, 1000] keV, [1000, 2000] keV, [2000, 4000] keV and [4000, 8000] keV.

We measure the lags between the first channel and any of the other channels. The relationship between the lag and the corresponding energy (here denotes the lower energy limit of the corresponding high-energy channel) is presented in Fig. 13. It shows that, for any given value of , the lags increase with energy following the law of and then saturate at a certain energy (we call , where subscript “s” represents the word “saturate”). This might explain why Wu & Fenimore (2000) found that GRBs do not show larger lag at lower energy. We notice that takes place behind the corresponding peak energy (where the relation is adopted). For different , increases with following the law of (see the right panel of Fig. 13), and the relation holds for all .
As shown in , when , the contributions to the corresponding light curve largely come from the high-energy portion of the rest frame spectrum, which makes the peak time of the light curve less change, and thus the lag would saturate. The contrary is true. When , the contributions come only from the low-energy portion of the rest frame spectrum, emitted from the whole fireball surface, i.e., . Thus, there would be almost no lag between the light curves of such two energy channels (see the two filled circles in the bottom of the left panel of Fig 13).
2.5 Lag’s dependence on the opening angle of uniform jets
According to the relativistic fireball model, emissions from a spherically expanding shell and a jet would be rather similar to each other as long as we are along the jet’s axis and the Lorentz factor of the relativistic motion satisfies , because the matter does not have enough time (in its own rest frame) to expand sideways at such a situation (Piran 1995, 1999). Let us study the dependence of lag on the radiated area confined by the opening angle of , where is a parameter describing the width of the opening angle of uniform jets. Shown in Fig. 14 is the relationship between and .

We find from Fig. 14 that increases with the opening angle within following the law of , and beyond this range, it slightly increases with the angle, and finally saturates at for any . The saturate lag (denoted by ) decreases with the increasing of following the law of (see the right panel of Fig. 14). This is an outcome of the beaming effect. It suggests that there is a limited value of the lag when different opening angles of uniform jets are concerned, which is the same as that in the case of spherical fireballs.
2.6 Lag’s dependence on the radius of fireball
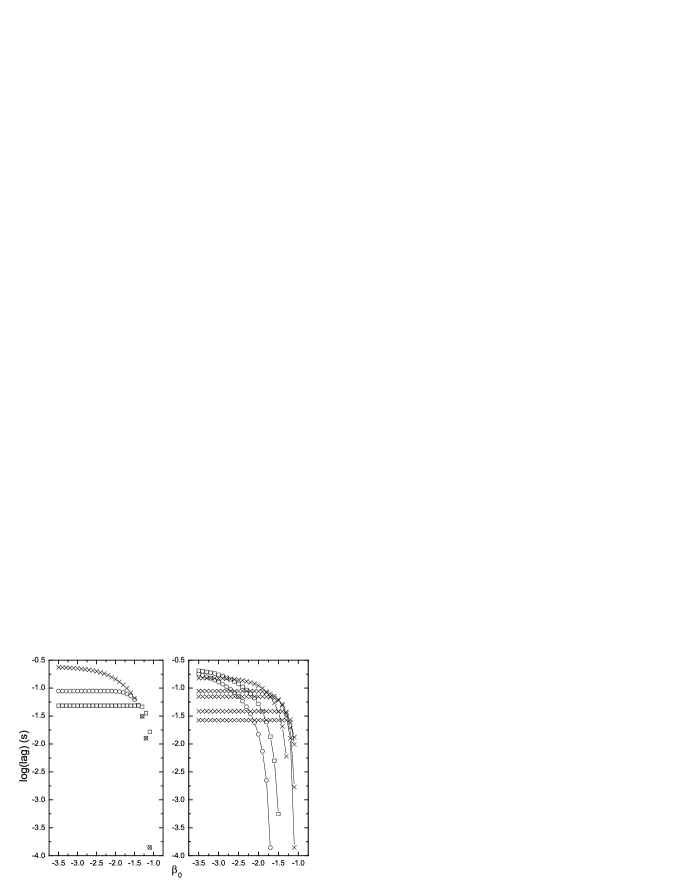
Shen et al. (2005) found that the lag is independent of the radius of fireballs based on their model (see Fig. 8 in their paper). We perform the analysis with their formula when raising a higher precision of calculation (the result is the same when we adopt equation [1]). Here we fix the local pulse width by adopting . The result is presented in Fig. 15.

Fig. 15 shows that decreases with the radius of fireballs following the law of , when the local pulse width is fixed. The lag depends on the radius of fireballs. Comparing our result with that obtained in Shen et al. (2005) we find that the conclusions are entirely different. We suspect that three factors might be responsible to this difference. The first is the precision of calculation. The second is the range concerned. Our calculation spans about three magnitudes of the fireball radius while Shen et al. (2005) considered only two magnitudes. The third is that the dependence of on the radius is weak: the lag would be only about two times smaller when the radius becomes three magnitudes larger. We believe that the third is the key factor accounting for the difference.
The conclusion of Shen et al. (2005) that the lag is independent of the radius of fireballs is a puzzle since a large radius seems to cause a larger distance between the area with and that with on the fireball surface and this should lead to a larger lag. Our conclusion that the lag decrease slightly with the increasing of the radius makes the puzzle worse. The mechanism accounting for this is currently unclear. We suspect that this dependence might rely on what kind of photons dominate the peaks of the lower and higher energy channels respectively and where they are emitted from. In creating the dependence, other parameters such as the rest frame peak energy and the Lorentz factor might be at work. Therefore, this might not be answerable if only a simple mechanism is concerned (to find a answer to this, a detailed investigation should be made, which is beyond the scope of this paper).
3 Different characteristics shown in the two cases of fixing the intrinsic pulse width and the local pulse width
Shen et al. (2005) explored the lag’s dependence on the Lorentz factor and found when fixing the intrinsic pulse width (the co-moving pulse width) and the fireball radius. However, in this paper we find instead, when fixing the local pulse width and the fireball radius based on both models of Shen et al. (2005) and Qin et al. (2004). According to the theory of special relativity, the two results are identical, as the local timescale is times of the corresponding intrinsic timescale. Some interesting questions arise accordingly. When the fireball radius is fixed (as considered in Shen et al. 2005 and in this paper), would the two approaches always lead to identical results? Could they reveal the same property of the curvature effect? In which case should which one be preferred?
As pointed out and illustrated in Qin et al. (2004), the profiles of light curves are not affected by the Lorentz factor when fixing the relative local pulse width (, or as used in Qin et al. 2004). When the fireball radius is fixed, a fixed relative local pulse width would correspond to a fixed local pulse width (that is, a certain leads to a certain in this situation, where is fixed). Thus, in this situation, fixing the local pulse width would not lead to different profiles of light curves when different Lorentz factors are considered. However, the feature of the profile will change when fixing only the intrinsic pulse width. This is because that for a ceratin intrinsic pulse width, the corresponding local pulse width would take different values when different Lorentz factors are considered (recall that the local timescale is times of the corresponding intrinsic timescale), and this would lead to different relative local pulse width since is fixed. The corresponding profiles of light curves would change since they are sensitive to the relative local pulse width (see Qin et al. 2004).
Fig. 16 illustrates the different influences of the Lorentz factor on the profiles of the light curves calculated with equation (5) in Shen et al. (2005) in the two cases of fixing the local pulse width and the intrinsic pulse width.

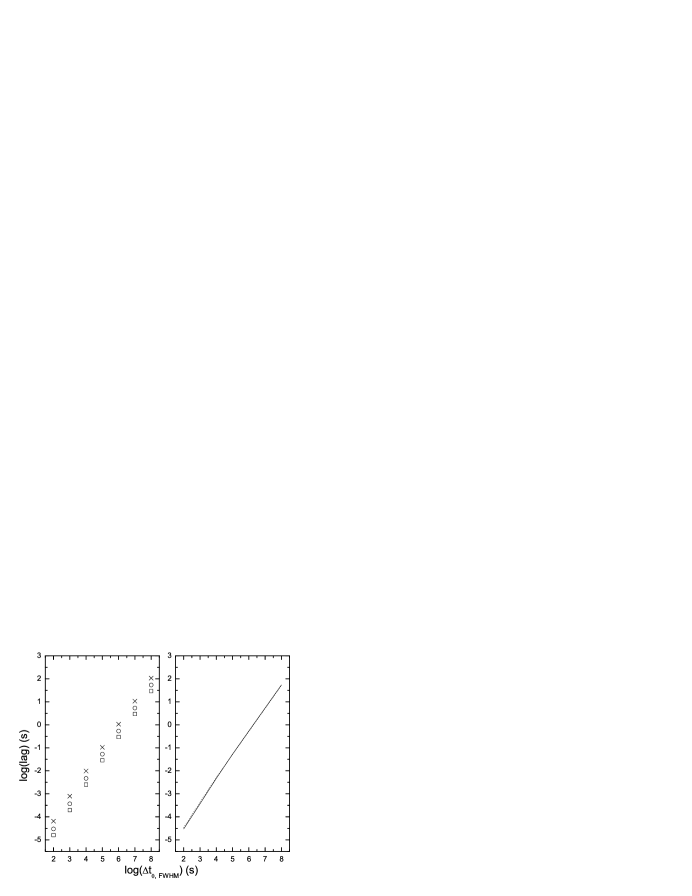
Kocevski et al. (2003b) and Ryde et al. (2003) found that there is a linear relationship between the rise width, and the full width, FWHM, of gamma-ray pulses. Lu et al. (2005a) explained the relationship based on the formula presented in Qin et al. (2004), and found that there exists a dead line in the plane when taking the relative local pulse width . Here we repeat the same work as illustrated in Fig. 2 of Lu et al. (2005a) based on the Shen et al. (2005) formula. As shown in Fig. 17, we find that there indeed exists the dead line predicted before in the plane when fixing the local pulse width (here we take and which corresponds to ). However, when fixing the intrinsic pulse width, one cannot find a dead line in the plane (see Fig. 17). This indicates that the features in the plane are different in the case of fixing the local pulse width and in that fixing the intrinsic pulse width. One could obtain the local pulse width td by measuring the location of the corresponding data (to observe in what lines they belong to) from the left panel of Fig. 17 as long as . But one could not measure the intrinsic pulse width from the right panel of the figure. This indicates that the former is superior to the latter when one attempts to make use of the plane.

4 Discussion and conclusions
Discussed in Shen et al. (2005) and the above analysis, only intrinsic or local Gaussian pulses are involved. One might ask if the conclusions hold only in the selected pulse form. Thus, we replace the local Gaussian pulse with other forms of local pulses when applying equation (1) and the corresponding formula of Shen et al. (2005). Local pulses (55), (81), (82), (83), (85), (86) and (87) presented in Qin et al. (2004) are studied. We find that the lags resulting from a local pulse without a decaying phase are too small to be noticed. For example, when and . This is in well agreement with what discovered by Shen et al. (2005). Now it is clear that, in the mechanism of the curvature effect, it is the decaying phase of a local pulse that contributes to the observed lags.
A recent study revealed that (see Lu et al. 2005b), the rise phase of light curves will always be dominated by the emission from and within the rise phase of the local pulse. It is illustrated in Fig. 18, where a local pulse without a decaying phase is considered. This indicates that there would be no peak lags for the light curves of different energy channels associated with those local pulses without a decaying phase.

Except the Band function spectrum, the Comptonized spectrum and the broken power law spectrum were employed to fit the spectral data in Preece et al. (2000). To make sure if the dependence of lags discussed above would be altered when other rest frame spectra are considered, we employ the Comptonized spectral model as the rest frame radiation form to investigate the lag’s dependence concerned above. The Comptonized spectrum is written as , where and are constants. Here, typical values, (Schaefer et al. 1994) and (see Qin 2002 Table 2) are adopted. Our calculation shows that the characteristics of the lag’s dependence are the same as what revealed above, when the rest frame Band function spectrum is replaced with the two other forms. The only difference is the magnitude of the lags. For example, when the rest frame Comptonized spectral model is adopted, we obtain a slightly larger value of (about larger) when we redraw Fig. 2.
Of the sample of 41 source presented in Friedman et al. (2005), we find that the range of is {0.03107, 0.57072 } rad, and its average value is 0.15925 rad. It shows that if . As discussed in §2.5, one could find that for GRBs coming from a uniform jet with such opening angles, if is adopted, the difference of lags from that arising from a spherical surface would not be distinguishable.
Several authors showed that the CCF lags between BATSE channels 1 and 3 tend to concentrate near (see Norris et al. 1996, 2000; Chen et al. 2005). A recent measurement carried by Norris et al. (2005) for BATSE wide pulses showed that the long lag range is 1.0 4.2 s. It is generally believed that the gamma-rays arise from internal shocks at a distance of cm from the initial source (Piran 2005). Within the generally accepted ranges of cm and , the observed lags could be accounted for by the curvature effect when different values of parameters are adopted. For example, one gets ms from Fig. 1 when taking ; from Fig. 7 when taking , and . According to Fig. 2, s. One could obtain a large lag, i.e., s when taking . In this situation, the of the corresponding light curve determined by equation (1) is about 75 s when taking , which is very close to the observed data of the wide-pulse bursts studied in Norris et al. (2005), i.,e., s and the width of channel 1 (see Fig. 6 in that paper). All these show that merely the curvature effect could produce the observed lags. A larger lag requires a wider local pulse.
We thus come to the following conclusions: a) lag with 2 within different energy channels, and the relationship would different for different rest frame peak energy ; b) lag is proportional to the local pulse width and the of the observed light curves, and the local pulse width plays a more important role in producing a large lag when compared with other lag’s dependent parameters; c) a large lag requires a large and a small as well as a large ; d) when the rest frame spectrum varies with time, the lag would become larger; e) lag decreases with the increasing of ; f) lag E within a certain energy range for a given ; g) lag is proportional to the opening angle of uniform jets when .
We are very grateful to Dr. Rong-feng Shen for sending us his valuable program and for his helpful suggestions. This work is supported by the Special Funds for Major State Basic Research Projects (“973”) and National Natural Science Foundation of China (No. 10273019 and No. 10463001).
References
- [Band et al. (1993)] Band, D.,Matteson, J., Ford, L., Schaefer, B., Palmer, D., Teegarden, B., Cline, T., Briggs, M., et al. 1993, ApJ, 413, 281
- [Band, David L. (1997)] Band, David L. 1997, ApJ, 486, 928B
- [Chen et al. (2005)] Chen, Li, Lou, Yu-Qing, Wu, Mei, Qu, Jin-Lu, Jia, Shu-Mei, Yang, Xue-Juan. 2005, ApJ, 619, 983
- [Cheng et al. (1995)] Cheng L. X., Ma Y.Q., Cheng K. S., Lu T. & Zhou Y. Y. 1995, A&A, 300, 746
- [Fishman et al. (1995)] Fishman, G., Meegan, C. 1995, ARA&A, 33, 415
- [Ford et al. (1995)] Ford, L. A., Band, D. L., Matteson, J. L., Briggs, M. S., Pendleton, G. N., Preece, R. D., Paciesas, W. S., Teegarden, B. J., et al. 1995, ApJ, 439, 307F
- [Friedman et al. (2005)] Friedman, Andrew S. & Bloom, Joshua S. 2005, ApJ,627, 1F
- [Ioka et al. (1999)] Ioka K. & Nakamura T. 2001, ApJ, L163
- [Kocevski et al. (2003)] Kocevski D. & Liang E. 2003a, ApJ, 594, 385
- [Kocevski et al. (2003)] Kocevski D., Ryde F., & Liang E., 2003b, ApJ, 596, 389
- [Lu et al. (2005)] Lu, R. J., Qin, Y. P., & Yi, T. F., 2005a, Chin. J. Astron. Astrophys., in press, astro-ph/0508599
- [Lu et al. (2005)] Lu, R. J., Qin, Y. P., 2005b, MNRAS, Submitted, astro-ph/0508537
- [Norris et al. (1996)] Norris, J. P., Nemiroff, R. J., Bonnell, J. T., Scargle, J. D., Kouveliotou, C., Paciesas, W. S., Meegan, C. A., Fishman, G. J. 1996, ApJ, 459, 393
- [Norris et al. (2000)] Norris, J. P., Marani G. F., & Bonnell J. T. 2000, ApJ, 534, 248
- [Norris et al. (2001)] Norris J. P., Scargle, J. D. & Bonnell, J. T. 2001, astro-ph/0105052
- [Norris et al. (2005)] Norris, J. P., Bonnell, J. T., Kazanas, D., Scargle, J. D., Hakkila, J., Giblin, T. W. 2005, ApJ, 627, 324N
- [Piran (1995)] Piran, T. 1995, in AIP Conf. Proc. 307, Gamma-Ray Bursts: Second Huntsville Workshop, ed. G. J. Fishman, J. J. Brainerd, & K. Hurley (New York: AIP), 495
- [Piran (1999)] Piran, T. 1999, Phys. Rep., 314, 575
- [Piran (2005)] Piran, T. 2005, Rev. Mod. Phys. 76, 1143
- [Preece et al. (1998)] Preece, R. D., Pendleton, G. N., Briggs, M. S.,Mallozzi, Robert S., Paciesas, William S., Band, David L., Matteson, James L., Meegan, C. A. 1998, ApJ, 496, 849
- [Preece et al. (2000)] Preece, R. D., Briggs, M. S., Mallozzi, R. S., Pendleton, G. N., Paciesas, W. S. and Band, D. L. 2000, ApJS, 126, 19
- [Qin (2002)] Qin, Y.-P. 2002, A&A, 396, 705
- [Qin (2003)] Qin, Y.-P. 2003, A&A, 407, 393
- [Qin et al. 2004] Qin, Y. P., Zhang Z. B., Zhang F. W. and Cui X. H. 2004, ApJ, 617, 439 (Paper II)
- [Qin & Zhang (2005)] Qin, Y.-P., & Zhang, B.-B. 2005a, astro-ph/0504070
- [Qin et al. (2005)] Qin, Y.-P., & Dong, Y.-M., & Lu R.-J., B.-B. Zhang, L.-W. Jia 2005b, ApJ, 632, 1008
- [Ryde et al. (2003)] Ryde F., Borgonovo L., Larsson S. et al., 2003, A&A, 411, L331
- [Schaefer et al. (1994)] Schaefer, Bradley E., Teegarden, Bonnard J., Fantasia, Stephan F., Palmer, David, Cline, Thomas L., Matteson, James L., Band, David L., Ford, Lyle A., et al. 1994, ApJS, 92, 285S
- [Schaefer et al. (2004)] Schaefer, Bradley E. 2004, ApJ, 602, 306
- [Shen et al. (2005)] R.-F. Shen, L.-M. Song, Z. Li, 2005, MNRAS, 362, 59S (Paper I)
- [Salmonson (2000)] Salmonson J. D. 2000, ApJ, 544, L115
- [Wu et al. (2000)] Wu B. & Fenimore E. 2000, ApJ, 535, L29