Deep Near-Infrared Imaging and Photometry of the Antennae Galaxies with WIRC
Abstract
We present deep near-infrared images of the Antennae galaxies, taken with the Palomar Wide-Field Infrared Camera WIRC The images cover a ) area around the galaxy interaction zone. We derive and band photometric fluxes for 172 infrared star clusters, and discuss details of the two galactic nuclei and the overlap region. We also discuss the properties of a subset of 27 sources which have been detected with WIRC, HST and the VLA. The sources in common are young clusters of less than 10 Myr, which show no correlation between their infrared colors and 6 cm radio properties. These clusters cover a wide range in infrared color due to extinction and evolution. The average extinction is about mag while the reddest clusters may be reddened by up to 10 magnitudes.
Subject headings:
galaxies: individual (NGC 4038/39 (catalog )), galaxies: interacting1. Introduction
The Antennae galaxies, NGC 4038/39 (Arp 244), are probably the best-known example of a pair of interacting galaxies. At a distance of only 19.2 Mpc111assuming (Whitmore et al., 1999) the Antennae system has been thoroughly studied over a large range of wavelengths.
Numerous observations that cannot be listed here individually have been made at far-infrared, sub-millimeter and radio wavelengths. They generally agree that the most of the emission at longer wavelengths comes from the highly extincted overlap region. The largest molecular complexes have masses of , typically an order of magnitude larger than the largest structures in the disks of more quiescent spiral galaxies (Wilson et al., 2000). These authors also found an excellent correlation between the CO emission and the m emission seen by ISO (Mirabel et al., 1998). Recent mid-IR observations at slightly higher spatial resolutions with Spitzer (Wang et al., 2004) showed that the rate of star formation per unit mass in the active areas is comparable to those in starburst and some ultra-luminous galaxies.
The first deep optical analysis of the Antennae with the Wide Field Camera on HST (Whitmore & Schweitzer, 1995) showed over 700 point-like objects. Subsequent observations with WFPC2 (Whitmore et al., 1999) increased the sensitivity by 3 magnitudes in V band and revealed between 800 and 8000 clusters in four age ranges: (i) ages of Myr around the edges of the overlap region and Myr in the western loop, (ii) ages Myr in the northeastern star formation region, (iii) intermediate-age clusters of Myr and (iv) old globular clusters from the progenitor galaxies. While Whitmore et al. (1999) and Fritze-v. Alvensleben (1999) studied the statistical properties of the cluster population, Gilbert et al. (2000) and Mengel et al. (2002) investigated the properties of selected “super star clusters” in greater detail.
X-ray observations with Chandra (Zezas et al., 2002) revealed 49 sources, including several ultra-luminous X-ray (ULX) sources with X-ray luminosities of erg s-1, suggesting these are binary accretion sources.
So far, most studies of the star clusters in the Antennae have been focused on a single wavelength regime with few exceptions: Zhang, Fall & Whitmore (2001) studied the relationship between young star clusters and the interstellar medium based on observations ranging from X-rays to the radio wavelengths, and Whitmore & Zhang (2002) correlated optically detected star clusters with their radio counterparts from (Neff & Ulvestad, 2000). Kassin et al. (2003) combined UBVRJHK images to derive extinction maps for the Antennae and found several red clusters.
This paper is the first one of a series to study the correlation between the near-infrared sources based on the WIRC images and their radio counterparts (Neff & Ulvestad (2000), Whitmore & Zhang (2002)); subsequent papers (Clark et al., 2005) focus on the correlation between the infrared and X-ray sources (Zezas et al., 2002). Here we present deep near-infrared observations of NGC 4038/39 obtained with WIRC. We give a brief description of the instrument, discuss the infrared morphology of the Antennae galaxies, and our photometric methods. In section 3 we discuss the properties of the infrared sources and focus on the infrared sources with radio and optical counterparts.
2. The Data
2.1. Observations
We observed NGC 4038/39 with the new wide-field infrared camera WIRC (Wilson et al., 2003) mounted to the prime focus of the Hale telescope on Palomar Moutain. The observations were part of the commissioning of the instrument. The “original” version222Recently, a collaborative agreement with Caltech allowed the upgrade to a pixel2 Rockwell Hawaii-II array that provides a field of view. of WIRC, which was used for the observations presented in this paper, featured a field-of-view (FOV) of with a square pixel Rockwell HAWAII-I detector. WIRC mounts at the telescope’s f/3.3 prime focus. The instrument’s seeing-limited optical design, optimized for the JHK near-IR atmospheric bands, includes a 4-element refractive collimator, two 7-position filter wheels that straddle a Lyot stop, and a 5-element refractive f/3 camera. Typical seeing-limited point spread functions are slightly oversampled with a /pixel plate scale at the detector.
We took the observations on 22 March 2002 under good atmospheric conditions but at high airmass (). Using Gaussian fits to the stellar point sources within the FOV we determined FWHM and FWHM. The observing procedure was controlled by a simple macro that commanded the telescope to 20 random dither positions for better redundancy and enlarged field of view. At each dither position two and eight exposures were taken in the and filters, respectively. Because of the higher sky background the integration times were shorter in (7.27 s) than in (29.07 s). The resulting total integration times were 19.38 minutes in both and .
2.2. Data Reduction
We carried out the data reduction in IDL using a self-written procedure. First, we averaged multiple exposures of each position and subtracted the “sky”. Since no additional observations of a nearby, blank sky had been taken, we computed the lowered (1/3 instead of 1/2) median of the 20 dither positions. The relative offsets between the pointings were sufficiently large so that the filtered image looks reasonably smooth with no noticeable residuals from the galaxies, serving as a good “sky” image. For diagnostic purposes we have also rebinned the “sky” image to quantify a possible underlying gradient from insufficiently subtracted diffuse emission of the galactic halos and found that such a contribution must be less than 8%, which corresponds to a photometric error of 0.1 magnitudes. However, this value is only an upper limit since it may also include contributions from a possible gradient in the sky background emission.
The next step was to apply the flat-field, which was computed from two series of twilight exposures at high and low flux levels. Five difference images between high and low flux twilights have been computed, inverted and normalized. Finally, the median of those five frames was calculated and renormalized.
The positional offset between the different images was derived from cross-correlating the individual images relative to a reference frame on an integer pixel grid. Finally, the 20 aligned images were combined via the median technique.
2.3. Image Morphology
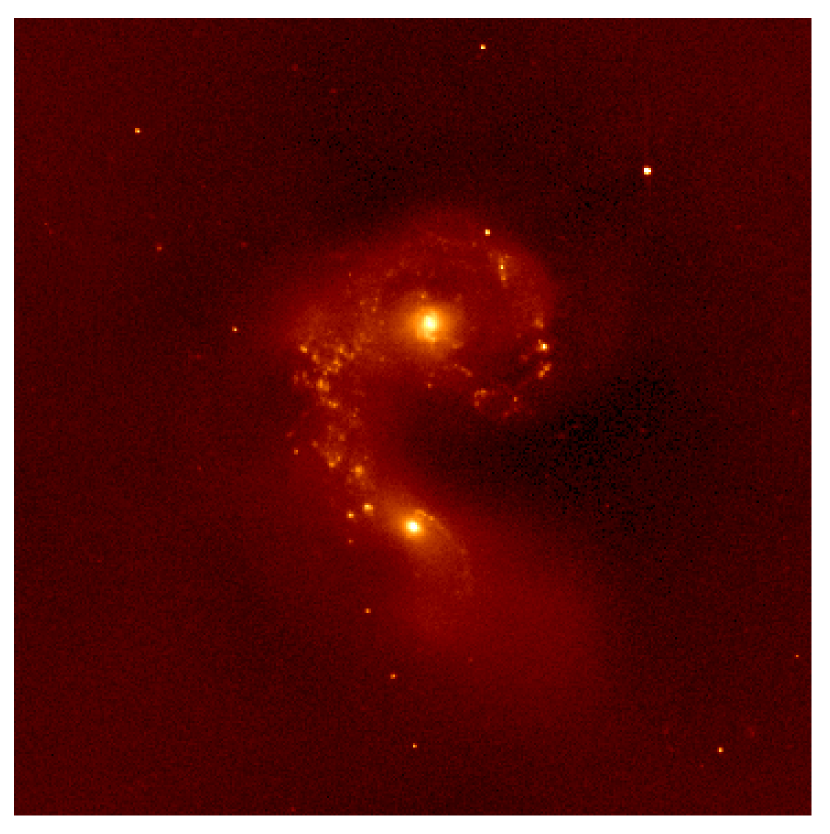
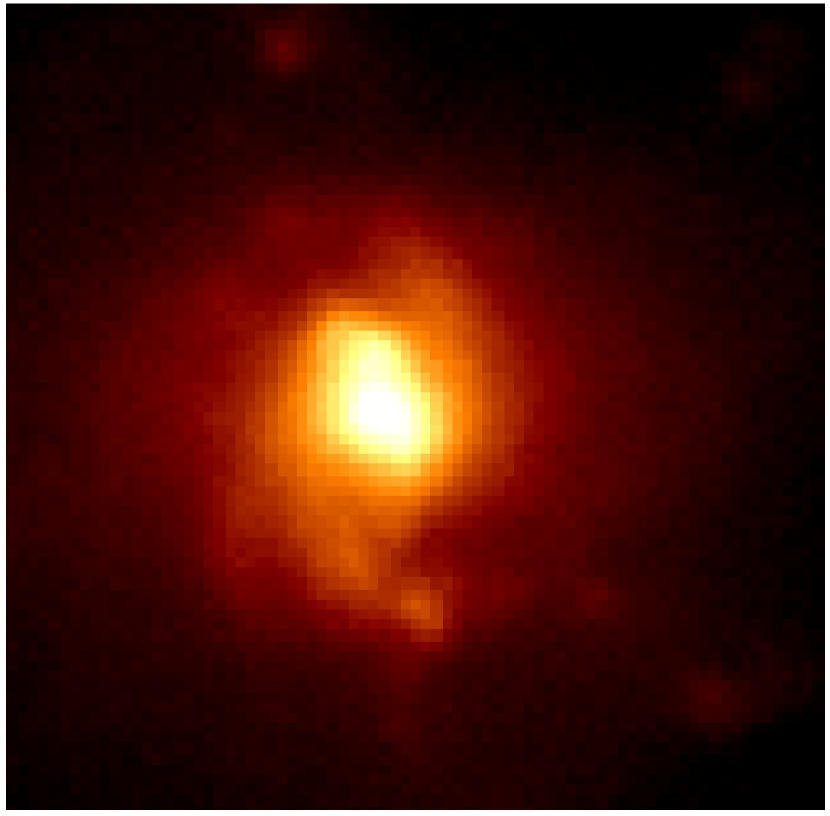
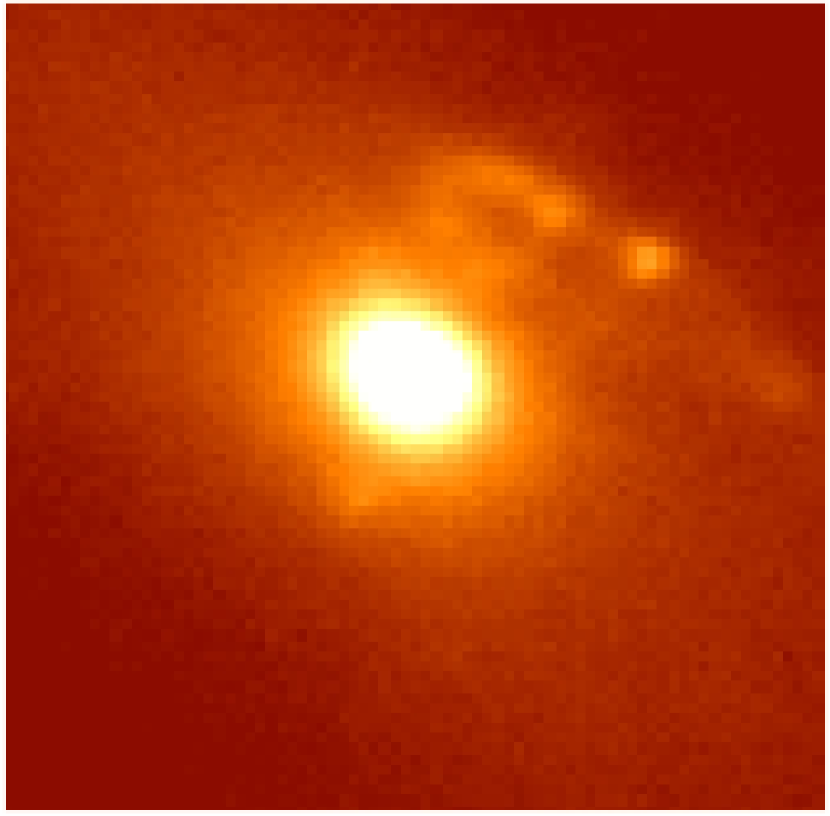
The resulting image of the entire FOV is shown in Figure 1. (The band image shows similar structure and is not shown here.) The image is clearly dominated by the two nuclei of the interacting galaxies. In the Third Reference Catalogue of Bright Galaxies (de Vaucouleurs et al., 1991) NGC 4038 is classified as SB(s)m pec (), while NGC 4039 is classified as SA(s)m pec (). Figure 2 shows the image of both nuclei in more detail. While the nucleus of NGC 4039 in the image looks very similar to the optical structure, the nucleus of NGC 4038 looks very different. Most notably, the dust lane in east-west direction has become almost invisible, replaced by the prominent spiral arm structure of an Sb-type galaxy.
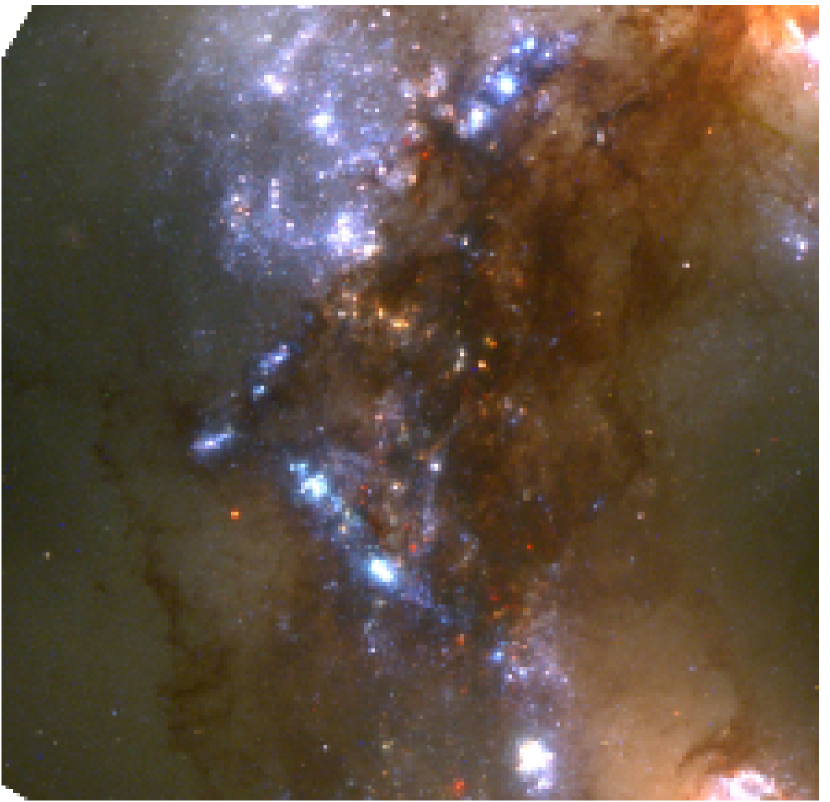
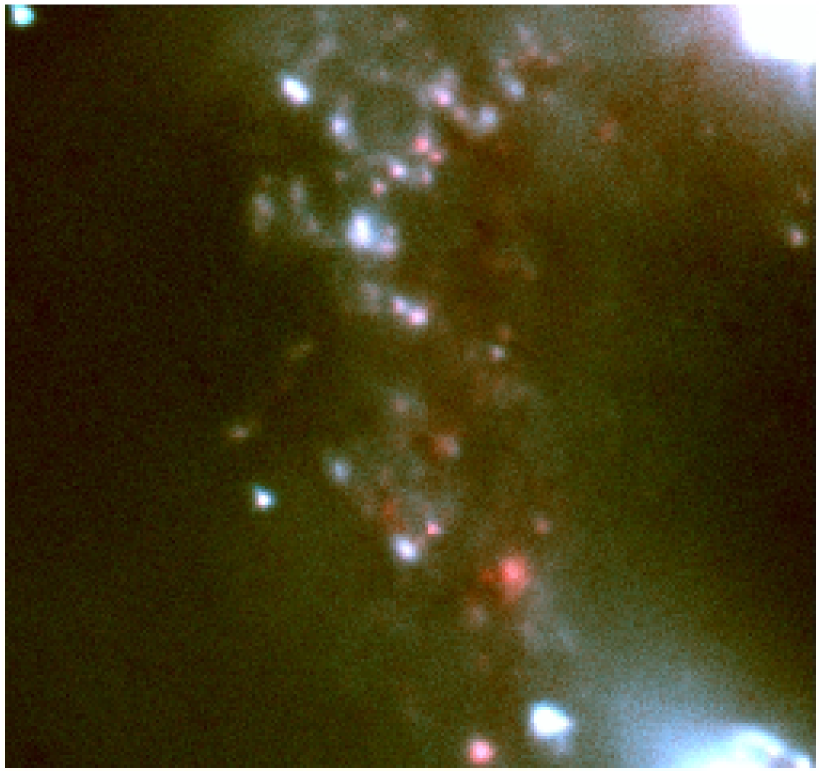
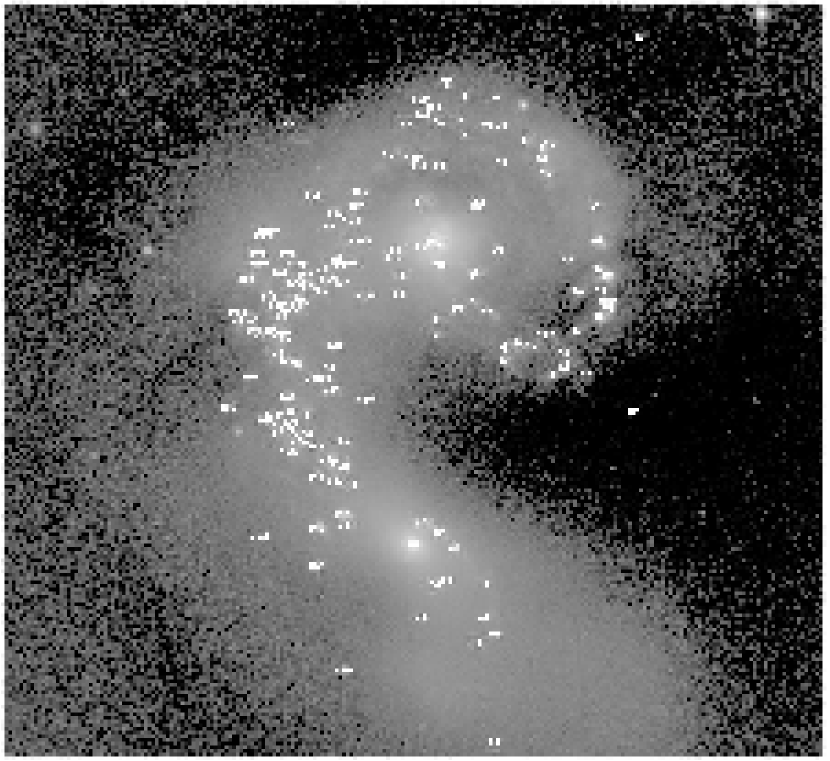
Besides the two nuclei, the star clusters in the western loop and the southeastern overlap region are clearly visible. A color zoom into the overlap region is shown in Figure 3, side-by-side with the optical WFPC2 image from Whitmore et al. (1999).
Figure 5 illustrates the locations of all the near-IR sources detected in the WIRC images. We discuss the infrared sources in more detail in section 3.

2.4. Cluster Identification
Because of the varying shapes of the clusters and the gradients of the underlying background the best method of cluster detection was by eye. Small, compact “smudges” that could be distinguished from the background and were detectable at both and were selected, 229 sources in total, which are labeled in Fig. 4.
However, not all of these sources are good cluster candidates: eight are known stars, one is a background quasar, and many more lie outside the area with increased starburst activity. They are therefore not likely to be massive star clusters associated with the Antennae galaxies. Investigating their true nature is not the aim of this paper; however, for completeness we list the 57 infrared sources, which are likely not Antennae clusters, in Table 1.
| IdW | RA (J2000) | Dec (J2000) | () | ||||
|---|---|---|---|---|---|---|---|
| 1 | 12:01:44.64 | -18:53:55.04 | 16.94 | 0.02 | 16.20 | 0.01 | 0.74 |
| 2 | 12:01:44.57 | -18:52:35.51 | 19.39 | 0.04 | 17.36 | 0.02 | 2.03 |
| 3 | 12:01:44.81 | -18:54:24.56 | 18.06 | 0.03 | 17.94 | 0.07 | 0.12 |
| 4 | 12:01:44.80 | -18:53:26.43 | 19.34 | 0.03 | 17.84 | 0.02 | 1.50 |
| 5 | 12:01:45.04 | -18:53:04.93 | 18.79 | 0.02 | 18.40 | 0.04 | 0.39 |
| 6 | 12:01:45.71 | -18:54:20.70 | 18.69 | 0.04 | 16.99 | 0.02 | 1.70 |
| 7 | 12:01:45.79 | -18:53:46.00 | 19.24 | 0.04 | 17.88 | 0.03 | 1.36 |
| 8 | 12:01:45.75 | -18:51:34.71 | 17.90 | 0.03 | 17.45 | 0.04 | 0.45 |
| 9 | 12:01:46.47 | -18:54:25.30 | 14.90 | 0.01 | 15.03 | 0.01 | -0.13 |
| 10 | 12:01:46.79 | -18:53:29.36 | 19.29 | 0.14 | 19.17 | 0.14 | 0.12 |
| 11 | 12:01:46.80 | -18:53:26.56 | 19.88 | 0.21 | 20.55 | 0.99 | -0.67 |
| 12 | 12:01:46.91 | -18:54:30.77 | 18.33 | 0.03 | 17.48 | 0.10 | 0.85 |
| 13 | 12:01:46.94 | -18:54:00.17 | 20.13 | 0.08 | 20.12 | 0.19 | 0.01 |
| 15 | 12:01:47.47 | -18:54:40.28 | 19.08 | 0.09 | 19.01 | 0.11 | 0.07 |
| 16 | 12:01:47.61 | -18:54:24.68 | 19.62 | 0.02 | 17.66 | 0.03 | 1.96 |
| 17 | 12:01:47.33 | -18:50:59.02 | 17.98 | 0.02 | 18.19 | 0.09 | -0.21 |
| 18 | 12:01:47.44 | -18:51:20.14 | 18.81 | 0.10 | 19.29 | 0.11 | -0.48 |
| 19 | 12:01:47.73 | -18:54:19.55 | 19.11 | 0.07 | 17.29 | 0.02 | 1.82 |
| 21 | 12:01:47.90 | -18:51:15.66 | 13.07 | 0.01 | 12.77 | 0.00 | 0.30 |
| 22 | 12:01:48.13 | -18:52:40.49 | 18.40 | 0.01 | 17.31 | 0.03 | 1.09 |
| 23 | 12:01:48.17 | -18:51:09.71 | 19.28 | 0.04 | 19.48 | 0.34 | -0.20 |
| 24 | 12:01:48.56 | -18:53:41.55 | 19.14 | 0.03 | 18.17 | 0.06 | 0.97 |
| 25 | 12:01:48.56 | -18:53:25.99 | 19.32 | 0.04 | 19.04 | 0.16 | 0.28 |
| 26 | 12:01:48.97 | -18:53:04.70 | 18.12 | 0.02 | 17.31 | 0.02 | 0.81 |
| 27 | 12:01:48.97 | -18:53:04.70 | 18.20 | 0.01 | 17.31 | 0.02 | 0.89 |
| 28 | 12:01:49.03 | -18:53:22.02 | 19.33 | 0.06 | 18.59 | 0.06 | 0.74 |
| 29 | 12:01:48.88 | -18:50:38.89 | 19.60 | 0.09 | 18.96 | 0.08 | 0.64 |
| 30 | 12:01:49.78 | -18:51:20.42 | 17.85 | 0.03 | 17.77 | 0.04 | 0.08 |
| 33 | 12:01:50.43 | -18:54:15.12 | 17.69 | 0.01 | 18.14 | 0.05 | -0.45 |
| 36 | 12:01:50.38 | -18:52:53.80 | 18.71 | 0.03 | 18.64 | 0.11 | 0.07 |
| 64 | 12:01:51.63 | -18:51:34.61 | 14.84 | 0.01 | 14.24 | 0.01 | 0.60 |
| 113 | 12:01:53.58 | -18:54:21.76 | 15.94 | 0.01 | 15.41 | 0.01 | 0.53 |
| 122 | 12:01:54.06 | -18:53:58.92 | 16.28 | 0.01 | 15.50 | 0.01 | 0.78 |
| 143 | 12:01:54.78 | -18:54:09.90 | 19.65 | 0.05 | 18.00 | 0.02 | 1.65 |
| 155 | 12:01:54.97 | -18:53:14.51 | 17.55 | 0.02 | 16.16 | 0.01 | 1.39 |
| 159 | 12:01:54.87 | -18:51:47.35 | 18.01 | 0.01 | 17.04 | 0.02 | 0.97 |
| 211 | 12:01:56.20 | -18:52:44.80 | 16.49 | 0.02 | 16.37 | 0.01 | 0.12 |
| 215 | 12:01:57.36 | -18:51:36.87 | 19.08 | 0.03 | 17.11 | 0.02 | 1.97 |
| 216 | 12:01:57.56 | -18:52:04.59 | 15.56 | 0.01 | 15.16 | 0.01 | 0.40 |
| 217 | 12:01:58.22 | -18:51:17.21 | 18.31 | 0.03 | 17.90 | 0.06 | 0.41 |
| 218 | 12:01:58.44 | -18:52:49.44 | 17.64 | 0.02 | 16.90 | 0.04 | 0.74 |
| 219 | 12:01:58.44 | -18:52:49.44 | 17.56 | 0.01 | 16.90 | 0.04 | 0.66 |
| 220 | 12:01:58.41 | -18:52:13.50 | 18.59 | 0.02 | 17.05 | 0.02 | 1.54 |
| 221 | 12:01:58.74 | -18:52:53.68 | 18.89 | 0.03 | 18.53 | 0.03 | 0.36 |
| 222 | 12:01:58.93 | -18:54:13.93 | 19.15 | 0.04 | 18.75 | 0.06 | 0.40 |
| 223 | 12:01:59.26 | -18:51:37.28 | 17.78 | 0.01 | 15.97 | 0.01 | 1.81 |
| 224 | 12:01:59.91 | -18:54:32.23 | 18.82 | 0.02 | 18.20 | 0.03 | 0.62 |
| 225 | 12:01:59.72 | -18:50:58.89 | 15.86 | 0.01 | 14.91 | 0.01 | 0.95 |
| 226 | 12:02:00.11 | -18:54:32.68 | 19.23 | 0.03 | 18.48 | 0.07 | 0.75 |
| 227 | 12:02:00.26 | -18:54:34.41 | 18.79 | 0.02 | 18.42 | 0.11 | 0.37 |
| 228 | 12:02:00.00 | -18:50:27.18 | 18.94 | 0.02 | 18.71 | 0.07 | 0.23 |
| 229 | 12:02:00.37 | -18:51:07.60 | 18.56 | 0.03 | 17.74 | 0.04 | 0.82 |
| 230 | 12:02:00.39 | -18:51:11.42 | 19.10 | 0.03 | 20.09 | 0.14 | -0.99 |
| 231 | 12:02:00.92 | -18:54:22.48 | 18.85 | 0.12 | 19.49 | 0.05 | -0.64 |
| 232 | 12:02:01.47 | -18:51:56.97 | 19.42 | 0.04 | 20.21 | 0.24 | -0.79 |
| 233 | 12:02:01.78 | -18:51:31.37 | 20.11 | 0.05 | 17.45 | 0.04 | 2.66 |
| 234 | 12:02:01.87 | -18:51:28.54 | 19.56 | 0.03 | 17.17 | 0.03 | 2.39 |
Subtracting these contaminating sources we found a total of 172 good Antennae cluster candidates with a signal-to-noise ratio in both filter bands. For that signal-to-noise ratio we derive position-dependent completeness limits of and . The reddest clusters with are listed in Table 2.
| IdWaaIdentification number from the WIRC image. | RA (J2000) | Dec (J2000) | () | ||||
|---|---|---|---|---|---|---|---|
| 135 | 12:01:54.48 | -18:52:08.89 | 20.30 | 0.45 | 16.84 | 0.03 | 3.46 |
| 190 | 12:01:55.58 | -18:52:45.51 | 19.16 | 0.06 | 16.79 | 0.03 | 2.37 |
| 125 | 12:01:54.14 | -18:52:03.39 | 19.51 | 0.08 | 17.21 | 0.02 | 2.30 |
| 139 | 12:01:54.57 | -18:52:47.36 | 18.67 | 0.03 | 16.72 | 0.02 | 1.95 |
| 148 | 12:01:54.76 | -18:52:51.38 | 16.76 | 0.02 | 14.88 | 0.04 | 1.88 |
| 157 | 12:01:54.96 | -18:53:06.10 | 16.52 | 0.01 | 14.66 | 0.01 | 1.86 |
| 111 | 12:01:53.41 | -18:53:26.49 | 19.20 | 0.04 | 17.36 | 0.02 | 1.84 |
| 128 | 12:01:54.32 | -18:51:59.00 | 18.21 | 0.02 | 16.38 | 0.01 | 1.83 |
| 141 | 12:01:54.55 | -18:52:08.10 | 18.38 | 0.89 | 16.63 | 0.01 | 1.75 |
| 144 | 12:01:54.59 | -18:51:57.13 | 18.50 | 0.03 | 16.81 | 0.02 | 1.69 |
| 124 | 12:01:54.14 | -18:52:15.37 | 18.51 | 0.02 | 16.85 | 0.01 | 1.66 |
| 129 | 12:01:54.32 | -18:51:59.00 | 17.81 | 0.01 | 16.28 | 0.03 | 1.53 |
| 84 | 12:01:52.37 | -18:51:56.30 | 18.06 | 0.07 | 16.56 | 0.02 | 1.50 |
| 169 | 12:01:55.21 | -18:52:08.40 | 18.80 | 0.07 | 17.31 | 0.02 | 1.49 |
| 165 | 12:01:55.08 | -18:52:12.27 | 16.99 | 0.03 | 15.50 | 0.01 | 1.49 |
| 167 | 12:01:55.14 | -18:52:17.09 | 17.25 | 0.03 | 15.77 | 0.01 | 1.48 |
| 126 | 12:01:54.18 | -18:51:52.41 | 19.08 | 0.03 | 17.60 | 0.03 | 1.48 |
| 116 | 12:01:53.54 | -18:52:10.98 | 19.15 | 0.52 | 17.71 | 0.03 | 1.44 |
| 182 | 12:01:55.36 | -18:52:18.04 | 16.98 | 0.10 | 15.55 | 0.03 | 1.43 |
| 32 | 12:01:50.01 | -18:52:42.19 | 18.80 | 0.04 | 17.40 | 0.02 | 1.40 |
| 168 | 12:01:55.21 | -18:52:47.16 | 17.10 | 0.07 | 15.71 | 0.02 | 1.39 |
| 46 | 12:01:50.43 | -18:50:40.43 | 19.33 | 0.03 | 18.00 | 0.04 | 1.33 |
| 172 | 12:01:55.23 | -18:52:12.22 | 17.61 | 0.05 | 16.28 | 0.03 | 1.33 |
| 52 | 12:01:50.97 | -18:52:08.48 | 18.59 | 0.02 | 17.27 | 0.03 | 1.32 |
| 63 | 12:01:51.57 | -18:51:41.77 | 17.78 | 0.01 | 16.49 | 0.02 | 1.29 |
| 77 | 12:01:52.27 | -18:53:54.13 | 18.73 | 0.03 | 17.48 | 0.02 | 1.25 |
| 75 | 12:01:52.22 | -18:53:30.95 | 18.62 | 0.03 | 17.37 | 0.02 | 1.25 |
| 82 | 12:01:52.34 | -18:51:55.30 | 18.01 | 0.02 | 16.77 | 0.01 | 1.24 |
| 206 | 12:01:55.95 | -18:52:32.64 | 18.66 | 0.05 | 17.42 | 0.02 | 1.24 |
| 106 | 12:01:53.20 | -18:52:04.71 | 15.95 | 0.01 | 14.71 | 0.15 | 1.24 |
| 71 | 12:01:51.95 | -18:51:38.59 | 18.15 | 0.05 | 16.92 | 0.02 | 1.23 |
| 188 | 12:01:55.49 | -18:52:19.27 | 17.52 | 0.01 | 16.29 | 0.02 | 1.23 |
| 170 | 12:01:55.22 | -18:52:15.79 | 16.63 | 0.01 | 15.40 | 0.01 | 1.23 |
| 95 | 12:01:52.96 | -18:53:18.47 | 19.08 | 0.02 | 17.86 | 0.02 | 1.22 |
| 98 | 12:01:53.01 | -18:52:20.83 | 18.36 | 0.07 | 17.16 | 0.02 | 1.20 |
| 187 | 12:01:55.46 | -18:52:10.11 | 18.64 | 0.21 | 17.45 | 0.03 | 1.19 |
| 145 | 12:01:54.67 | -18:52:56.00 | 17.86 | 0.02 | 16.67 | 0.02 | 1.19 |
| 130 | 12:01:54.37 | -18:52:08.16 | 18.36 | 0.04 | 17.17 | 0.02 | 1.19 |
| 118 | 12:01:53.60 | -18:52:05.35 | 17.93 | 0.26 | 16.74 | 0.15 | 1.19 |
| 78 | 12:01:52.17 | -18:51:39.03 | 18.29 | 0.02 | 17.11 | 0.08 | 1.18 |
| 117 | 12:01:53.56 | -18:52:15.30 | 19.14 | 0.03 | 17.96 | 0.05 | 1.18 |
| 142 | 12:01:54.63 | -18:52:26.43 | 18.14 | 0.07 | 16.97 | 0.04 | 1.17 |
| 183 | 12:01:55.32 | -18:51:37.26 | 20.54 | 0.15 | 19.38 | 0.22 | 1.16 |
| 171 | 12:01:55.22 | -18:52:18.34 | 17.17 | 0.11 | 16.03 | 0.06 | 1.14 |
| 92 | 12:01:52.84 | -18:53:10.86 | 18.17 | 0.02 | 17.04 | 0.14 | 1.13 |
| 97 | 12:01:52.94 | -18:51:47.45 | 18.79 | 0.05 | 17.68 | 0.02 | 1.11 |
| 151 | 12:01:54.77 | -18:52:31.24 | 18.29 | 0.05 | 17.18 | 0.03 | 1.11 |
| 94 | 12:01:52.79 | -18:51:28.89 | 19.02 | 0.09 | 17.92 | 0.03 | 1.10 |
| 156 | 12:01:54.94 | -18:52:54.89 | 17.83 | 0.02 | 16.73 | 0.03 | 1.10 |
| 153 | 12:01:54.82 | -18:52:33.26 | 17.97 | 0.02 | 16.88 | 0.02 | 1.09 |
| 185 | 12:01:55.45 | -18:52:24.39 | 16.63 | 0.06 | 15.55 | 0.05 | 1.08 |
| 179 | 12:01:55.35 | -18:52:06.06 | 18.63 | 0.02 | 17.56 | 0.03 | 1.07 |
| 115 | 12:01:53.49 | -18:51:37.84 | 18.56 | 0.01 | 17.50 | 0.02 | 1.06 |
| 91 | 12:01:52.64 | -18:51:37.35 | 17.93 | 0.03 | 16.88 | 0.02 | 1.05 |
| 207 | 12:01:55.97 | -18:52:19.89 | 17.61 | 0.03 | 16.58 | 0.02 | 1.03 |
| 110 | 12:01:53.25 | -18:51:47.36 | 18.39 | 0.02 | 17.36 | 0.02 | 1.03 |
| 173 | 12:01:55.29 | -18:52:30.05 | 16.25 | 0.05 | 15.23 | 0.03 | 1.02 |
| 90 | 12:01:52.68 | -18:52:18.64 | 18.24 | 0.17 | 17.23 | 0.04 | 1.01 |
| 58 | 12:01:51.29 | -18:51:49.77 | 16.34 | 0.05 | 15.33 | 0.01 | 1.01 |
| 177 | 12:01:55.38 | -18:52:40.73 | 19.67 | 0.16 | 18.67 | 0.24 | 1.00 |
We determined the source positions via cross-correlation between WIRC and 2MASS (Skrutskie et al., 2005). We identified six bright, compact IR sources common to both WIRC and 2MASS images. Using a least squares fit to a two-dimensional linear matching function, we associated WIRC x,y pixel centroids to the 2MASS right ascension and declination, yielding a positional uncertainty of . Considering the systematic offsets between the 2MASS, HST and Chandra coordinate systems in the order of , this uncertainty seems negligible. Figure 5 illustrates the location of the detected infrared clusters.
2.5. Photometry
To derive the photometric fluxes we used a self-written IDL procedure for simple aperture photometry with a 5-pixel radius at , and a 6-pixel radius at , corresponding to of the Gaussian PSF. In order to estimate the uncertainties in background subtraction, we measured the background in two separate annuli around each source: one from 9 to 12 pixels and another from 12 to 15 pixels. Due to the high concentration of clusters, we employed the use of sky background arcs instead of annuli for some sources. These were defined by a position angle and opening angle with respect to the source center. All radii were kept constant to ensure consistency. In addition, nearby bright sources could shift the computed central peak position by as much as a pixel or two. If the centroid position determined for a given source differed by more than one pixel from the apparent peak due to such contamination, we forced the center of the photometric apertures to be at the apparent peak position. For both annular regions, we calculated the mean and median backgrounds per pixel.
Multiplying the backgrounds by the area of the central aperture, these values were subtracted from the flux measurement of the central aperture to yield four flux values for the source in terms of DN. Averaging the four values provided us with a flux value for each cluster. We did not apply any aperture correction factors since these are negligible for our seeing-limited PSFs. We computed errors by considering both variations in sky background, , and Poisson noise, . We computed by taking the standard deviation of the four measured flux values. We then calculated the expected Poisson noise by scaling DN to using the known gain of WIRC (Wilson et al., 2003) and taking the square root of this value. We added both terms in quadrature for the total photometric errors that are listed in Tables 2 and 3.
Finally, we calibrated the derived source fluxes with the bright 2MASS star ‘2MASS 12014790-1851156’ at , which is listed in the 2MASS database with and , and was in the WIRC FOV during the Antennae observations.
| IdHaaIdentification number from the HST image (Whitmore & Zhang, 2002). | IdWbbIdentification number from the WIRC image. | RA (J2000) | Dec (J2000) | DiffccRadial difference between HST and WIRC position in arcseconds. | AgeddAge in million years according to Whitmore & Zhang (2002). | FluxeeFlux density at 6 cm in mJy from Neff & Ulvestad (2000). | |||||||
|---|---|---|---|---|---|---|---|---|---|---|---|---|---|
| 21 | 34 | 12:01:50.28 | -18:52:17.88 | 0.96 | 4.50 | 49 | -11.37 | 20.04 | 20.19 | 16.72 | 0.02 | 16.17 | 0.01 |
| 19 | 39 | 12:01:50.45 | -18:52:21.14 | 0.15 | 6.40 | 217 | -12.12 | 19.63 | 19.36 | 15.86 | 0.03 | 15.12 | 0.02 |
| 30 | 40 | 12:01:50.44 | -18:52:05.08 | 0.51 | 5.20 | 80 | -12.67 | 19.09 | 18.97 | 16.18 | 0.02 | 15.57 | 0.03 |
| 22 | 48 | 12:01:50.82 | -18:52:15.67 | 0.55 | 4.00 | 102 | -10.57 | 21.00 | 20.78 | 17.09 | 0.01 | 16.21 | 0.01 |
| 16 | 49 | 12:01:50.85 | -18:52:24.07 | 0.68 | 5.20 | 32 | -10.60 | 21.59 | 21.33 | 17.70 | 0.01 | 16.94 | 0.03 |
| 33 | 58 | 12:01:51.29 | -18:51:49.77 | 0.50 | 7.00 | 59 | -13.33 | 20.03 | 18.88 | 16.34 | 0.05 | 15.33 | 0.01 |
| 35 | 59 | 12:01:51.30 | -18:51:44.15 | 1.10 | 7.70 | 43 | -11.19 | 20.82 | 20.19 | 16.34 | 0.06 | 15.86 | 0.01 |
| 15 | 70 | 12:01:52.00 | -18:52:27.53 | 0.75 | 6.00 | 113 | -12.05 | 19.66 | 19.24 | 16.82 | 0.01 | 16.10 | 0.01 |
| 36 | 71 | 12:01:51.95 | -18:51:38.59 | 0.01 | 2.00 | 191 | -12.62 | 21.90 | 21.04 | 18.15 | 0.05 | 16.92 | 0.02 |
| 37 | 91 | 12:01:52.64 | -18:51:37.35 | 0.29 | 2.00 | 71 | -11.67 | 19.75 | 19.63 | 17.93 | 0.03 | 16.88 | 0.02 |
| 28 | 96 | 12:01:52.95 | -18:52:09.12 | 1.05 | 2.00 | 145 | -13.11 | 18.51 | 18.44 | 15.77 | 0.01 | 15.13 | 0.06 |
| 4 | 132 | 12:01:54.49 | -18:53:06.00 | 0.74 | 3.70 | 241 | -11.97 | 21.52 | 20.69 | 16.71 | 0.08 | 16.45 | 0.07 |
| 5 | 136 | 12:01:54.58 | -18:53:03.42 | 0.02 | 3.80 | 2257 | -14.50 | 19.07 | 18.40 | 15.05 | 0.03 | 14.27 | 0.02 |
| 27 | 141 | 12:01:54.55 | -18:52:08.10 | 0.52 | 5.00 | 88 | -13.21 | 19.20 | 19.26 | 18.38 | 0.89 | 16.63 | 0.01 |
| 32 | 144 | 12:01:54.59 | -18:51:57.13 | 0.45 | 2.00 | 493 | -13.16 | 21.26 | 20.36 | 18.50 | 0.03 | 16.81 | 0.02 |
| 26 | 149 | 12:01:54.70 | -18:52:11.62 | 0.60 | 4.00 | 74 | -12.55 | 18.87 | 18.84 | 17.17 | 0.06 | 16.35 | 0.01 |
| 13 | 151 | 12:01:54.77 | -18:52:31.24 | 0.63 | 2.00 | 341 | -13.93 | 22.64 | 20.80 | 18.29 | 0.05 | 17.18 | 0.03 |
| 24 | 154 | 12:01:54.85 | -18:52:13.87 | 0.50 | 8.40 | 120 | -11.85 | 20.74 | 19.75 | 16.60 | 0.03 | 15.92 | 0.01 |
| 3 | 157 | 12:01:54.96 | -18:53:06.10 | 0.00 | 2.00 | 5161 | -15.51 | 23.52 | 20.60 | 16.52 | 0.01 | 14.66 | 0.01 |
| 12 | 160 | 12:01:54.97 | -18:52:33.47 | 1.15 | 4.80 | 61 | -12.06 | 21.87 | 21.08 | 18.11 | 0.02 | 17.47 | 0.04 |
| 10 | 163 | 12:01:55.07 | -18:52:41.08 | 1.10 | 2.00 | 616 | -12.32 | 22.54 | 21.30 | 17.81 | 0.01 | 16.89 | 0.02 |
| 14 | 173 | 12:01:55.29 | -18:52:30.05 | 0.79 | 5.00 | 76 | -12.98 | 22.34 | 20.78 | 16.25 | 0.05 | 15.23 | 0.03 |
| 7 | 176 | 12:01:55.37 | -18:52:49.40 | 0.47 | 2.00 | 1215 | -13.62 | 19.06 | 18.92 | 16.21 | 0.02 | 15.27 | 0.04 |
| 17 | 185 | 12:01:55.45 | -18:52:24.39 | 0.57 | 2.50 | 262 | -12.19 | 20.58 | 20.06 | 16.63 | 0.06 | 15.55 | 0.05 |
| 18 | 192 | 12:01:55.59 | -18:52:22.56 | 1.17 | 7.40 | 217 | -11.92 | 20.31 | 19.65 | 15.86 | 0.07 | 15.21 | 0.04 |
| 9 | 198 | 12:01:55.74 | -18:52:42.40 | 0.58 | 3.00 | 243 | -12.73 | 18.70 | 18.57 | 16.70 | 0.02 | 16.10 | 0.02 |
3. Discussion of the Cluster Properties
3.1. The Reddest Clusters
A side-by-side comparison between the WFPC2 and the WIRC images (Figure 3) reveals distinct differences in the highly obscured overlap region, most notibly the bright cluster #148. If we simply assume that the colors are due to foreground reddening in the overlap region, and not intrinsic to a cluster, Figure 3 would represent an impressive 3-dimensional extinction map of the region, with the bluest clusters being located closest (or in voids) relative to the observer. Fig. 6 shows the vs.() color-magnitude diagram for all infrared cluster sources, including the ones in Table 3.

Kassin et al. (2003), using ground-based observations at seeing, have found five red clusters in the overlap region with , which are too faint in the optical to show up in their - or -band images. Interestingly, corresponds to only (Rieke & Lebofsky, 1985), which is by far not near the blue end of the color distribution in Fig. 6. Since higher spatial resolution is expected to yield a larger range in extinction, the values found by Kassin et al. (2003) under may just represent a lower limit. For comparison, extinction estimates from optical observations at the diffraction limit have been discussed by Whitmore & Zhang (2002).
The observed color spread in Fig. 6 can be caused by two effects, which are difficult to disentangle: extinction and stellar evolution. We have used the starburst modelling package Starburst99 by Leitherer et al. (1999) to estimate the mean color of a young cluster and its evolution with time. For solar metallicity, an upper mass cutoff of , a Salpeter initial mass function (Salpeter, 1955), and an instantaneous burst, the Starburst99 website333http://www.stsci.edu/science/starburst99/ provides the following information: A 1 Myr old cluster has , which slowly decreases with time: at an age of Myr the cluster reaches its blue maximum of , which is mainly due to the evolution of its most massive members into Wolf-Rayet stars. The mean color over its first Myr is . Thereafter, red supergiants appear and the cluster reaches its reddest color of at about 10 Myr. Much older clusters remain at with little color evolution from years.
If we adopt the ages derived by Whitmore & Zhang (2002) for the clusters in Table 3 their mean intrinsic near-IR color is hence . The median color of our clusters, illustrated in Fig. 6, is 0.37 mag above the theoretical average, corresponding to mag (Rieke & Lebofsky, 1985). In other words, the clusters listed in Table 3 experience about two magnitudes of optical extinction, on average. Clusters that are bluer than our median value of 0.87 may either suffer from less extinction or have intrinsically bluer colors. However, clusters which are redder than (the reddest Starburst99 color) are likely to be heavily extincted. Clusters with thus have . If we assume young ages of less than 7 Myr (Tab. 3) the theoretically reddest color is and the individual reddening may be as high as 9.6 mag. This value is in excellent agreement with Gilbert et al. (2000) who derived a screen extinction of toward their reddest cluster #2.
Table 2 lists the magnitudes of the reddest 25 clusters with near-IR colors of . Figure 7 best illustrates the locations of the reddest sources. The () color is indicated by the size of the dots for each individual cluster. The overlap region shows the largest concentration of red clusters, but red sources can also be found outside the overlap region, indicating that star formation is not restricted to the densest region in a global sense – similar to what Wang et al. (2004) found.

3.2. The Radio and Optical Counterparts
VLA radio observations by Neff & Ulvestad (2000) have revealed numerous compact radio sources, which can be either Hii regions or supernova remnants. Whitmore & Zhang (2002) cross-correlated these sources with optical HST counterparts, which basically eliminates the sources that are isolated supernova remnants and not associated with a young cluster.
We have cross-correlated the combined HST and VLA sample from Whitmore & Zhang (2002) with the near-IR WIRC sources, requiring that the positional matches are better than radially. The resulting list is shown in Table 3.
Figure 6 suggests that sources that have been detected with WIRC, HST and VLA do not have distinct infrared colors. In fact, they group almost symmetrically around the median () value of the sample. It is also apparent that the radio sources are among the more luminous clusters of the sample. However, except for the two most luminous radio sources, Figure 8 shows no clear correlation between the radio and the infrared brightness.

If the color of the clusters represent a certain evolutionary state rather than just foreground extinction one would expect some correlation between the radio flux density and the () color. Figure 9 shows the VLA radio flux as a function of the infrared color. However, no such correlation seems to be present, suggesting that the observed optical/infared luminosity is mainly a measure of extinction toward the young clusters, as discussed in section 3.1.

In order to investigate if there is a correlation between optical and infrared colors of the clusters that is not due to extinction we compare the the () vs. () colors in Figure 10. The effect of foreground extinction is indicated by the arrow. Considering a scatter of about 0.5 magnitudes in the near-IR due to extinction and evolution, the location of most data points in this diagram is consistent with extinction as the dominating effect. The most extreme outliers at the blue and red ends are statistically not significant and may be due to mismatches between the optical sources and the IR and/or radio sources.
Figure 10 also shows for each individual cluster its age as derived by Whitmore & Zhang (2002). Within the narrow age range and the errors associated with the age determinations, we find no obvious correlation between age and infrared color for these young clusters.

A detailed discussion of the correlations between radio and optical properties of the young super star clusters in the Antennae has been given by Whitmore & Zhang (2002). However, their comparison is limited by the rather large optical extinction toward young clusters: while the radio-bright phase only lasts about 10 Myr it takes already about 6 Myr for a cluster to clear enough dust to reach (Whitmore & Zhang, 2002). While they find a good correlation between the strength of the radio flux and the emission Whitmore & Zhang (2002) argue that very red clusters are not preferentially radio sources, contrary to earlier suggestions. Our study, providing significantly reduced error bars on the cluster colors over a large range in extinction, confirms the finding that the color of young clusters is apparently not correlated with their radio brightness. There are two likely explanations for this finding. First, starbursts have a complex structure and the intrinsic color of a cluster is difficult to disentangle from patchy foreground extinction, which can introduce a significant scatter in Fig. 9. Second, the radio emission from young clusters is predominantly produced by the most massive stars. Although their strong stellar winds will quickly remove the surrounding gas and dust the associated timescales depend strongly on the stellar density distribution and possible age spread within the cluster (Brandl et al., 2005). Higher angular resolution at near-IR wavelengths combined with accurate photometry, eventually provided by JWST, will be of great importance.
4. Summary
We have presented deep NIR and band images of the Antennae galaxies that cover a large area around the interaction zone. The images were obtained with the new Palomar wide infrared camera WIRC. We presented NIR photometry for 176 non-stellar sources within the observed field of view and correlated the infrared properties of the clusters with catalogued sources from HST and the VLA. Our study of 27 clusters that have been detected by WIRC, HST and the VLA shows that these young clusters cover a wide range in color, which is likely to be a combination of extinction and evolution. The average screen extinction is about mag. However, the reddest colors, which are mainly located in the overlap region, suffer from magnitudes in extinction. We find no obvious correlation between the NIR and the 6 cm radio properties of these clusters. Our study illustrates the potential of multi-wavelength observations and modern, sensitive wide-field infrared cameras.
References
- Brandl et al. (2005) Brandl, B.R., Carey, S., Stauffer, J., Hurt, R., Townsley, L., Zinnecker, H., Massey, P., Churchwell, E., Houck, J.R. 2005, ApJ, in preparation
- Clark et al. (2005) Clark, D.M., et al. 2005, ApJ, submitted
- de Vaucouleurs et al. (1991) de Vaucouleurs et al. 1991, Third Reference Catalogue of Bright Galaxies (Springer, New York)(RC3)
- Fritze-v. Alvensleben (1999) Fritze-v. Alvensleben, U. 1999, A & A, 342, L25
- Gilbert et al. (2000) Gilbert, A.M., et al. 2000, ApJ, 533, L57
- Kassin et al. (2003) Kassin, S.A., Frogel, J.A., Pogge, R.W., Tiede, G.P., & Sellgren, K. 2003, AJ, 126, 1276
- Leitherer et al. (1999) Leitherer, C., et al. 1999, ApJS, 123, 3
- Mengel et al. (2002) Mengel, S., Lehnert, M.D., Thatte, N. & Genzel, R. 2002, A & A, 383, 137
- Mirabel et al. (1998) Mirabel, I.F., et al. 1998, A & A, 333, L1
- Neff & Ulvestad (2000) Neff, Susan G. & Ulvestad, James S., 2000, AJ, 120, 670
- Rieke & Lebofsky (1985) Rieke, G.H. & Lebofsky, M.J. 1985, ApJ, 288, 618
- Salpeter (1955) Salpeter, E.E., 1955, ApJ, 123, 666
- Skrutskie et al. (2005) Skrutskie, M., et al. 2005, AJ, submitted
- Stetson (1987) Stetson, P.B. 1987, PASP, 99, 191
- Wang et al. (2004) Wang, Z., et al. 2004, ApJS, 154, 193
- Wilson et al. (2000) Wilson, C.D., Scoville, N., Madden, S.C. & Charmandaris, V. 2000, ApJ, 542, 120
- Wilson et al. (2003) Wilson, John C., Eikenberry, Stephen S., Henderson, Charles P., Hayward, Thomas L., Carson, Joseph C., Pirger, Bruce, Barry, Donald J., Brandl, Bernhard R., Houck, James R., Fitzgerald, Gregory J., Stolberg, T. M., 2003, SPIE, 4841, 451
- Whitmore & Schweitzer (1995) Whitmore, Bradley C. & Schweizer, Francois, 1995, AJ, 109, 960
- Whitmore et al. (1999) Whitmore, Bradley C. et al., 1999, AJ, 118, 1551
- Whitmore & Zhang (2002) Whitmore, Bradley C. & Zhang, Qing, 2002, AJ, 124, 1418
- Zezas et al. (2002) Zezas, A., Fabbiano, G., Rots, A.H.& Murray, S.S. 2002, ApJS, 142, 239
- Zhang, Fall & Whitmore (2001) Zhang, Qing, Fall, Michael F., & Whitmore, Bradley C., 2001, ApJ, 561, 727