Abstract
Although it is widely accepted that galaxy interactions stimulate secular evolutionary effects (e.g. enhanced star formation) the amplitude of this effect and the processes for accomplishing them, are not well quantified. The goal of the project AMIGA (Analysis of the Interstellar Medium of Isolated Galaxies) is to provide a sizable reference sample (n=1050) of the most isolated galaxies as a basis for the study of the influence of the environment on galaxy properties. Here, we present the far-infrared (FIR) properties of 1030 galaxies of the sample for which IRAS data are available. We improved the detection rate and accuracy of the IRAS data with respect to the Point Source and Faint Source Catalog by redoing the data reduction with the IPAC utility ADDSCAN/SCANPI. Comparing the FIR to the blue luminosities, we find a slightly non-linear relation. Furthermore, we find that interacting galaxies tend to have an enhanced FIR emission.
[]The far-infrared properties of the most isolated galaxies
1 The AMIGA project
A key question in astrophysics is the relative role of nurture versus nature in galaxy evolution. In order to make progress, studies need to be based on a well-defined sample of isolated galaxy which has been lacking so far. We are compiling and analysing data for the first complete unbiased control sample of the most isolated galaxies in the northern sky (Leon & Verdes-Montenegro 2003, Verdes-Montenegro et al. 2005). To compare and quantify the properties of different phases of the interstellar medium, as well as the level of star formation, we are building a multiwavelength database (far-infrared, near-infrared, optical, H, radio continuum, HI and CO) for this sample. The data will be publicly available from www.iaa.es/AMIGA.html.
Our sample is based on the Catalogue of Isolated Galaxies (CIG, 1050 galaxies, Karatchenseva 1973 ) assembled with the requirement that no similarly sized galaxies with diameter d (where d is between 1/4 and 4 times diameter D of the CIG galaxy) lie within 20d. We chose the CIG as a basis because this sample presents various advantages: (i) It is selected using a powerful criterium, so that the CIG contains a large fraction of the most isolated nearby galaxies in the northern hemisphere. Since the selection criterium does not take into account redshift, it actually excludes some galaxies which have only apparent companions that lie in reality at a very different redshift. This is however not a problem for our purpose because (ii) the sample is large enough to be statistically significant. It furthermore covers a large enough volume to be almost (80%) optically complete up to a Zwicky magnitude of 15 mag (Verdes-Montenegro et al. 2005). (iii) Finally, the fact that the galaxies in the CIG are nearby (the bulk of the galaxies have recession velocities below 10 000 km/s) enables us to determine the morphologies in a reliable way (Sulentic et al. 2006). Since furthermore all morphological types are found in CIG, we are able to study galaxy properties as a function of galaxy type.
As a first step, we are performing a number of refinements to the CIG: a) We are carrying out a computational revision and quantification of the degree of isolation using SExtractor and LMORFO to the POSSI plates (Verley et al. in prep.), b) we are revising the morphologies with the help of POSSII and our optical images (Sulentic et al. 2006), and c) we have checked the positions and accumulated new redshifts available in the literature (Leon & Verdes-Montenegro 2003, Verdes-Montenegro et al. 2005).
2 Reprocesssing of IRAS data
We obtained the IRAS fluxes at 12, 25, 60 and 100 m using the ADDSCAN/SCANPI utility at IPAC. We followed the recommendation for the calculation of the total fluxes and visually inspected all spectra in order to check for (i) the presence of cirrus emission, (ii) confusing with neighboring galaxies and (iii) the significance of the detection (e.g. confusing with noise spikes). A more detailed description of the data processing will be presented in Lisenfeld et al. (in preperation). This reprocessing yielded:
-
•
An increase in the number of data points in comparison to the IRAS Point Source Catalog (PSC) and Faint Source Catalog (FSC): Whereas there are only 524 galaxies of the 1050 CIG galaxies in the PSC/FSC, the ADDSCAN/SCANPI reduction provided data for 1031 objects.
-
•
An improvement of the signal-to-noise-ratio by a factor of 2-5. In particular, (55, 70, 9, 81) galaxies at (12, 25, 60, 100)m were only upper limits in the PSC/FSC but changed to detections after our reprocessing.
-
•
An improved accuracy of the fluxes, because ADDSCAN/SCANPI is able to measure the total flux of extended objects, as long as their size is not above a few arcmin. We found a trend of the ratio of the flux derived with ADDSCAN/SCANPI to the flux from the PSC/FSC to increase with source diameter, especially at short wavelengths, suggesting that the fluxes in the PSC/FSC indeed underestimate the correct fluxes for large object. Furtermore, our visual inspection of the spectra allowed us to reject dubious cases. In fact, we classified (29, 21, 5, 3) galaxies at (12, 25, 60, 100)m as non-detection that were listed as detection in the PSC/FSC.
3 Relation between LFIR and LB
As a first result, we show in Fig. 1 a comparison of the FIR luminosity, LFIR, (calculated from the 60 and 100 m fluxes) to the blue luminosity, LB, derived from the corrected Zwicky magnitudes (see Verdes-Montenegro et al. 2005). A more detailed analysis of the data, including the full presentation of the characteristics of the FIR luminosities and colours will be presented in Lisenfeld et al. (in prepartion). We limit the sample to 736 galaxies with optical magnitudes between 11 and 15 mag, representing an 80% complete subsample of the CIG (Verdes-Montenegro et al. 2005). Furthermore, based on the morphological revision of the sample we exclude 23 galaxies which are judged to be interacting (Sulentic et al. 2006).
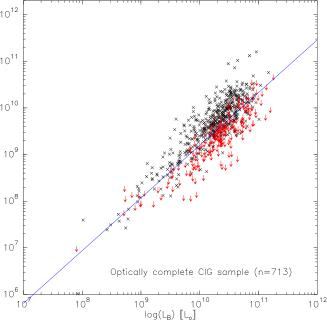
We fit the correlation, taking into account the upper limits by applying survival methods from the package ASURV (Feigelson & Nelson 1985, Isolbe, Feigelson & Nelson 1986) and obtain for the relation (adopting LB as the independent variable).
| (1) |
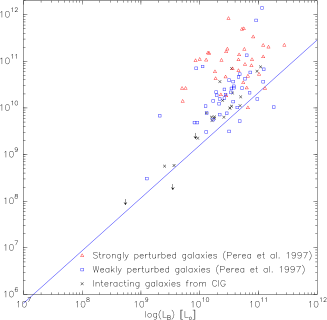
The slope obtained for the sample of the 23 clearly interacting CIGs was considerably higher, 1.46 0.14. The difference is due to an increase in LFIR: Whereas the average LB of both samples are basically the same ( for the 713 CIG galaxies and for the 23 interacting CIG galaxies) the FIR luminosity is increased for the interacting galaxies ( for the 713 CIG galaxies and for the 23 interacting CIG galaxies).
In Fig. 1 (left) we show different samples of interacting galaxies compared to the slope of the CIG (eq. 1). The interacting galaxies clearly lie above this slope, indicating an enhancement of the FIR emission compared to LB.
Acknowledgements.
UL, LVM and SL are partially supported by DGI (Spain) AYA 2002-03338, AYA2004-08251-CO2-02 (UL), the Junta de Andalucía and the Universidad de Granada.¡widest bib entry¿
References
- [Feigelson & Nelson (1985)] Feigelson, E.D., & Nelson, P.I., 1985, ApJ, 293, 192
- [Karatchenseva 1973] Karatchenseva, V.E., 1973, Comm. Spec. Ap. Obs, USSR 8, 1
- [Isobe et al. (1986)] Isobe, T., Feigelson, E.D., Nelson, P. I, 1986, ApJ, 306, 490
- [Leon, S. & Verdes-Montenegro, L. (2003)] Leon, S., Verdes-Montegnegro, L., 2003, A&A, 411, 391
- [Perea et al. 1997] Perea, J., del Olmo, A., Verdes-Montenegro, L., 1997, ApJ, 490, 166
- [Sulentic et al. (2006)] Sulentic, J., Verdes-Montegnegro, L., Bergond, G., et al., 2006, A&A submitted
- [Verdes-Montenegro et al. (2005)] Verdes-Montegnegro, L., Sulentic, J. Lisenfeld, U., et al., 2005, A&A, 436, 443