OUTBURST OF THE X-RAY TRANSIENT SAX J1818.6-1703 DETECTED BY INTEGRAL IN SEPTEMBER 2003
to be published in Astronomy Letters, v. 31, n. 10, pp. 672–680 (2005)
Space Research Institute, Russian Academy of Sciences,
Russia1
Max-Planck-Institut für Astrophysik,
Garching, Germany2
Submitted on May 16, 2005
During the observation of the Galactic-center field by the INTEGRAL observatory on September 9, 2003, the IBIS/ISGRI gamma-ray telescope detected a short (several-hours-long) intense ( mCrab at the peak) outburst of hard radiation from the X-ray transient SAX J1818.6-1703. Previously, this source was observed only once in 1998 during a similar short outburst. We present the results of our localization, spectral and timing analyses of the object and briefly discuss the possible causes of the outburst. The release time of the bulk of the energy in such an outburst is appreciably shorter than the accretion (viscous) time that characterizes the flow of matter through a standard accretion disk.
Keywords: X-ray sources, transients, accretion
∗ E-mail sergei@hea.iki.rssi.ru
INTRODUCTION
The source SAX J1818.6-1703 was discovered by the BeppoSAX observatory on March 11, 1998, during an X-ray outburst that lasted only a few hours (in’t Zand et al. 1998; in’t Zand 2001). The appearance of a new transient near the well-known burster GX 13+1 (at an angular distance of ∘) was recorded by the WFC-2 wide-field X-ray camera at 19h10m (UT). By 20h40m, the photon flux from SAX J1818.6-1703 reached its maximum: mCrab in the range 2–9 keV and mCrab in the range 9–25 keV. The observation was interrupted 3 h later, but the flux was almost halved by this time, indicative of a fast decay of the transient. The source’s position, 18h18m39s, 17∘031 (epoch 2000.0), was determined with an accuracy of 3′. Only one catalogued B3 III star, HD 168078, with is within the error circle (in’t Zand et al. 1998), but there is no additional reasons to believe it to be a real candidate for optical identification with SAX J1818.6-1703.
All that has been known about SAX J1818.6-1703 until recently is listed above. Its nature and, primarily, the mechanism that produced such a short outburst with a duration much shorter than the characteristic time scale for the propagation of disturbances in a standard accretion disk ( days) have remained unclear. In this paper, we present the results of our observations of the second outburst of hard radiation from this source that has allowed us to investigate it in more detail. This flare was detected on September 9, 2003, by the INTEGRAL observatory.
OBSERVATIONS
The INTEGRAL international gamma-ray astrophysics observatory (Winkler et al. 2003) was placed in a high apogee orbit by a PROTON launcher on October 17, 2002 (Eismont et al. 2003). There are four telescopes on its board that allow concurrent X-ray, gamma-ray, and optical observations of cosmic sources. This work is based on the data obtained with the IBIS gamma-ray telescope at energies above 18 keV. Unfortunately, no concurrent observations of SAX J1818.6-1703 were performed in the standard X-ray range (by the JEM-X telescope). Since the source is fairly far from the Galactic center toward which the observatory was pointed, it was not within the field of view of the JEM-X telescope, which is narrower than that of the IBIS telescope.
The IBIS telescope (Ubertini et al. 2003) uses the principle of a coded aperture to image the sky in hard X-rays and gamma-rays in a 30∘30∘ field of view (the fully coded field is 9∘9∘) with an angular resolution of 12′ (FWHM). It is equipped with two position-sensitive detectors: ISGRI (Lebrun et al. 2003) composed of 128128 CdTe semiconductor elements with a high sensitivity in the range 18-200 keV and PICsIT located under it (Labanti et al. 2003) and composed of 6464 scintillators CsI(Tl) with an optimal sensitivity in the range 175 keV – 10 MeV. In this paper, we use only the ISGRI data. The total area of the sensitive elements of this detector is 2620 cm2; the effective area for sources at the center of the field of view is cm2 (half of the detector is shadowed by opaque aperture elements). The detector provides fairly good energy, % (FWHM), and high time, s, resolutions.
Although the outburst of SAX J1818.6-1703 was initially detected using a standard software package for analyzing the INTEGRAL data (at that time, OSA-3.1), all of our results presented in this paper were obtained using the data processing codes developed for the IBIS/ISGRI telescope at the Space Research Institute of the Russian Academy of Sciences. A general description of the procedures used can be found in a paper by Revnivtsev et al. (2004). Application of the latest version of these programs to the observations of the Crab Nebula has shown that the systematic measurement error of the absolute photon flux from the source does not exceed 7%, while the measurement error of the relative fluxes in various spectral channels does not exceed 3%. In our spectral analysis, we used the response matrix of the OSA-4.2 standard package (rmf-file of version 12 and the arf-file of version 6), which proved to be good at fitting the spectra of the Crab Nebula, in particular, the spectra measured in August 2003 immediately before the observations under consideration. The spectrum of the Nebula was assumed to be phot cm-2 s-1 keV-1, where the energy is given in keV. For our study within the framework of the same general approach to analyzing the IBIS/ISGRI data, we developed codes for reconstructing the source’s light curves with a good time resolution.
When the outburst of the transient SAX J1818.6-1703 occurred, the INTEGRAL observatory was performing a long (with a total exposure time of 2 Ms) series of observations of the Galactic-center region. During this series, the IBIS telescope detected 60 hard radiation sources of various intensities (Revnivtsev et al. 2004). Curiously enough, another poorly studied source, AX J1749.1-2733, flared up in this region on September 9, 2003, almost simultaneously with SAX J1818.6-1703. The results of its study are presented elsewhere (Grebenev and Sunyaev 2005). The INTEGRAL observations in this period were performed by successive pointings at points of the Galactic-center field spaced ∘ apart according to the scheme. Depending on the pointing, the exposure efficiency of SAX J1818.6-1703 changed greatly. The duration of each pointing was s.
RESULTS
The appearance of the transient source in the field of view was first recorded at a statistically significant level by the IBIS/ISGRI telescope (at a signal-to-noise ratio of ) during the pointing that began on September 9, 2003, at 00h01m (UT). Analysis of its X-ray image showed that SAX J1818.6-1703 flared up. The measured photon flux from it was mCrab in the range 18–45 keV and mCrab in the range 45–70 keV (the flux of 1 mCrab in these ranges corresponds to radiation fluxes of and erg cm-2 s-1, respectively). The brightness of the source remained the same during the next pointing; subsequently, it faded for 2–3 h111Since the pointings at this time were particularly unfavorable for the source’s observations (it was at the very edge of the field of view), the flux was measured with large errors; nevertheless, the fall in flux appears statistically significant (see Fig. 1)., but flared up again. During the pointings that began at 10h42m and 12h41m, two superintense bursts were detected from the source during which it became the brightest among all of the sources in the field of view. During the first (stronger) burst, the measured photon flux in the above ranges reached and mCrab, respectively. The source remained moderately bright (– mCrab) until 20h, we failed to detect it in several subsequent pointings, the observations were then interrupted, because the satellite entered the Earth’s radiation belts in the final segment of its orbit. During the next orbital cycle (September 10–13), the source was detected only at the telescope’s sensitivity limit () with a mean 18–45-keV flux of mCrab.

The described picture is illustrated by Fig. 1, which shows the source’s light curves constructed from the observations of September 7–13 in two energy ranges. Each point of these curves is the measurement of the photon flux from the source in the corresponding sky image obtained during an individual pointing.
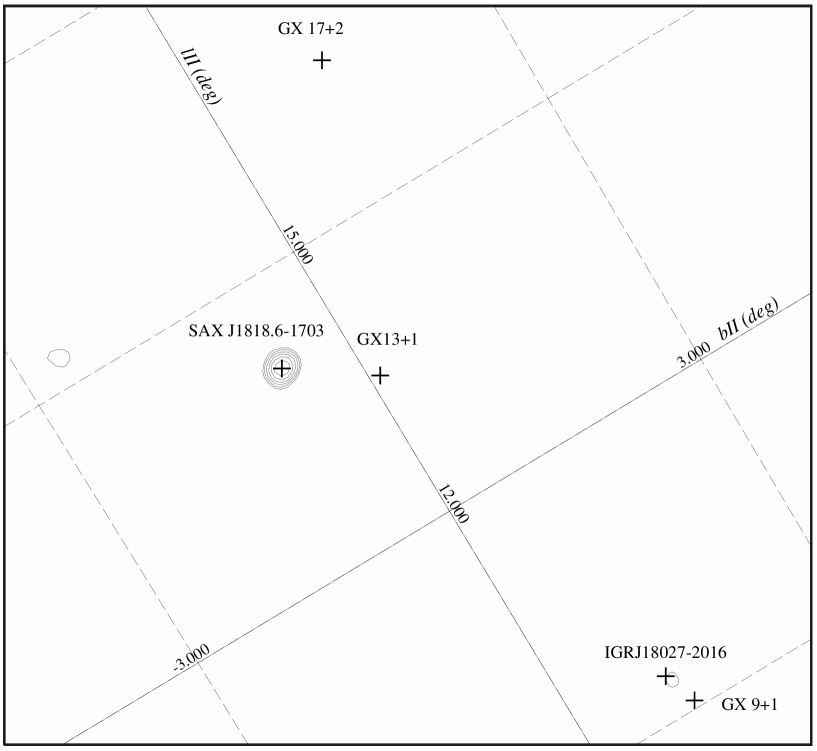
The vertical dashed lines in Fig. 1 indicate the interval of the source’s statistically significant detection. We used this interval to accumulate the integrated images of the sky near SAX J1818.6-1703 (signal-to-noise maps) in the energy ranges 18–45 and 45–70 keV shown in Figs. 2 and 3, respectively. The total exposure time was 75400 s. Apart from SAX J1818.6-1703, four more X-ray sources are seen in Fig. 2: the bursters GX 17+2 and GX 13+1, the “atoll” source GX 9+1, and the X-ray pulsar IGR J18027-2016 (also known as SAX J1802.7-2017). SAX J1818.6-1703 is the brightest of these sources — it was detected at a signal-to-noise ratio of , while the next brightest source GX 9+1 has . In Fig. 3, SAX J1818.6-1703 is the only source (it is seen at ). Estimates indicate that this is attributable not just to the natural decrease in the hard X-ray photon flux typical of all sources; the flux from SAX J1818.6-1703 falls in this case more slowly, i.e., the source has a much harder (with the possible exception of the X-ray pulsar IGR J18027-2016) spectrum.
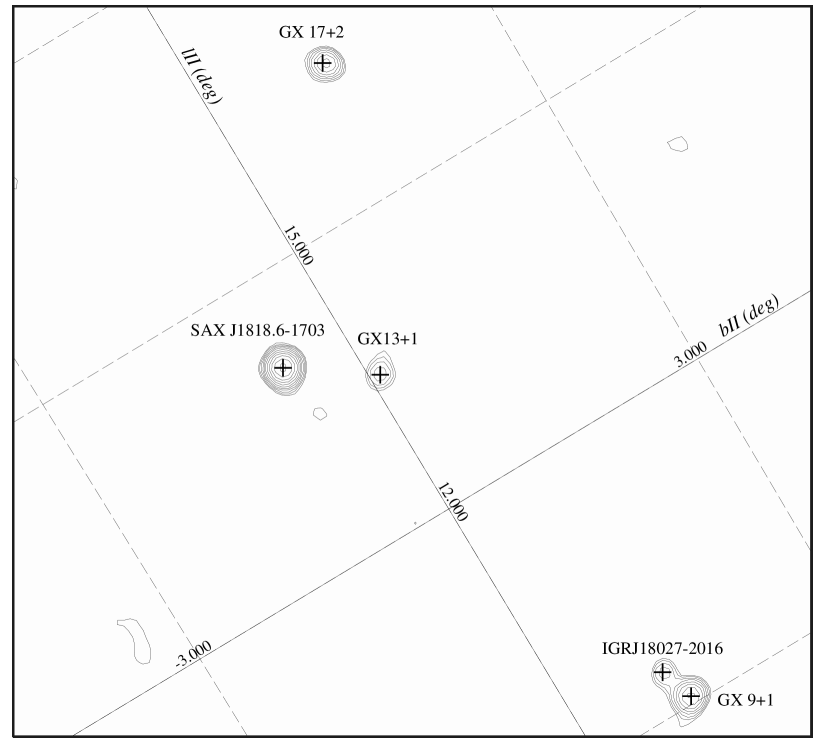
The image shown in Fig. 2 was used to improve the localization of the source. The position found, h18m38 2, 17∘03′11′′ (epoch 2000.0, 1.5′ uncertainty), coincided with its position measured by BeppoSAX in 1998 to within 12′′.
The Outburst Time Profile
To elucidate the nature of the source’s outburst, it is crucially important to analyze the structure of the two intense short bursts occurred at about 11 and 13 h. Since the light curve in Fig. 1 does not allow this to be done, we reconstructed more detailed light curves. The top panel in Fig. 4 shows the 18–45-keV light curve with a time resolution (bin size) of 500 s. It spans only the source’s activity period. The actually measured count rate, i.e., the count rate corrected for the dead time and other instrumental effects, but uncorrected for the variations in the effective (source-irradiated) area of the detector due to the change in the INTEGRAL pointing, is along the Y axis. This effect is important, since the source was outside the fully coded field of view of the telescope. We do not make the corresponding correction in order not to overload the figure. At the time resolution used, statistically insignificant spikes appear in the corrected light curve due to the Poissonian fluctuations of the count rate when the source approaches the edge of the field of view. Instead, the bottom panel in Fig. 4 shows the curve of variations in the effective area of the detector. We clearly see its correlation with the count rate, which, however, does not distort severely the main event. The effective area for the observation of SAX J1818.6-1703 was only 620 cm2 even at maximum, i.e., it was almost a factor of smaller than the area typical of the sources in the fully coded field of view. For such an effective area, 1 count/s corresponded to a flux of mCrab in the energy range under consideration, so, according to this figure, the maximum flux from the source reached mCrab.


The figure suggests that the two bursts of the main outburst event have a fairly complex time profile. A narrow (10–20 min) precursor peak and a broader (1.5–2 h) main peak can be distinguished in each of them. The amplitude of the precursor peak in the first burst is almost twice that of the main peak, while the precursor peak in the second burst is appreciably smaller. In general, the two bursts resemble ordinary type-I X-ray bursts with photospheric expansion, i.e., bursts produced by a thermonuclear explosion on the neutron star surface at which the photospheric luminosity reached the Eddington limit (see Lewin et al. 1993). However, the duration of the bursts from SAX J1818.6-1703 was 2–3 h, which is much longer than the duration of ordinary X-ray bursts. The recently discovered superbursts (Kuulkers et al. 2002; in’t Zand et al. 2004) have comparable durations, but exhibit completely different time profiles — a very fast rise and a long exponential decay. As we will see below, there are also more fundamental differences between these bursts.
Figure 5 shows the time profiles of the main event in several energy ranges after their reduction to the effective area of 620 cm2. In general, they are similar in structure, suggesting that the spectral shape of the source changed little during the outburst. However, note a clear decrease with energy in the relative amplitude of the precursor peak in the first burst and a probable decrease in the amplitude of the precursor peak in the second burst. These changes were confirmed during a detailed spectral analysis.
The Radiation Spectrum
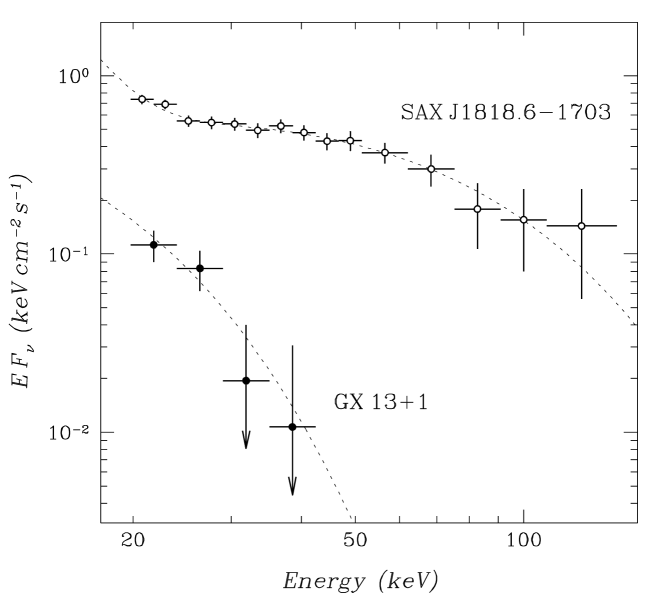
Figure 6 shows the average spectrum of SAX J1818.6-1703, obtained in the period of its activity (during the interval bounded by the vertical dashed lines in Figs. 1 and 4). The source’s radiation is recorded up to keV, with an exponential cutoff being observed at energies above 70 keV. Note that an additional soft ( keV) radiation component is present in the spectrum. The energy characteristics of the source’s radiation in this period, its mean luminosity and energy release calculated by assuming that SAX J1818.6-1703 is actually near the Galactic center, at a distance of kpc222For the source GX 13+1 closest to SAX J1818.6-1703 kpc (Bandyopadhyay et al. 1999)., are given in Table 1.
Table 1. Parameters of the outburst of
SAX J1818.6-1703
observed with IBIS/ISGRI on September 9, 2003.
| Interval | Parameter | Value |
|---|---|---|
| Entire activity | 22.5 h | |
| period | ||
| Main event | 2.7 h | |
| Duration , luminosity , and energy release | ||
| in the range 20–200 keV for an assumed distance of 8 kpc | ||
| Bounded by the vertical dashed lines in Fig. 1 | ||
| The sum of intervals A, B, C marked in Fig. 5 | ||
Table 2 summarizes the results of fitting the spectrum by simple analytical models: a power law (PL), a power law with an exponetial high energy cutoff (PE), the radiation formed through Comptonization of low energy photons in a cloud of high temperature plasma (ST, Sunyaev and Titarchuk 1980), the bremsstrahlung of an optically thin thermal plasma (TB), the bremsstrahlung with an additional soft blackbody component (TB+BB), and the Comptonization radiation with an additional blackbody component (ST+BB). We see that even the single-component PL, PE, and ST models describe satisfactorily the radiation spectrum. Although the introduction of an additional soft radiation component affects only the first two or three points of the spectrum, this leads to further significant improvement of its approximation. Extrapolating the soft component to the X-ray energy range we get a luminosity an order of magnitude higher than that in the hard energy range. Thus, the overall energetics of the source could be maintained at a level approaching the critical Eddington level for accretion onto a neutron star (or, given the uncertainty in the spectral shape of the soft component, even onto a black hole of a small mass).
Table 2. Results of the best-fit approximation of the
spectrum
of SAX J1818.6-1703, averaged over
the entire period of its activity.
| Model | |||||
|---|---|---|---|---|---|
| keV | keV | ||||
| PL | 1.02 (22) | ||||
| PE | 1.02 (21) | ||||
| ST | 1.02 (21) | ||||
| TB | 1.37 (22) | ||||
| TB+BB | 0.75 (20) | ||||
| ST+BB | 0.78 (20) | ||||
| The notation of the models is given in the text. | |||||
| The photon index. | |||||
| Parameters of the soft radiation component: the blackbody | |||||
| temperature and bolometric luminosity (for kpc). | |||||
| The value of the best fit normalized to ( is the number | |||||
| of degrees of freedom). | |||||
| A fixed parameter. | |||||
Table 3. Results of the best-fit approximation of the
spectrum
of SAX J1818.6-1703 at various evolutionary phases of
the outburst
| Spectrum | Model | ||||
| keV | |||||
| A | PL | 1.03 (23) | |||
| TB | 0.83 (23) | ||||
| B | PL | 1.25 (23) | |||
| TB | 0.96 (23) | ||||
| C | PL | 1.76 (23) | |||
| TB | 1.04 (23) | ||||
| D | PL | 0.83 (23) | |||
| TB | 1.23 (23) | ||||
| The photon index | |||||
| The 20–200-keV luminosity for an assumed distance of kpc | |||||
| The value of the best fit normalized to ( is the number | |||||
| of degrees of freedom) | |||||
Figure 7 shows the spectral evolution of SAX J1818.6-1703 during the outburst under discussion. Spectra A, B, and C were measured by the IBIS/ISGRI telescope at different evolutionary phases of the main event (the time intervals corresponding to these phases are indicated in the upper panel of Fig. 5). Spectrum D was measured during the remaining activity period of the source. The solid lines indicate the best fit to spectrum A by the bremsstrahlung law of an optically thin thermal plasma ( keV). The soft component, which is absent in the main radiation of the bursts (spectra B and C), is clearly seen at energies below keV in the spectra of the precursor peak in the first burst (spectrum A) and the period of moderate activity of the source (spectrum D), as well as in the average spectrum of the source. The results of fitting the presented spectra by a power law (PL) and the bremsstrahlung law of an optically thin thermal plasma (TB) are given in Table 3. We see that in the period of moderate activity, the source had a rather soft radiation spectrum (with a photon index of ); at the onset of the main event, the spectral hardness increased () and continued to increase, reaching in the second burst.

DISCUSSION
Transients like SAX J1818.6-1703 form a special, fairly representative population among the X-ray sources discovered or recorded during their outbursts by the INTEGRAL observatory (e.g., IGR J17544-2619, XTE J1739-302, and others). Their distinctive feature is a very short (several hours) lifetime and a long recurrence period (several years). Only a few such transients (including SAX J1818.6-1703) were observed in previous experiments.
The activity of these sources could in principle be caused by the following: (1) thermonuclear explosions on the neutron star surface, (2) magnetic energy release in the case of a neutron star with a very strong magnetic field, and (3) unsteady accretion onto a neutron star or a black hole in a binary system. The first two possibilities seem unlikely, since the life time of such transients is much longer than the duration of both soft gamma-ray bursts from gamma-repeaters (magnetars) and ordinary X-ray bursts from neutron stars with a weak magnetic field (bursters). Our results show that the bursts of SAX J1818.6-1703 also differ greatly from the superbursts discovered recently from bursters (Kuulkers et al. 2002; in’t Zand et al. 2004) primarily by an increase in the hardness during the burst and by the burst profile. Note that the energy released during the main outburst event of SAX J1818.6-1703 accounted for only of the total energy released in the period of its activity (Table 1). This is also difficult to explain in terms of a thermonuclear explosion on the neutron star surface without invoking unsteady accretion processes.
On the other hand, the lifetime of such outbursts is much shorter than the accretion (viscous) time that characterizes the propagation of disturbances in a standard accretion disk,
(Shakura and Sunyaev 1973)333In fact, for the disk filling the Roche lobe depends on only weakly because (but depends on the orbital period of the binary and the value cm corresponds to very short periods).. Here, is the outer radius of the disk, is the disk half-thickness at this radius, is the Keplerian frequency, is the mass of the compact object, and is the viscosity parameter. We disregarded the weak -dependence of on the right-hand side of this expression (in the standard disk accretion model, ) and set , which corresponds to the most compact binaries with cm (for a discussion, see Gilfanov and Arefiev 2005). We can decrease by increasing (advection-dominated regime), but this will cause the accretion efficiency to decrease appreciably. At an accretion efficiency of typical of black holes or compact neutron stars (, where is the radius of the neutron star surface, and is its gravitational radius), a compact object would accrete of matter for the energy release to be (Table 1). The other possibility to decrease appears in the case of unsteady accretion from the stellar wind. In this case the radius of the forming disk may be much smaller than the size of the binary.
The mechanisms responsible for the outbursts of such transients can be considered in detail only after their reliable optical identification. At present, this has not yet been done.
This work is based on the observational data obtained by the INTEGRAL observatory, an ESA satellite with instruments provided by ESA member states (especially France, Italy, Germany, Switzerland, Denmark, and Spain), the Chezh Republic, and Poland, placed in orbit by Russia and operated by the ESA with the participation of the USA, and provided via the Russian and European INTEGRAL Science Data Centers. We used some of the codes developed by E.M.Churazov to analyze the data. This study was supported by the Russian Foundation for Basic Research (project no. 05-02-17454), the Presidium of the Russian Academy of Sciences (the “Nonstationary Phenomena in Astronomy” Program), and the Program of the Russian President for Support of Leading Scientific Schools (project no. NSh-2083.2003.2).
REFERENCES
1. R.M. Bandyopadhyay, T. Shahbaz, P.A. Charles, T. Naylor, Mon. Not. Roy. Astron. Soc. 306, 417 (1999).
2. N.A. Eismont, A.V. Ditrikh, G. Janin, et al., Astron. Astrophys. 411, L37 (2003).
3. M. Gilfanov, V. Arefiev, Mon. Not. Roy. Astron. Soc., in press (2005).
4. S.A.Grebenev, R.A.Sunyaev, Astron. Lett. 31, in press (2005).
5. J. in’t Zand, in Proc. of the 4th INTEGRAL Workshop “Exploring the gamma-ray Universe” (eds.: B. Battrick, A. Gimenez, V. Reglero, C. Winkler), ESA SP-459, Noordwijk, 2001, 463.
6. J. in’t Zand, J. Heise, M. Smith, et al., IAU Circ. 6840 (1998).
7. J.J.M. in’t Zand, R. Cornelisse, A. Cumming, Astron. Astrophys. 426, 257 (2004).
8. E. Kuulkers, J.J.M. in’t Zand, M.H. van Kerkwijk, et al., Astron. Astrophys. 382, 503 (2002).
9. C. Labanti, G. Di Cocco, G. Ferro, et al., Astron. Astrophys. 411, L149 (2003).
10. F. Lebrun, J.P. Leray, P. Lavocat, et al., Astron. Astrophys. 411, L141 (2003).
11. W.H.G. Lewin, J. van Paradijs, R.E. Taam, Space Sci. Rev. 62, 223 (1993).
12. M.G.Revnivtsev, R.A.Sunyaev, D.A.Varshalovich, et al., Astron. Lett. 30, 430 (2004).
13. N.I. Shakura, R.A. Sunyaev, Astron. Astrophys. 24, 337 (1973).
14. R.A. Sunyaev, L.G. Titarchuk, Astron. Astrophys. 86, 121 (1980).
15. P. Ubertini, F. Lebrun, G. Di Cocco, et al., Astron. Astrophys. 411, L131 (2003).
16. C. Winkler, T.J.-L. Courvoisier, G. Di Cocco et al., Astron. Astrophys. 411, L1 (2003).