Most supermassive black hole growth is obscured by dust
Abstract
We present an alternative method to X-ray surveys for hunting down the high-redshift type-2 quasar population, using Spitzer and VLA data on the Spitzer First Look Survey. By demanding objects to be bright at 24 m but faint at 3.6 m, and combining this with a radio criterion, we find 21 type-2 radio-quiet quasar candidates at the epoch at which the quasar activity peaked. Optical spectroscopy with the WHT confirmed 10 of these objects to be type-2s with while the rest are blank. There is no evidence for contamination in our sample, and we postulate that our 11 blank-spectrum candidates are obscured by kpc-scale dust as opposed to dust from a torus around the accretion disk. By carefully modelling our selection criteria, we conclude that, at high redshift, 50-80% of the supermassive black hole growth is obscured by dust.
keywords:
galaxies:active - galaxies:nuclei - quasars:generalams@astro.ox.ac.uk
1 Introduction
Periods of exponential growth of supermassive black holes are observed as quasars in the distant Universe. These quasars, however, are only seen to outshine their host galaxy if the geometry of the dusty torus surrounding the accretion disk is at a favourable angle (Antonucci 1993). These are known as type-1 quasars, which show a spatially-unresolved “blue bump” in the UV-optical wavebands, as well as broad emission lines. The activity of such type-1 quasars is known to increase with lookback time, and seems to have peaked around (Wolf et al. 2003). However, the understanding of the obscured quasar population (known as type-2 quasars) is far less complete, and it is not known how much growth occurs in obscured regions.
One of the problems in understanding the amount of obscured growth is that there are several discrepancies in the ratio of type-2 to type-1 quasars, depending on the wavelength at which these are observed.
-
•
Unified schemes, where type-1 and type-2 objects are the same intrinsically but viewed at a different orientation with respect to the torus, predict type-2 to type-1 ratios , for a half-opening angle of . Studies of radio-loud AGN are consistent with this picture (Willott et al. 2000).
-
•
The summed emission from quasars generates the cosmic X-ray background, and modelling of this background is consistent with a population of type-2 quasars that outnumber the type-1s by 3:1 (Worsley et al. 2004).
-
•
Deep X-ray surveys are sensitive to intrinsically faint AGN down to the Seyfert regime and have found an obscured population but this population is not large enough to account for the unresolved X-ray background (Zheng et al. 2004; Barger et al. 2005).
Possible explanations for these discrepancies include a number of Compton thick quasars (e.g. Alexander et al. 2005), which are invisible even to deep X-ray surveys, and another type of optical obscuration unrelated to the torus. With objects such as IRAS F10214 in mind (Rowan-Robinson et al. 1991), and following the success of mid-infrared selection at lower redshift (Lacy et al. 2004; 2005a), we devised an alternative method for looking for radio-quiet type-2 quasars at the peak of the quasar activity (). In order to be able to compare this population to the type-1 quasars, we used well defined selection criteria.
2 Selection Criteria
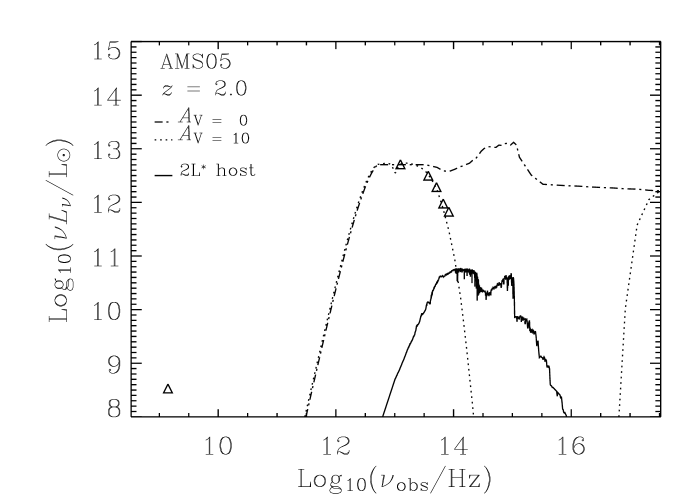
Our first step in choosing a method of hunting for the elusive high redshift type-2 population is to consider the effects of dust on the spectral energy distribution (SED) of a type-1 quasar. Figure 1 shows the X-ray to far-infrared SED for two quasars, one with (a type-1) and another with (a moderate extinction for a type-2). We see that the effect of dust is negligible at (observed) far- to mid-infrared, but suddenly becomes very severe in the mid- to near-infrared. The far- to mid- infrared SED of a type-1 and type-2 are thus almost identical, while the type-2 quasar SED will be dominated by the host galaxy at near-infrared to UV wavelenghts. With this in mind, we used the 1.4 GHz, 24-m and 3.6-m data from the Spitzer First Look Survey (Condon et al. 2003; Marleau et al. 2004; Lacy et al. 2005b; Fadda et al. in prep.) and the following selection criteria (Martínez-Sansigre et al. 2005):
-
1.
Jy
-
2.
Jy
-
3.
mJy
The mid-infrared criterion Jy was chosen to select quasars below the “break” in the luminosity function at . The peak of the quasar activity occurred at this redshift and by targeting the quasars around the “break” we would be sensitive to the dominant part of the population. At , the break in the quasar luminosity function, , corresponds to (Croom et al. 2004, with Pure Luminosity Evolution), so assuming a typical quasar SED (Rowan-Robinson 1995) our 24- selection will select quasars just below the break in the luminosity function () at , and more luminous quasars at higher redshifts.
Quasars are normally considered as being type-2 if they have an (Simpson et al. 1999) which will make their observed near-infrared emission much fainter than that of type-1s. The 3.6- criterion was therefore chosen to remove naked (type-1) quasars as well as lower redshift () type-2s. Dust extinction ensures that type-2 quasars are much fainter than type-1 quasars, even for a moderate . Indeed, the emission (rest-frame 1-2 m) is likely to be dominated by starlight for , and since light at 3.6-m is dominated by the old stellar population, there will be an correlation, analogous to the relation for radio galaxies (Willott et al. 2003). Assuming that host galaxies for radio-quiet quasars have a luminosity of (Kukula et al. 2001), we adapt the relation to hosts at 3.6-m. This criterion corresponds to a limiting ‘photometric redshift’ . This was chosen to target type-2 quasars, while allowing for scatter in the photometric redshift estimation and filtering out type-1 quasars and low-redshift contaminants like radio galaxies. The infrared selection criteria are plotted schematically in Figure 2.
The radio selection criteria is added to ensure that the candidates are radio-quiet quasars rather than starburst galaxies. The 3.6-m - 24-m “colour” we are demanding can be achieved by lower redshift () ULIRGs. To avoid such starburst contaminants, we chose a lower limit on well above the level reached by high-redshift starburst galaxies (Chapman et al. 2005) as well as an upper limit to filter out the radio-loud objects, whose extended jets might complicate interpretation. We do not demand a detection at 3.6-m, allowing for very high-redshift objects. In addition, the FLS radio positions (Condon et al. 2003), accurate to arcsec, were better for spectrosocopic follow-up than the 24-m positions.

3 Observational Results
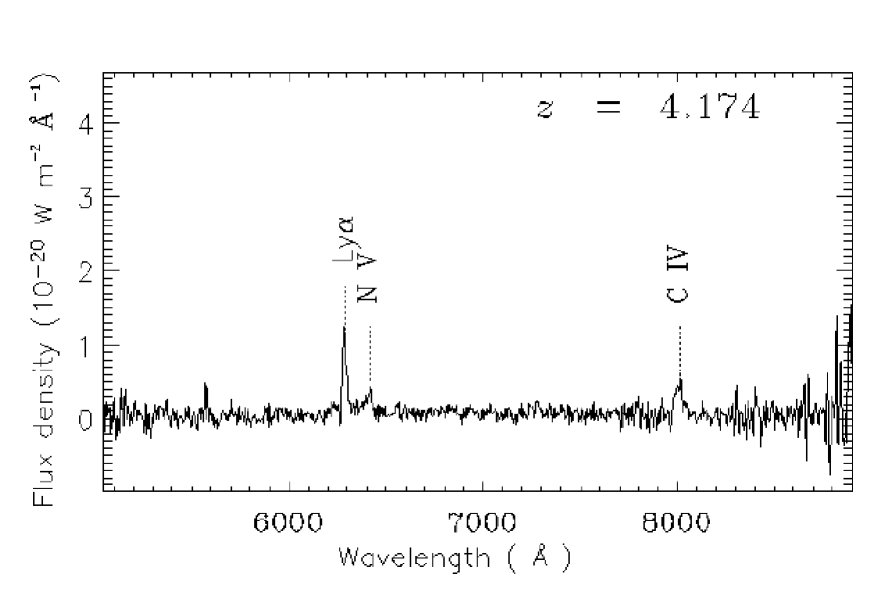
These selection criteria led to 21 candidate type-2 radio-quiet quasars in the 3.8 square degrees of the Spitzer First Look Region that have coverage with all three wavebands. To obtain optical spectra, the 21 candidates were looked at for minutes each with the ISIS instrument at the WHT. This yielded 10 spectroscopic redshifts in the range , 10 blank spectra and one with faint red continuum. The spectrum of the highest redshift object is shown in Figure 3. All the objects with redshifts showed narrow emission lines and no type-1 quasar or lower redshift starbursts were found to contaminate the sample (Martínez-Sansigre et al. 2005; Martínez-Sansigre et al. in prep.). In the remainder of this paper we will refer to the candidates with spectroscopic redshifts as narrow-lined objects, and the rest as blank objects.
Eight of the objects showed narrow Lyman- with equivalent width , and several objects showed higher-excitation lines. The object with faint red continuum is probably a type-2 with so that Lyman- is not visible in the optical, and has no other lines bright enough to be detected. There is therefore no evidence for contamination in our sample.
4 Modelling the Population
To place our results in context, we modelled the expected number of type-1 quasars with which would meet our 24 m and 1.4 GHz selection criteria. We used a type-1 luminosity function (LF) from the COMBO-17 survey (Wolf et al. 2003) and a model SED (Rowan-Robinson 1995) to convert between rest-frame B-band luminosity and observed 24 m flux density. To model the radio selection, we used an optical-to-radio correlation with scatter (Cirasuolo et al. 2003). From this modelling, we would expect type-1 quasars at matching our mid-infrared and radio criteria. This number is small mainly due to the radio cut: we are looking at the radio-bright end of the radio-quiet quasar population. Without the radio criterion we would expect type-1 quasars.
Using a Bayesian approach, we produced probability distributions for the quasar fraction at , given our data and assuming 4.3 type-1 quasars (where is the fraction of type-1 quasars over the total number of type-1 and type-2 quasars). Two such distributions were calculated (Figure 4): one where only the spectroscopically confirmed type-2s with were included (5 type-2s) and one were the photometric redshifts were used for the objects with no spectroscopic redshift (for a total of 11 type-2s with ).
If we only take the redshift of the objects with lines in the spectra, then the quasar fraction, is consistent with and the type-2 to type-1 ratio is 1:1. The probability distribution peaks at when the photometric redshifts are used to fill in, resulting in a type-2 to type-1 ratio 3:1.
Figure 4 also includes the predicted for two receding-torus models (Simpson 1998; 2005). These are consistent with the quasar fraction from narrow-line objects at the 1 level, and with from both narrow-line and blank objects at the 2 level.
5 Discussion
We have found two possible values for the quasar fraction, . The spectroscopic redshifts are, on average, consistent with the photometric redshifts, indicating that the host galaxies of the narrow-line objects are consistent with progenitors of present-day elliptical galaxies. The narrow line objects are therefore hosted by relatively dust-free (and hence transparent) galaxies so we can see the narrow line region. The quasars in the narrow-line objects are therefore obscured by the torus around the accretion disk. The ratio of narrow-line type-2 to type-1 is consistent with this torus picture. Type-1 quasars must also be hosted by relatively transparent galaxies (i.e. ellipticals, Kukula et al. 2001), so we find that the quasar fraction in high-redshift elliptical galaxies is consistent with as expected from unified schemes.
The blank objects, however, are almost certainly also in the redshift range . Our photometric redshifts are reliable on average, and there is no hint of contamination by type-1s or lower-redshift starbursts (which would show the [OII] 3727 Å line in the red end of the spectra or at least some bright continuum). We are therefore confident that the blank objects are also high redshift type-2s but the quasar is probably obscured by some dust on scales large enough to obscure the narrow-line region as well as the broad-line region. Such kpc-scale dust is characteristic of starbursts, and we could therefore be seeing supermassive black holes growing inside starbursting galaxies (Fabian 1999). The orientation of the torus would therefore become irrelevant for the blank objects, as the obscuring dust would be distributed along the entire host galaxy.

This would explain why the ratio of narrow-line (‘host-obscured’) type-2s to type-1s is 1:1, while the total ratio of type-2s (‘host-obscured’ and ‘torus-obscured’) to type-1s would be 3:1, consistent with the X-ray background (Worsley et al. 2004). Unified schemes can only be tested in relatively transparent galaxies, where the obscuration is due to orientation, so the receding-torus models (Simpson 1998; 2005) must only be compared to the curve that uses the narrow-line objects and they are consistent. However, for the X-ray background the location of the obscuring material is irrelevant: at high-redshift there are times more obscured quasars than unobscured. Hence, 50-80% of the accretion at is obscured by dust . Since this is the peak of the quasar activity and since at lower redshifts, most AGN are obscured (from X-ray studies: Barger et al. 2005), we can conclude that most supermassive black hole growth is obscured by dust (Martínez-Sansigre et al. 2005).
Acknowledgements.
AMS, SR, ML, CS and MJJ would like to thank the organisers of the conference: Montse, Rosa, Enrique and Jose Luis for their kind hospitality. AMS would also like to thank the Council of the European Union for funding, and the Ministerio de Educación y Ciencia for financial support for this conference. SR and CS would like to thank the UK PPARC for a Senior Research Fellowship and an Advanced Fellowship respectively.References
- [1] Alexander D.M., et al.: 2005, MNRAS, 357, L16
- [2] Antonucci, R.: 1993, ARA&A, 31, 473
- [3] Barger, A.J., et al.: 2005, AJ, 129, 578
- [4] Bruzual, G., Charlot, S.: 2003, MNRAS, 344, 1000
- [5] Chapman, S.C., et al.: 2005, ApJ, 622, 772
- [6] Cirasuolo, M., et al.: 2003, MNRAS, 346, 447
- [7] Condon, J.J., et al.: 2003, AJ, 125, 2411
- [8] Croom, S.M., et al.: 2004, MNRAS, 349, 1397
- [9] Fabian, A.C.: 1999, MNRAS, 308, L39
- [10] Kukula, M.J., et al.: 2001, MNRAS, 326, 1533
- [11] Lacy, M., et al.: 2004, ApJS, 154, 166
- [12] Lacy, M., et al.: 2005a, Memorie della Societa Astronomica Italiana, 76, 154
- [13] Lacy, M., et al.: 2005b, ApJS in press, astro-ph/0507143
- [14] Marleau, F.R., et al.: 2004, ApJS, 154, 66
- [15] Martínez-Sansigre et al.: 2005, Nat, 436, 666
- [16] Pei, Y.C.: 1992, ApJ, 395, 130
- [17] Rowan-Robinson, M., et al.: Nat, 351, 719
- [18] Rowan-Robinson, M.: 1995, MNRAS, 272, 737
- [19] Simpson, C.: 1998, MNRAS, 297, L39
- [20] Simpson, C., Rawlings, S., Lacy, M.: 1999, MNRAS, 306, 828
- [21] Simpson, C.: 2005, MNRAS, 360, 565
- [22] Willott, C.J., et al.: 2000, MNRAS, 316, 449
- [23] Willott, C.J., et al.: 2003, MNRAS, 339, 173
- [24] Wolf, C., et al.: 2003, A&A, 408, 499
- [25] Worsley, M.A., et al.: 2004, MNRAS, 352, L28
- [26] Zheng, W., et al.: 2004, ApJS, 155, 73