Open clusters in the Third Galactic Quadrant. II.
The intermediate age open clusters NGC 2425 and NGC 2635
††thanks: Based on observations collected at CTIO and ESO
††thanks: Tables 2 and 3 are only available in electronic form at the CDS via
anonymous ftp to cdsarc.u-strasbg.fr (130.79.128.5) or via
http://cdsweb.u-strasbg.fr/cgi-bin/qcat?J/A+A//
We analyse CCD broad band () photometric data obtained in the fields of the poorly studied open clusters NGC~2425 and NGC~2635. Both clusters are found to be of intermediate age thus increasing the population of open clusters known to be of the age of, or older than, the Hyades. More explicitly, we find that NGC~2425 is a 2.2 Gyr old cluster, probably of solar metallicity, located at 3.5 kpc from the Sun. NGC~2635 is a Hyades age (600 Myr) cluster located at a distance of 4.0 kpc from the Sun. Its Colour Magnitude Diagram reveals that it is extremely metal poor for its age and position, thus making it a very interesting object in the context of Galactic Disk chemical evolution models.
Key Words.:
Galaxy: open clusters and associations: individual: NGC~2425 – open clusters and associations: individual: NGC~26351 Introduction
This paper is part of a series motivated by the need for a homogeneous set of open cluster distances and ages to investigate the structure and development of the Milky Way’s disk in the third Galactic quadrant. We are interested in the interplay between spatial structure and the star formation history in the Canis Major-Puppis-Vela region of the Galaxy. The other primary goals are to recover possible extensions of the Perseus and Norma-Cygnus arms toward the third Galactic quadrant and to understand the chemical evolution of this poorly-known region.
In Moitinho (2001, hereafter Paper I) we presented a photometric database obtained from a CCD survey of 30 open clusters in the Galactic longitude range . The data presented in Paper I were obtained using a single instrumental setup (telescope, CCD and filters) and were reduced in the same way, resulting in a homogeneous photometric database of approximately 65 000 stars.
Previous papers by our group (Baume et al. 2004; Giorgi et al. 2005; Carraro et al. 2005a, and references therein) reported results on other clusters in this region, namely NGC~2588, NGC~2580, NGC~2571, Pismis~8, Pismis~13, Pismis~15, Ruprecht~4 and Ruprecht~7.
We now present the first detailed study of the open clusters NGC~2425 (=C0736-147) and NGC~2635 (=C0836-345 =Melotte 89 =Collinder 190 =ESO371-01). Photometric diagrams are analysed and reddenings, distances and ages are derived, as well as photometric estimates of the clusters’ metallicities. To the best of our knowledge, only NGC~2635 has been previously studied by Vogt & Moffat (1972) who obtained UBV photoelectric photometry for 6 stars. However, their analysis led them to suggest that there is no cluster in the direction of NGC~2635.
In Sect. 2, we introduce the observational material used in this study. Sect. 3 is devoted to refining the present estimates of the clusters’ central coordinates and radii. The photometric analysis is shown in Sect. 4, where the methods used in the determination of the clusters’ fundamental parameters are also described. Finally, Sect. 5 summarises our main results and adds some concluding remarks.
| NGC~2425 | 07:38:19.9 | -14:53:15.4 | ||
| NGC~2635 | 08:38:27.9 | -34:46:40.6 |
2 Data set
2.1 Optical data
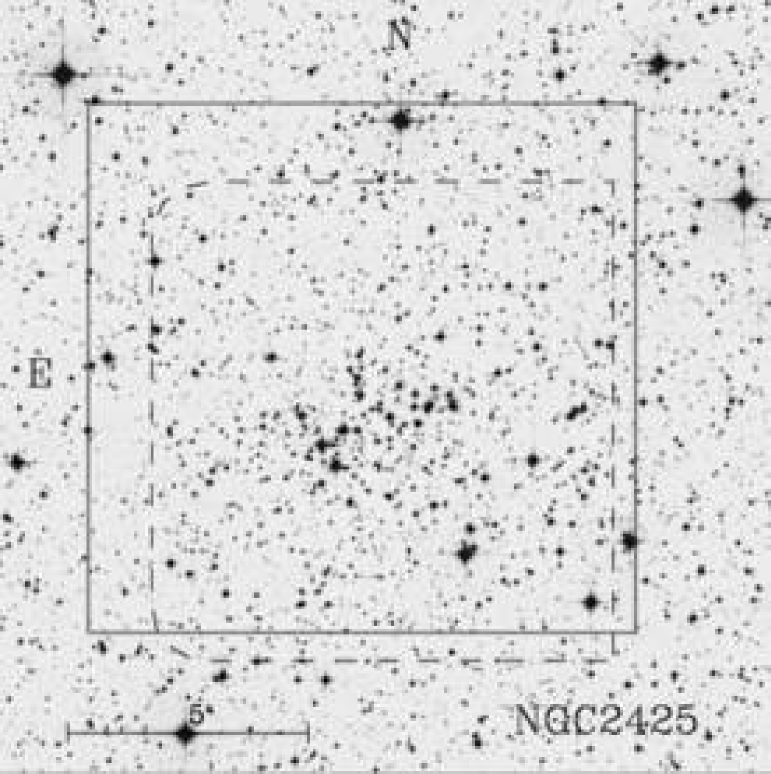
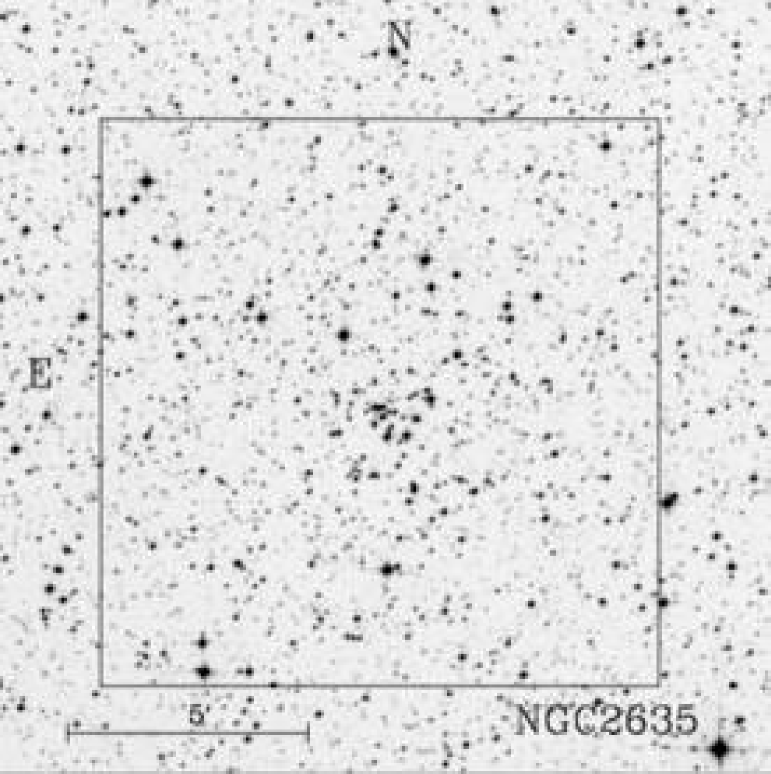
CCD images of NGC~2425 and NGC~2635 were acquired with the CTIO 0.9m telescope during a run in January 1998. Observations, reductions, error analysis and comparison with other photometries are thoroughly described in Paper I. Further CCD images were obtained for NGC~2425 at ESO - La Silla - with the EMMI camera mounted on NTT on the night of December 9, 2002. The typical seeing was about . The camera has a mosaic of two pixels CCDs which samples a field. The images were binned , which resulted in a plate scale of /pix. Details on the reductions of these data are given in Baume et al. (2004). The fields covered by CTIO and ESO observations are shown in Figs. 1 and 2.
Combining both data sets required a detailed comparison of their plate scales and photometric scales. While matching the X,Y pixel coordinates from both sets, we noticed that no one-to-one correspondence could be satisfactorily achieved through a simple linear transformation. Indeed, the residuals of the transformation displayed a jump in the middle of the NTT X axis. This is likely due to the junction between the two CCDs that compose the EMMI camera. Taking this effect into account, the NTT coordinates were transformed without trouble to the system of the CTIO X,Y positions and sources from both sets were cross-identified. The rms residuals of the transformations were around 0.15 CTIO pixels (1 CTIO pixel ).
The NTT measurements were then linked to the CTIO photometry through linear transformations of the form ; , using stars with estimated errors of less than 0.015 mag, which corresponds to mag. The rms of the photometric transformations were mag. Both photometries were then combined by averaging the measurements weighted by their errors. The errors in the CTIO magnitudes are described in Paper I, and are taken to be the dispersion of the measurements when repeated observations were available, or the errors output by ALLSTAR in the case of single measurements. For the NTT magnitudes the adopted errors were those given by ALLSTAR.
2.2 Infrared data and astrometry
Equatorial coordinates were computed for each star by applying linear transformations, determined for each cluster field, to the CCD X,Y positions. The transformations were determined in two steps: First, matched lists of X, Y and RA, DEC were built by visually identifying about 20-30 TYCHO-2 (Høg et al. 2000) and 2MASS stars in each cluster field. These lists were used in obtaining transformations that yielded preliminary equatorial coordinates for all measured stars. The second step was to cross-identify all our sources in common with the same catalogues by matching the preliminary coordinates to the catalogued ones using a computer program. This resulted in extended lists of stars which were used in computing the final transformations. The RMS of the residuals were , which is about the astrometric precision of the 2MASS catalogue, (Cutri et al. 2003), as expected since most of the coordinates were retrieved from this catalogue.
Cross-identification of our stars with 2MASS point sources allowed us to build a catalogue of photometry which constitutes the main observational base used in this study. The photometric data for NGC~2425 and NGC~2635 are given in tables 2 and 3, respectively. These tables include X,Y CCD coordinates; and equatorial coordinates, magnitudes and their estimated errors. tables 2 and 3 are only available electronically either at the CDS or at the WEBDA111http://obswww.unige.ch/webda/navigation.html sites.
3 Star counts, cluster centres and sizes
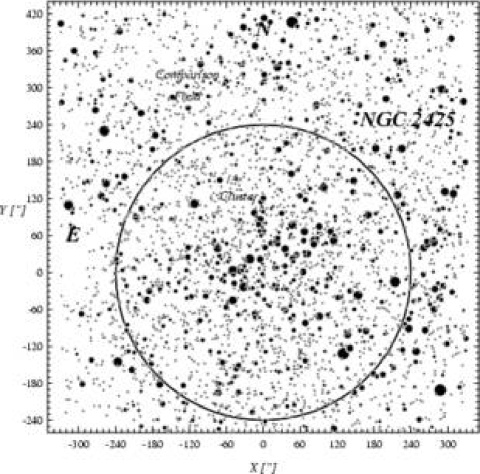
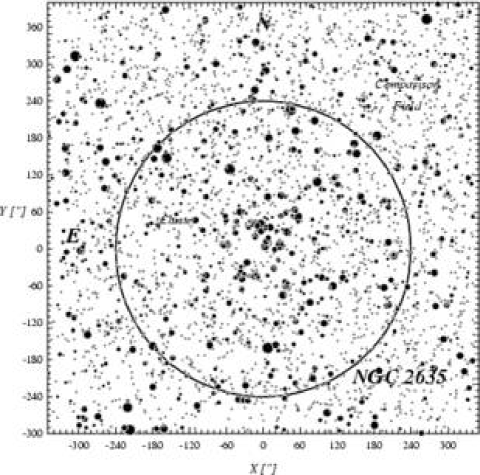
As a first step, we estimated the position of each cluster’s centre following a variation of the method given in Moitinho et al. (1997): the surface stellar distributions of stars brighter than were convolved with a pixel () Gaussian kernel to smooth out the details of the spatial distributions. The derived cluster centres, taken to be the geometrical centres of the regions of enhanced stellar density, are given in table 1. Both values lie very close to the ones given by Dias et al. (2002).
Once a cluster’s centre was determined, its radial density profile was built by counting stars in a number of successive rings, wide, and dividing the counts by the correspondent ring’s area. Appropriate corrections were applied to the areas of rings not totally included in the image. Density profiles were built for both the optical data (for mag) and for the 2MASS infrared data (for mag). The magnitude cut-offs were roughly selected to reduce contamination by field stars and possible artifacts due to incompleteness (especially true for the 2MASS data). The radial density profiles are shown in Fig. 3. In the case of NGC~2425 (upper panel), we notice an obvious stellar density enhancement that appears to reach the background level at . For NGC~2635 (lower panel), the probable radius is also found to be . These star counts yield radii that are significantly larger than the visual estimates reported in Dias et al. (2002). In both cases, the radii are taken to be the range beyond which the star counts follow a flat distribution, describing the field star population.

4 Photometric analysis
To estimate the cluster ages we start by considering the CMDs in the V vs (B-V) plane shown in Fig. 6. Only stars located within the very inner central regions were plotted to reduce the effect of field star contamination and better interpret the shape of the cluster sequences while still containing a reasonable number of cluster stars. The circular extractions plotted in Fig. 6 are for both NGC~2425 and NGC~2635.

The CMD of NGC~2425 is shown in the left panel of Fig. 6. It is an old open cluster with a turn-off (TO) at 16 and a clump of red stars at 14.1. A rough age estimate, using the calibration of Carraro & Chiosi (1994) for (the magnitude difference between the TO and red clump), yields 2.5 Gyr. As discussed by those authors, the estimate is independent of the distance modulus and reddening. Like other clusters of about this age (e.g. NGC~2420, NGC~2204) the red giant branch (RGB) is barely visible. The Main Sequence (MS) extends for 5 mag up to , and gets wider at fainter magnitudes, which we ascribe to increasing photometric errors at increasing magnitude, and to contamination by field stars.
The CMD of NGC~2635 shown in the right panel of Fig. 6 reveals a younger cluster, with a TO at about , and a wide clump, typical of moderate age clusters. The fact that, except for the clump stars, the cluster sequence is fainter than explains why Vogt & Moffat (1972) did not find signs of a cluster in their photoelectric study. Using again the Carraro & Chiosi (1994) calibration, we infer an age lower than 1 Gyr. Due to the younger age, the MS is in this case slightly more extended in magnitude. A parallel sequence, probably due to binary stars, is also visible redward of the MS.
The following sections are devoted to the first determination of these clusters’ fundamental parameters (reddening, distance and age) through a detailed analysis of their photometric diagrams.
4.1 NGC~2425
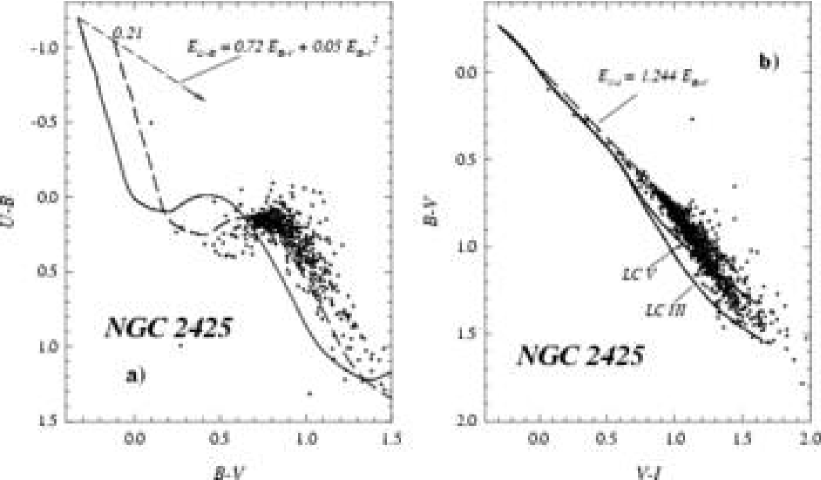
The Two Colour Diagrams (TCDs) and Colour Magnitude diagrams (CMDs) of NGC~2425 are presented in Figs. 7 and 8, respectively. In Fig. 8, panels c) and d) represent the Comparison Field (CF) CMDs (see Fig. 4). This field was chosen to cover the same area as the cluster and to be within the region covered by both CTIO and NTT observations.
Because of its old age, the stars in NGC~2425 have too late spectral types, which make the TCDs not very useful in deriving memberships. We can, however, use those diagrams to infer the cluster reddening and reddening path. A reddening of is derived by fitting the Schmidt-Kaler (1982) ZAMS to the cluster sequence in the vs plane, and the Cousins (1978) reference line to the sequence in the vs plane. The TCDs show that the reddening path is the normal one, as also previously indicated in Paper I for this region of the Galaxy.
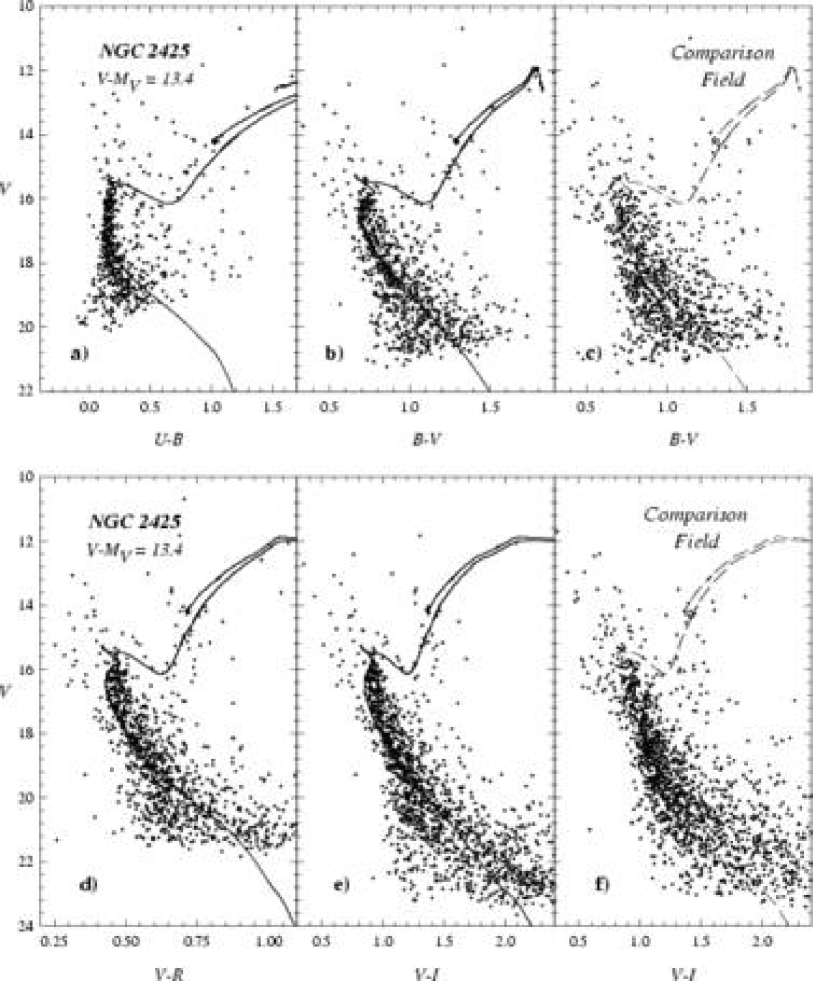
CMDs for several different colour combinations are shown in Fig. 8. The different CMDs do not reach the same limiting magnitude, , ranging from in the diagrams involving to in the vs plane. This is due to the different wavelength sensitivity of the detector/filter combinations and to the the deeper NTT data (see Sect. 2.1). Superimposed on each diagram is the same 2.2 Gyr solar composition isochrone from the Padova group (Girardi et al. 2000). The isochrone nicely reproduces the observed cluster sequence (MS, TO, RGB) in all the diagrams. Other combinations of age and metallicity have been tried, but none provided such a good fit.
The isochrone fit yields an apparent distance modulus . This value together with , as derived from the TCDs, puts NGC~2425 at 3550 pc from the Sun, which corresponds to a Galactocentric distance of 10.7 kpc, 200 pc above the Galactic plane.
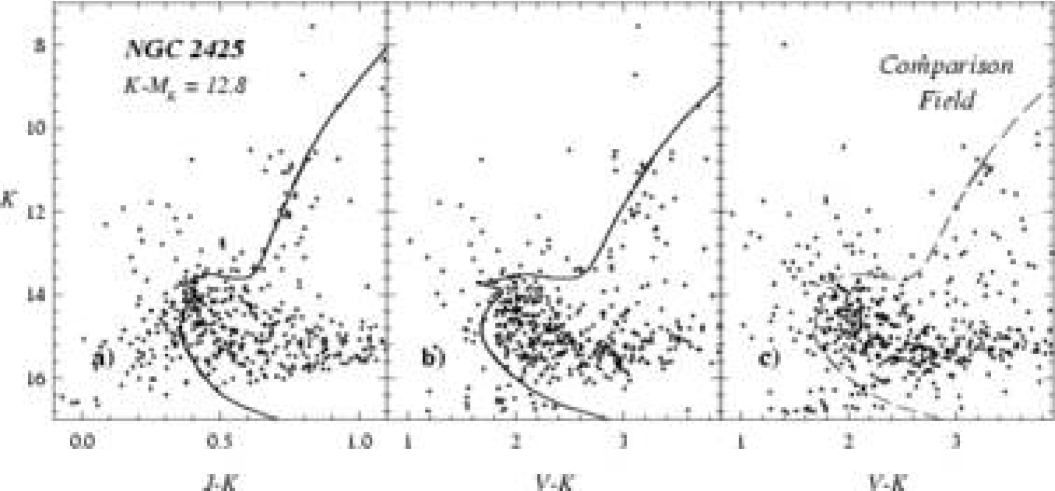
Fig. 9 shows the best fit isochrone plotted over the infrared 2MASS CMDs. The combination of age and distance results in a cluster sequence that is too faint to be clearly identified in these diagrams. As will be shown in Sect. 4.2, that is not the case of the infrared diagrams of NGC~2635.
4.2 NGC~2635
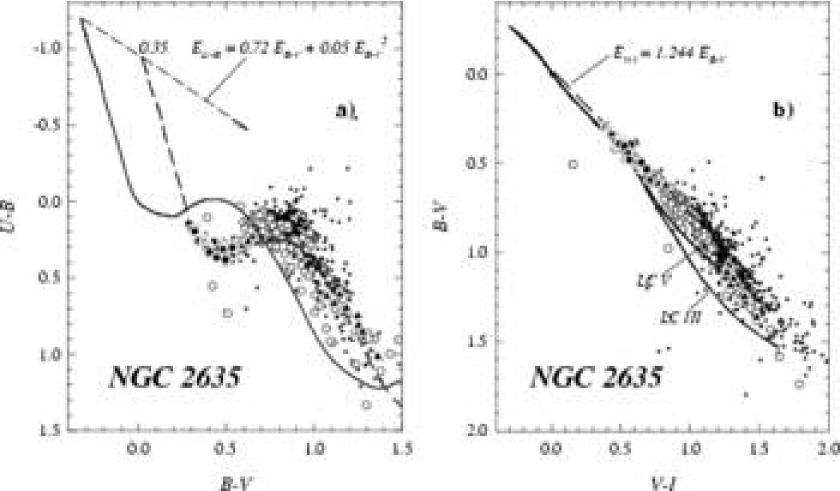
Unlike NGC~2425, the presence of earlier type stars in NGC~2635 allows us to perform a photometric membership search following the technique described in Baume et al. (2004). The method is based on a close synoptic scrutiny of the locations of the stars in TCDs and CMDs built using several colour combinations. The results are illustrated in Figs. 10 and 11. These diagrams display a clear cluster sequence above . So the individual stellar locations down to this magnitude are examined in all the photometric diagrams in a fashion similar to that in Baume et al. (2004):
-
•
For stars brighter than , if they have coherent locations near the ZAMS, they are considered likely members ().
-
•
Fainter stars, with magnitudes in the range in the same conditions are considered only probable members ().
- •
-
•
The number of stars in each magnitude bin is checked for agreement with the counts obtained from the difference between the and the corresponding .
At fainter magnitudes, contamination from the Galactic field population (compare with the CMDs) becomes severe, preventing a firm identification of cluster members.
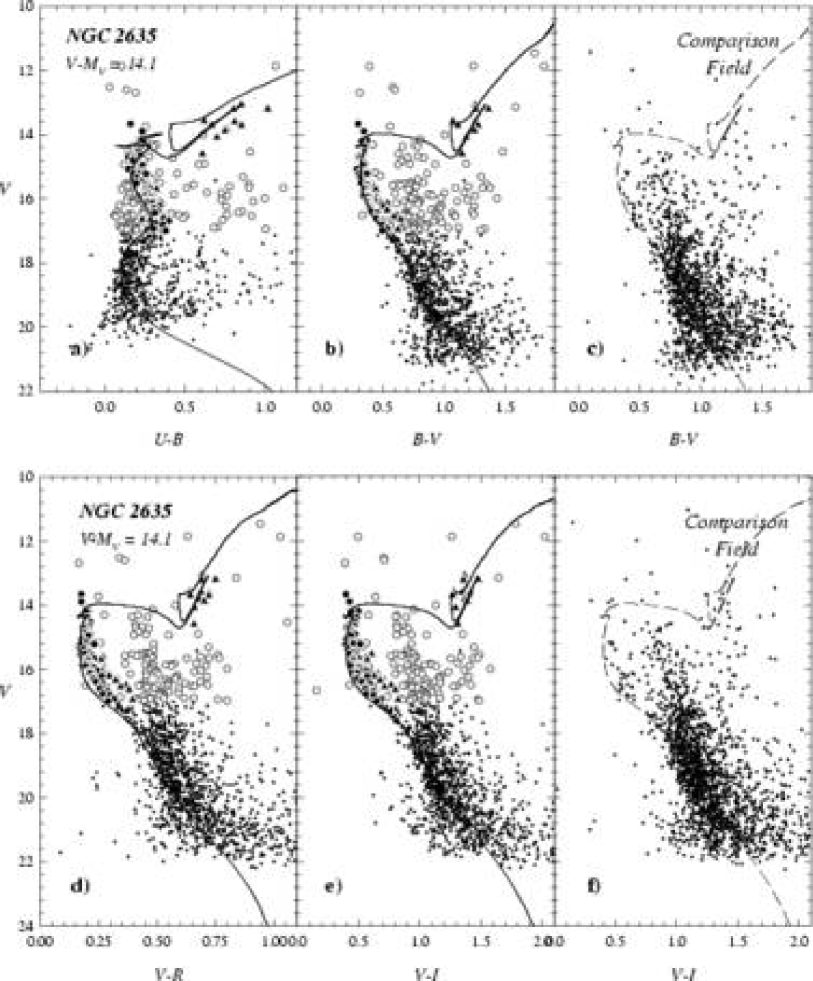
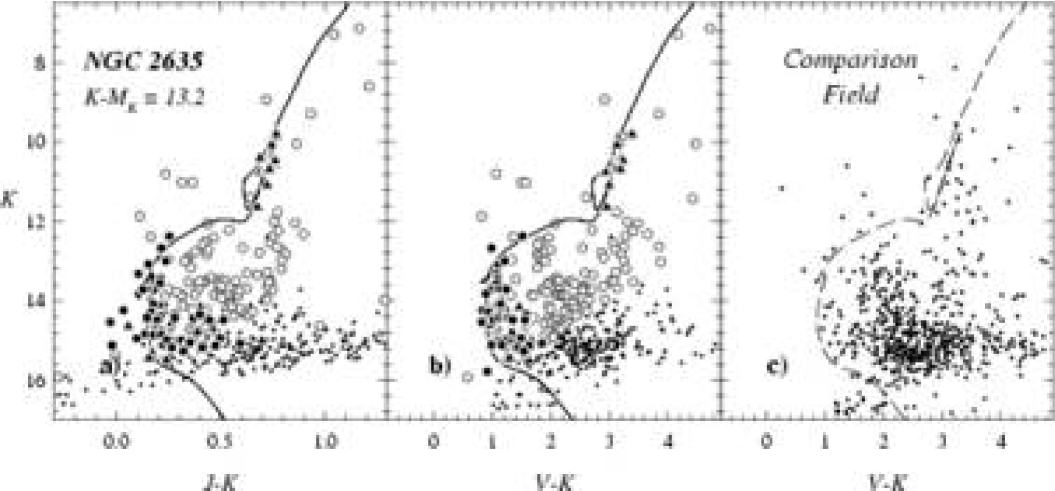
Overplotted on the CMDs of Fig. 11 is a 600 million year old isochrone computed for Z=0.004 (Girardi et al. 2000), shifted for a colour excess of and an apparent distance modulus of . We have found these parameters to provide the best fit to all the CMDs simultaneously. The derived reddening and apparent distance modulus situate NGC~2635 at a heliocentric distance of approximately 4 kpc, which corresponds to a Galactocentric distance of 9.5 kpc, 300 pc above the Galactic plane. The TCD positions of the earlier spectral type stars (see Fig. 10) confirm the derived age. We do, however, notice the presence of two bright stars above the TO, which are members according to our photometric criteria, but which are not fitted by the isochrone. These two photometric members lie well within the cluster radius, so they could be blue stragglers or simple binaries. The isochrone fit is also shown in the infrared diagrams of Fig. 12. Although the vs CMD presents a large scatter, mainly due to the precision limit of the 2MASS data, the combined optical-infrared vs diagram shows a tighter sequence that is well reproduced by the model and derived parameters, with no counterpart in the CF diagram. Also, in both cluster diagrams the bright red clump is very well reproduced.
The need to adopt such a low metallicity is better illustrated in Fig. 13, where three isochrones for the same age, but with different metallicities, are plotted. Although all three isochrones reproduce well the shape of the TO, only the low metallicity curve simultaneously fits both the cluster sequence and the red clump for our derived reddening. Adjusting the parameters, we find that for a solar metallicity an age of 1 Gyr would fit the data with the untenable reddening value of 0.0 mag, while the intermediate metallicity isochrone would work for an age of 0.8 Gyr and a reddening of 0.15 mag, too low to be compatible with the findings from the TCDs.
5 Discussion and conclusion
We have presented the first CCD photometric study of the open clusters NGC~2425 and NGC~2635. The two clusters were found to be of intermediate age, allowing us to update the census of the old open cluster population in the Galactic disk. The basic cluster parameters derived in this study are presented in Tabs. 1 and 4.
| (mag) | (mag) | (Kpc) | (Myr) | (’) | |
|---|---|---|---|---|---|
| NGC~2425 | 0.21 | 13.4 | 3.55 | 2200 | 4.0 |
| NGC~2635 | 0.35 | 14.1 | 4.00 | 600 | 4.0 |
We found that NGC~2425 is a 2.2 Gyr old cluster, located at a Galactocentric distance of 10.7 kpc. The overall good isochrone fit through the stellar sequences in several CMDs, using various colour combinations, allowed us to conclude that the cluster has a nearly solar metal abundance.
NGC~2635 is a much younger cluster, with an age of 600 Myr, close to the age of the Hyades. We situate this cluster at a Galactocentric distance of 9.5 kpc, and propose that it has to be rather metal poor. The metallicity which provides the best isochrone fit is Z=0.004, which translates into [Fe/H]=-0.61. Clearly, both clusters are very interesting objects in the context of the Galactic disk’s chemical evolution, in particular the role they can play in shaping the radial abundance gradient and the age-metallicity relation in the Galactic disk (Carraro et al. 1998). Recent suggestions have been made that the radial abundance gradient flattens with time (Friel et al. 2002, , Fig. 3). NGC~2425, with an age of 2.2 Gyr and solar abundance confirms the slope of the gradient at intermediate ages (2 to 4 Gyrs).
However, NGC~2635 with an age of half a Gyr and a metallicity of [Fe/H]=-0.61, significantly deviates from the mean trend. In a recent work, Carraro et al. (2005b) studied two intermediate-age open clusters, NGC~6404 and NGC~6583, located at about 6.5 kpc from the Galactic centre, which have a probable solar abundance. If we put the two clusters and NGC~2635 in the radial gradient defined by the youngest clusters, we infer that the slope is much steeper than that found by Friel et al. (2002), thus casting some doubt on the flattening of the gradient. Clearly, more young clusters are needed, especially to better define the distance baseline.
The development of this third Galactic quadrant project should help clarifying this issue, thus providing more robust constraints for Galactic disk chemical evolution models (Tosi 1996).
Acknowledgements.
AM acknowledges financial support from FCT (Portugal) through grants BPD/20193/99 and SFRH/BPD/19105/2005 and through the YALO project (CTIO observations). GC acknowledges the support of Fundación Andes. GB acknowledges the cooperative international agreement Argentino-Italiano SECYT-MAE (IT/PA03 - UIII/077). This research made use of the NASA Astrophysics Data System, of the Simbad database operated at the Centre de Donnés Stellaires — Strasbourg, France, and of the WEBDA open cluster database of J.-C. Mermilliod. This publication also makes use of data products from the Two Micron All Sky Survey, which is a joint project of the University of Massachusetts and the Infrared Processing and Analysis Center/California Institute of Technology, funded by the National Aeronautics and Space Administration and the National Science Foundation.
References
- Baume et al. (2004) Baume, G., Moitinho, A., Giorgi, E. E., Carraro, G., & Vázquez, R. A. 2004, A&A, 417, 961
- Carraro & Chiosi (1994) Carraro, G. & Chiosi, C. 1994, A&A, 287, 761
- Carraro et al. (2005a) Carraro, G., Geisler, D., Baume, G., Vázquez, R., & Moitinho, A. 2005a, MNRAS, 360, 655
- Carraro et al. (2005b) Carraro, G., Méndez, R. A., & Costa, E. 2005b, MNRAS, 356, 647
- Carraro et al. (1998) Carraro, G., Ng, Y. K., & Portinari, L. 1998, MNRAS, 296, 1045
- Cousins (1978) Cousins, A. W. J. 1978, MNSSA, 37, 62
- Cutri et al. (2003) Cutri, R. M., Skrutskie, M. F., van Dyk, S., Beichman, C. A., Carpenter, J. M., Chester, T., Cambresy, L., Evans, T., Fowler, J., Gizis, J., Howard, E., Huchra, J., Jarrett, T., Kopan, E. L., Kirkpatrick, J. D., Light, R. M., Marsh, K. A., McCallon, H., Schneider, S., Stiening, R., Sykes, M., Weinberg, M., Wheaton, W. A., Wheelock, S., & Zacarias, N. 2003, explanatory Supplement to the 2MASS All Sky Data Release
- Dias et al. (2002) Dias, W. S., Alessi, B. S., Moitinho, A., & Lépine, J. R. D. 2002, A&A, 389, 871
- Friel et al. (2002) Friel, E. D., Janes, K. A., Tavarez, M., Scott, J., Katsanis, R., Lotz, J., Hong, L., & Miller, N. 2002, AJ, 124, 2693
- Giorgi et al. (2005) Giorgi, E. E., Baume, G., Solivella, G., & Vázquez, R. A. 2005, A&A, 432, 491
- Girardi et al. (2000) Girardi, L., Bressan, A., Bertelli, G., & Chiosi, C. 2000, A&AS, 141, 371
- Høg et al. (2000) Høg, E., Fabricius, C., Makarov, V. V., Urban, S., Corbin, T., Wycoff, G., Bastian, U., Schwekendiek, P., & Wicenec, A. 2000, A&A, 355, L27
- Moitinho (2001) Moitinho, A. 2001, A&A, 370, 436
- Moitinho et al. (1997) Moitinho, A., Alfaro, E. J., Yun, J. L., & Phelps, R. L. 1997, AJ, 113, 1359
- Schmidt-Kaler (1982) Schmidt-Kaler, T. 1982, Landolt-Börnstein, Group VI, Vol. 2b, Stars and Star Clusters (Berlin: Springer), 15
- Tosi (1996) Tosi, M. 1996, in ASP Conf. Ser. 98: From Stars to Galaxies: the Impact of Stellar Physics on Galaxy Evolution, 299–+
- Vogt & Moffat (1972) Vogt, N. & Moffat, A. F. J. 1972, A&AS, 7, 133