INTEGRAL observations of AGN in the Galactic Plane
We present results on approximately one year of INTEGRAL observations of six AGN detected during the regular scans of the Galactic Plane. The sample is composed by five Seyfert 2 objects (MCG –05–23–16, NGC 4945, the Circinus galaxy, NGC 6300, ESO 103–G35) and the radio galaxy Centaurus A. The continuum emission of each of these sources is well represented by a highly absorbed () power law, with average spectral index . A high energy exponential cut-off at is required to fit the spectrum of the Circinus galaxy, whereas a lower limit of 130 keV has been found for NGC 4945 and no cut-off has been detected for NGC 6300 in the energy range covered by these INTEGRAL data. The flux of Centaurus A was found to vary by a factor of in 10 months, showing a spectral change between the high and low state, which can be modelled equally well by a change in the absorption ( from 17 to ) or by the presence of a cut-off at 120 keV in the low state spectrum. A comparison with recently reprocessed BeppoSAX/PDS data shows a general agreement with INTEGRAL results. The high energy cut-off in the hard X-ray spectra appears to be a common but not universal characteristic of Seyfert 2 and to span a wide range of energies.
Key Words.:
Galaxies: active – Galaxies: Seyfert – Gamma rays: observations – X-rays: galaxies1 Introduction
In radio quiet Active Galactic Nuclei (AGN), most of the power supplied by the central black hole is emitted in the form of X-rays and -rays. This emission comes from the regions close to the nucleus and its study enables us to constrain the geometry and the state of the matter in the heart of an AGN. The emission in the soft X-ray domain is rather well known (up to 10 keV). The spectrum is in most cases well reproduced by an absorbed power law, a Compton reflection component and a Fe fluorescence line. Many questions are however still open for the hard X-rays/soft -ray range. For many objects, a high-energy cut-off is required to reproduce the data between 60 and 300 keV, but the shape and the energy of this feature is not yet well known (Zdziarski et al. 1995, Risaliti 2002, Deluit & Courvoisier 2003).
Our knowledge of the hard X-ray sky above 10 keV comes from observations
carried out by many instruments, like Granat/SIGMA (Paul et al. 1991),
CGRO/BATSE (Fishman et al. 1992), CGRO/OSSE (Johnson et al. 1993),
BeppoSAX/PDS (Frontera et al. 1997) and RXTE/HEXTE (Rothschild et al. 1998).
The fine spectroscopy with imaging and accurate positioning of
the sources makes INTEGRAL (INTErnational Gamma-Ray Astrophysics Laboratory,
Winkler et al. 2003a)
a suitable instrument to study the hard X-ray emission of AGN
also in a dense sky region like the Galactic Plane.
In the first year of Core Program observations, INTEGRAL has detected a number of AGN.
Among those are objects already known in the 20–100 keV band,
while others are new hard X-ray discoveries (Bassani et al. 2004,
Masetti et al. 2004).
In this paper, we present a preliminary study of the hard X-ray emission for 6 AGN detected by INTEGRAL in its first year of observations and compare our results to previous ones based on BeppoSAX/PDS observations. In Section 2 we discuss our sample selection and in Section 3 we detail the data reduction and analysis of INTEGRAL and BeppoSAX observations. A variability study of these objects and the spectral analysis of the INTEGRAL and BeppoSAX/PDS data are reported in Sections 4 and 5, respectively. The results are discussed in Section 6 and conclusions reported in Section 7.
2 Sample Selection
The sources in this sample were selected from among objects detected during the Core Program (CP herein after; Winkler et al. 2003b) observations performed by INTEGRAL. From February to October 2003 INTEGRAL CP observations led to the detection of hard X-ray emission from 10 previously known AGN: MCG –05–23–16, NGC 4945, Centaurus A, Circinus galaxy, NGC 6300, GRS 1734–292, PKS 1830–211, ESO 103–G35, NGC 6814, Cygnus A (Bassani et al. 2004). Among these, some were poorly observed in the hard X-ray domain by previous missions (GRS 1734–292, PKS 1830–211).
INTEGRAL results for GRS 1734–292 and PKS 1830–211 have been already presented by Sazonov et al. (2004) and De Rosa et al. (2005), respectively, while an analysis of NGC 6814 is in preparation. Cygnus A has not been included in our sample due to likely contamination from the cluster emission surrounding the AGN.
We present in this work the remaining 6 AGN: MCG –05–23–16, NGC 4945, Centaurus A, Circinus galaxy, NGC 6300, ESO 103–G35, which were previously studied by different missions, in particular by BeppoSAX, allowing us to compare the INTEGRAL results with previous ones. The objects in this sample (Table 1) are at small cosmological distances (averaged redshift of 0.005) and are all Seyfert 2 galaxies according to their NED classification, although Centaurus A (a Narrow Line Radio Galaxy) shows a complex spectral energy distribution which makes a unique classification difficult.
| Name | R.A.111J2000 coordinates. | Decl.a | z | Type | |
|---|---|---|---|---|---|
| (deg) | (deg) | ||||
| MCG –05–23–16 | 146.9 | –30.9 | 0.0083 | Sey2 | 8.0 |
| NGC 4945 | 196.4 | –49.5 | 0.0019 | Sey2 | 15.7 |
| Centaurus A | 201.4 | –43.0 | 0.0018 | RG | 8.6 |
| Circinus galaxy | 213.3 | –65.3 | 0.0015 | Sey2 | 55.6 |
| NGC 6300 | 259.2 | –62.8 | 0.0037 | Sey2 | 9.4 |
| ESO 103–G35 | 279.6 | –65.4 | 0.0133 | Sey2 | 7.7 |
3 Observations and Data Analysis
3.1 INTEGRAL
The INTEGRAL mission is dedicated to the spectroscopy and fine imaging of sources in the energy range 15 keV – 10 MeV, with its principal instruments, the imager IBIS (Ubertini et al. 2003) and the spectrometer SPI (Vedrenne et al. 2003). Simultaneous observations are performed by the X-ray monitor JEM-X (3–35 keV, Lund et al. 2003) and the optical monitor OMC (V band, Mas-Hesse et al. 2003). The IBIS telescope is composed by two independent detectors optimised for low (ISGRI, 15–1000 keV, Lebrun et al. 2003) and high (PICsIT, 0.175–10 MeV, Di Cocco et al. 2003) energies.
The large field of view of IBIS ( fully coded), the high angular resolution (12’) and the typical on-axis sensitivity of 1 mCrab at 100 keV (3, s) are characteristics optimised for a regular scan of the Galactic Plane (Winkler et al. 2003b) in order to monitor the known sources and to discover new hard X-ray sources. This survey, with a deep exposure of the Galactic Centre and pointed observations, constitutes the Core Program of the guaranteed time which involved 9.3 Ms of the observing time available during the first year of the mission.
Each source of this sample was first detected (Bassani et al. 2004) during the INTEGRAL CP observations performed between 2003 February 28 (revolution 46) and October 10 (revolution 120), in the search for significant excesses in the mosaic sky image (a weigthed mean of all single pointing images) of the IBIS/ISGRI instrument. In order to perform a more detailed analysis, we used additional data including those that were public at the time of this study, specifically all the data in revolutions 1–136 (October 2002–November 2003) and 142–149 (December 2003–January 2004). For objects like Centaurus A and the Circinus galaxy this substantially improved the results, thanks to data from pointed observations. In Table 2 the log of the INTEGRAL observations are reported togheter with the ISGRI significance and count rates of the sample sources.
Analysis of data collected by ISGRI, JEM-X and SPI instruments has been performed, selecting the observations made respectively within , and radius of each source. The extraction radius for JEM-X is smaller because of the smaller fully coded field of view of radius. Imaging, spectra and timing analysis were performed using the version 4.2 of the ISDC’s Offline Science Analysis (OSA) package (Courvoisier et al. 2003b).
Because of the faint nature of the sources in the sample, we chose to extract the ISGRI spectra for NGC 4945, the Circinus galaxy, NGC 6300 and ESO 103–G35 from the count rate and variance mosaic images at the position of the source, which in all cases corresponds to the brightest pixel in the 30–50 keV band. This band provides the best compromise between maximising the signal-to-noise ratio and having a good removal of imaging artefacts (Bird et al. 2004). We built the spectra in 10 energy bands from 20 to 600 keV and then rebinned them in order to have at least 30 counts in each bin to apply the minimization technique. Only the flux of Centaurus A was high enough to allow the spectral extraction with the OSA standard method and to use a finer binning (2 keV width). These data were then rebinned with the same criterium as described above. The low detection significance of MCG –05–23–16 does not allow spectral extraction. Based on Crab calibration studies, we added a systematic error of 3% only to the ISGRI spectra of the three brigthest sources (NGC 4945, Centaurus A and the Circinus galaxy), as for the other objects statistical errors would be dominant anyway.
The ISGRI light curves for the three brightest objects were created with the standard software with time bin of 3000 seconds in the 20–40 keV and 40–60 keV bands. A finer binning of 100 s was used in order to perform a deeper analysis of only some specific periods.
Because of the smaller field of view (FoV) of JEM-X, the exposure times for the X-ray monitor are much lower than for the IBIS and SPI observations. MCG –05–23–16 was never in the field of view of JEM-X and NGC 4945, NGC 6300 and ESO 103–G35 were not detected. A low significance ( in the 3–10 keV band, count rate of 0.3 0.1 in the 3-35 keV) for Circinus has been obtained with 17 ks of data, allowing only an estimate of the flux level, while spectral extraction between 3–35 keV has been performed for Centaurus A, thanks to a highly significant detection of for an exposure of 113 ks (count rate of 3.24 0.04 in the 3-35 keV band). JEM-X spectra of Centaurus A have been extracted with the standard software for each pointing and then a weighted average has been constructed to obtain spectra along longer periods.
The SPI analysis was done using the specific analysis software (Diehl et al. 2003) including version 9.2 of the reconstruction software SPIROS (Skinner & Connell 2003) which is based on the “Iterative Removal of Sources” technique (Hammersley et al. 1992). NGC 4945, Centaurus A and Circinus have been detected by SPI, with count rates of (5.1 0.7) (20-200 keV), (1.64 0.07) (20-200 keV) and (3.3 0.4) (20-100 keV), respectively and SPI spectra have been extracted for these three sources. Only upper limits of 1.5, 0.6 and 1.3 have been obtained in the 20–40 keV band for MCG –05–23–16, NGC 6300 and ESO 103–G35, respectively, which are consistent with the ISGRI fluxes in the same energy band (1.0, 0.3 and 0.6).
The spectral analysis was performed using the XSPEC 11.3.1 software package (Arnaud 1996). In the following, all quoted errors correspond to 90% confidence interval for one interesting parameter ().
| INTEGRAL | BeppoSAX | ||||||||
| Name | Obs Date | Expa | a | Count ratea | Obs Date | Expb | b | Count rateb | |
| (ks) | (ks) | ||||||||
| MCG –05–23–16 | Jul 2003 | 2 | 2.4 | 1.8 1.1 | Apr 24, 1998 | 34 | 36 | 1.59 0.04 | |
| NGC 4945 | Jan 2003 – Jan 2004 | 276 | 40.2 | 2.38 0.07 | Jul 1, 1999 | 44 | 81 | 2.59 0.03 | |
| Centaurus A | Mar 2003 – Jan 2004 | 404 | 210.8 | 9.86 0.05 | 1997–2000 | 90 | 196 | 5.58 0.03 | |
| Circinus galaxy | Jan 2003 – Jan 2004 | 589 | 57.2 | 2.29 0.05 | 1998–2001 | 138 | 92 | 1.93 0.02 | |
| NGC 6300 | Mar 2003 – Oct 2003 | 173 | 7.0 | 0.7 0.1 | Aug 28, 1999 | 42 | 37 | 1.25 0.04 | |
| ESO 103–G35 | Mar 2003 – Oct 2003 | 36 | 4.2 | 2.5 0.3 | 1996–1997 | 30 | 15 | 0.81 0.05 | |
-
a Exp: ISGRI exposure time not corrected for the off-axis vignetting effects; 11footnotetext: : ISGRI detection significance in the 20–100 keV band; 11footnotetext: Count rate: ISGRI background substracted count rate in the 20–300 keV band.
11footnotetext: b Exp: PDS effective exposure time; 11footnotetext: : PDS detection significance in the 20–100 keV band; 11footnotetext: Count rate: PDS background substracted count rate in the 15–200 keV band.
3.2 BeppoSAX
All the PDS data, publicly available through the BeppoSAX archive have been analysed for the 6 AGN of the sample (Table 2). For three of these sources (MCG–05–23–16, NGC 4945, NGC 6300) only one observation has been performed. For the other three objects (Centaurus A, the Circinus galaxy, ESO 103–G35) the summed spectrum of several observations has been used (5, 2 and 2 observations, respectively) because no significant variation of the flux and of the spectral parameters has been detected during the BeppoSAX observations. Spectral analysis has been performed in the range 15–150 or 15–200 keV with 10 energy bins.
The PDS spectra were extracted using the XAS v2.1 package (Chiappetti & dal Fiume 1997) which provides smaller error bars222On behalf of the PDS group, see ftp://ftp.tesre.bo.cnr.it in the directory /pub/sax/doc/software_docs/xas_vs_saxdas.ps. than SAXDAS, i.e. the standard package for the reduction and analysis of BeppoSAX/PDS data. It is also important to emphasize that a significant improvement in the signal-to-noise ratio and a more reliable check of the background fields are obtained using XAS. Source visibility windows were selected following the criteria of no Earth occultation and high voltage stability during the exposure. In addition, the observations closest to the South Atlantic Anomaly were excluded from the analysis. Since most of the sources in our sample are rather faint in the PDS band, it was necessary to carefully check the background subtraction by taking advantage of the rocking technique (Frontera et al. 1997). When two units of the collimator are pointing ON source, the other two units are pointing towards one of the two OFF positions. The OFF spectra are then used as background in the computation of the spectrum of the target source.
Comparing the two offset fields, we found the presence of two contaminating sources in the -OFF fields of the Circinus galaxy observation: a excess at , (J2000.0) in the first measurement and a excess at , in the second exposure. The error associated to the above positions is quite large (around ) thus making the search for likely X-ray counterparts a difficult task. Nevertheless, the first object may be associated to RCW86 (SNR 315.0–02.3), a supernova remnant, while the second one is probably the HMXRB system 4U 1416–62.
Also in the observation of ESO 103–G35 we found a contaminating source in the +OFF background field: the excess at , , also detected in the XTE Slew Survey is likely the Seyfert 1 galaxy ESO 140–43. In both cases, in order to extract the uncontaminated source spectra of both the Circinus galaxy and ESO 103–G35, we excluded the contaminated fields and considered only the uncontaminated measurements in the computation of the background for these two sources.
4 Source Variability
For the three brightest sources in this sample, i.e. NGC 4945, Centaurus A and Circinus, we extracted
the light curves from INTEGRAL/ISGRI data to study the variability over a period of about one year.
The pointed observations of the Circinus galaxy took place in the period 6–18 July 2003, while between January and June 2003
only a few data were collected with about monthly recurrence. Data from 4 pointings are available in the period
December 24, 2003 – January 2, 2004.
NGC 4945 observations are concentrated in the two periods March 7–9, 2003 and January 2–4, 2004.
A few pointings executed in January, June and July 2003 have also been analysed.
The apparent increase of the source count rates observed at the end of some revolutions (rev. 90 for Circinus and 48 for NGC 4945) is due to the increased contribution of the background which is generally higher in the INTEGRAL instruments when the satellite approaches the perigee passage due to radiation belt effects. Some modulation on time scales of hours in the light curve of NGC 4945 was revealed to be due to an anticorrelation between the apparent flux and the off-axis position of the source. For these reasons it is difficult to study the intrinsic variability of so weak sources on time scales of hours. We therefore rebinned the light curves in order to have one flux value per revolution and we excluded those revolutions in which the source was observed for less than 20 ks.
The light curve of the Circinus galaxy is represented by three data points in the period 6–18 July 2003. A significant variability of 10% within 2 days has been detected in the 20-40 keV range. When fitted with a constant, the light curve gives with 2 degrees of freedom, resulting in a probability that random fluctuations will produce a poorer reduced chi-squared of . No significant variations have been seen in the 40-60 keV band (, ).
Two flux points in March 7–9, 2003 and one in January 2–4, 2004 constitute the light curve of NGC 4945, which presents a 20% decrease in flux in the 20–40 keV range within two days in March 2003. The fit with a constant gives (2 d.o.f.) with a significant null hypothesis probability of and only a marginal variability has been detected in the 40–60 keV band (, ).
A larger variation has been observed in the flux of Centaurus A. The ISGRI light curve shows a decrease by a factor of in the count rate level in both the 20–40 and 40–60 keV ranges between the beginning (March 7–9, 2003) and the end (January 2–4, 2004) of the observations. In Fig. 1 the ISGRI fluxes in the 40–60 keV band are reported, averaged over 5 principal periods (rev. 48, rev. 49, rev. 93, rev. 104 and rev. 149). A decrease by a factor of 1.8 has been observed also in JEM-X data in the 3–20 keV range within a period of 10 months. No JEM-X data are available in the intermediate period as the source was outside the FoV. The test gives for the 40–60 keV band (20–40 keV) a () with 4 d.o.f. which confirms the high significance of the variability. A flux decrease has also been observed in the 2–12 keV range by RXTE/ASM. The significance of the variability in these data is confirmed by a (5 d.o.f) and thus a probability of , and the amplitude of the variation is about a factor of 10 with a very large uncertainty, due to the large error bars of these measurements.

5 Spectral Fit Results
5.1 INTEGRAL Spectra
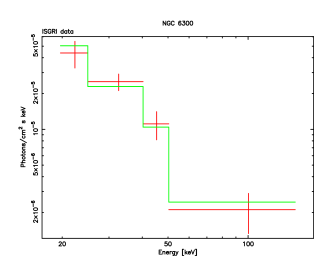
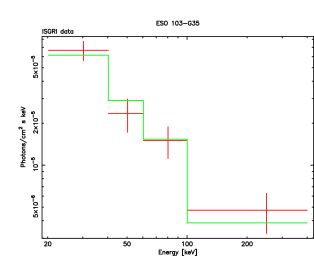
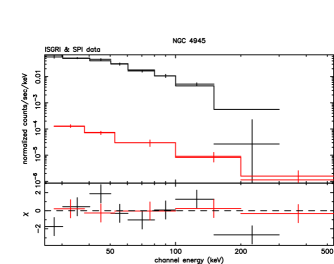
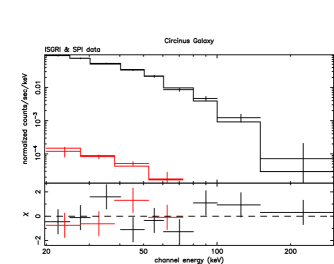
The intrinsic high absorption column density () typical for Seyfert 2 galaxies has to be taken into account when fitting the spectra. With the exception of Centaurus A, for which a JEM-X spectrum has been extracted, the INTEGRAL source spectra do not cover energies below 20 keV, which makes it difficult to constrain the intrinsic . Therefore during our analysis was fixed to the values found in the literature, i.e. for NGC 4945 and Circinus (Done et al. 2003, Matt et al. 1999), for NGC 6300 (Matsumoto et al. 2004) and for ESO 103–G35 (Wilkes et al. 2001). The parameters of the best spectral fitting are reported in Table 3. The spectra are shown in Figs 2–8, in photon units if only ISGRI data are avalaible and in count units when the SPI spectrum overlaps the ISGRI range.
A single power law corrected by photoelectric absorption (wabs model in XSPEC) is the best fit model for the INTEGRAL spectra of NGC 6300, ESO 103–G35 and NGC 4945 (Figs 2, 3 and 4). The photon indices are , and , respectively.
The high signal-to-noise ratio of the spectrum of NGC 4945 allows us to study the presence of a high energy cut-off. The introduction of this component does not improve the quality of the fit ( with 7 d.o.f. instead of with 8 d.o.f.) and a lower limit of can be given at level. If the is let free to vary, it reaches a value of , with a slight improvement of the which is not statistically significant (F-test probability of 0.5).
The combined ISGRI and SPI spectrum of Circinus (Fig. 5) is best fitted with a high absorbed power law with and a high energy exponential cut-off at keV which results in a of 1.1 (7 d.o.f.). This is significantly better than a simple power law fit ( with 8 d.o.f.). Introducing a Compton reflection component does not improve the fit results ( with 6 d.o.f.).
The low significance of the detection of MCG–05–23–16 hinders spectral extraction. In order to have an estimate of the flux level of this source, we assumed a spectrum identical to that of the Crab and we scaled the normalization using the count rate ratio, finding 13.5 and 15.6 mCrab (10.2 and 5.6 ) in the 20–40 keV and 40–60 keV bands, respectively.
| Object | Instruments | Model | 333Observed fluxes from ISGRI data. | 444Observed fluxes from JEM-X data. | ||||
|---|---|---|---|---|---|---|---|---|
| () | (keV) | () | () | |||||
| MCG–05–23–16 | ISGRI | – | – | – | – | 1.89 | – | – |
| NGC 4945 | ISGRI+SPI | wabs po | 400 | 2.2 | – | 1.1(8) | ||
| Centaurus A | ISGRI+SPI+JEMX555High state. | wabs po | – | 8.9 | 3.0 | 1.2 (199) | ||
| Centaurus A | ISGRI+SPI666Intermediate state. | wabs po | 17 | – | 7.5 | – | 3.3 (40) | |
| Centaurus A | ISGRI+SPI+JEMX777Low state. | wabs cutoffpl | 4.9 | 1.4 | 1.3 (198) | |||
| Circinus galaxy | ISGRI+SPI | wabs cutoffpl | 400 | 1.8 | 0.2 | 1.1(7) | ||
| NGC 6300 | ISGRI | wabs po | 22 | – | 0.5 | – | 0.4(2) | |
| ESO 103–G35 | ISGRI | wabs po | 18 | – | 1.8 | – | 0.7(2) |
5.1.1 Centaurus A
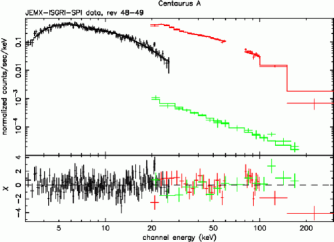
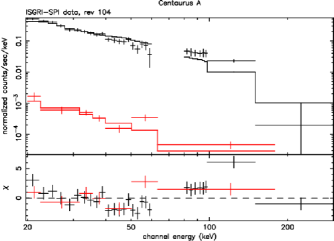
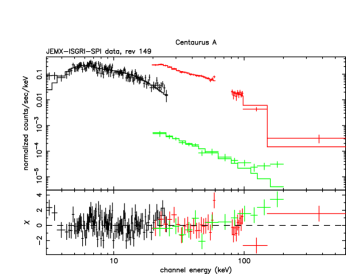
Unlike the other sources, Centaurus A requires an analysis which takes into account flux variations over an interval of months. We split the data according to the flux level, choosing three main periods: high state (March 7–9, 2003, rev. 48–49), intermediate state (July 18 – August 22, 2003, rev. 93 and 104) and low state (January 2–4, 2004, rev. 149). We constructed a spectrum for each of these periods and fitted them separately (Figs 6, 7 and 8).
The intermediate spectrum has been extracted mostly from data obtained during a staring observation (rev. 93).
The problem with this strategy is that sometimes structures in the background
can contribute to the overall count rate and can be mistaken for counts from the source. In dithering observations,
this problem is minimized,
resulting in a time average of the background which decrease the probability to have repetitive structures.
In fact a strong feature between 50 and 100 keV is present in the ISGRI spectrum of Centaurus A in revolution 93,
which has not been observed in the other spectra, nor in any other previous observation of this object.
Therefore these data have been excluded from the intermediate state spectral analysis.
The source was outside the FoV of JEM-X, and no data were taken by SPI in this revolution.
Known features of the mask pattern in ISGRI are not well modelled by the response matrix and
could be important for sources as bright as Centaurus A.
Instrumental background emission lines in the range 60–80 keV are known to be produced by Tungsten and Lead (Terrier et al. 2003).
In order to avoid possible contamination of the Centaurus A spectra, the energy bins in the 60–80 keV band
have been excluded from the analysis.
The combined JEM-X, ISGRI and SPI spectrum of the high state (Fig. 6) is best fitted by an absorbed power law with and . Adding a cut-off does not improve the fit (, 198 d.o.f. instead of , 199 d.o.f.) and results in a 3 lower limit at 270 keV for the cut-off energy.
The combined spectrum of the low state (Fig. 8) is well represented (, 199 d.o.f.) by an absorbed power law
with significantly
higher absorption () and photon index () than in the high state.
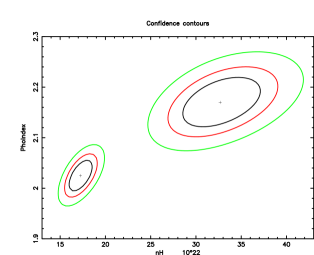
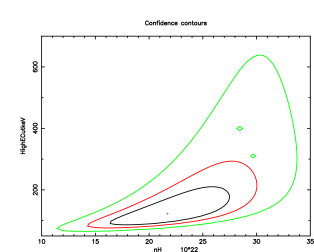
In Fig. 9 we report the contour plots for the high and low state of Centaurus A, when a simple power law
is used to model both spectra.
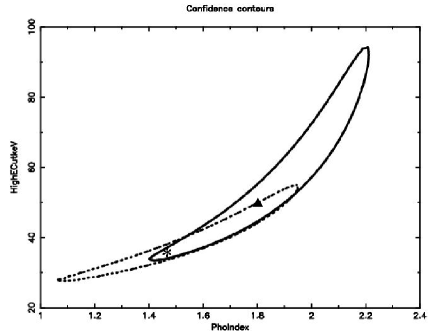
A slight improvement (, 198 d.o.f., F-test probability of 0.002) is achieved when a cut-off is added to the fit model
of the low state. This results in an absorption density , a photon index
and a cut-off at keV. Nevertheless, the energy of the cut-off and the absorption are not
well constrained with this model as it is evident in Fig. 10 where the contour plots are shown.
The spectral differences between the high and low state are shown in the ratio between the two spectra in
Figure 11.
The ratio in the range 5–80 keV is well approximated by a constant value of 1.7 (, 7 d.o.f., ).
A small variation is visible when we consider also the 3-5 keV bin ( in the 5–80 keV), probably due
to the change in the absorption.
The analysis of the ratio in the 3–150 keV range shows a high significant variability with (10 d.o.f.), confirming
a spectral change at high energies, consistent with the presence of a cut-off in the low state spectrum.
Adding a Gaussian feature to model a putative iron fluorescence line around 6.4 keV does not improve the fit and results in a upper limit for the line flux of and in the high and low state, respectively.
After excluding revolution 93 from the analysis, only 23 ks of data are available for the intermediate state of Centaurus A. This ISGRI spectrum is therefore much less significant ( in the 20–100 keV band) than the two in the high () and low () state which have 147 ks and 172 ks of exposure time, respectively. In addition, during this observation Centaurus A was always more than from the centre of the ISGRI FoV. For these two reasons the combined ISGRI–SPI spectrum (no JEM-X data available) is best fitted with an absorbed power law (with fixed, which does not influence the fit result) with an unsatisfactory of 3.0 and a steep spectrum with a photon index of (Fig. 7). No cut-off has been detected in the intermediate state.
A Compton reflection model has been applied to each of the three spectra of Centaurus A. No improvement was found in the of the fit and the reflection fraction was always below 0.1.

5.1.2 -ray Annihilation Line
The SPI spectrometer offers the opportunity to look for line features. In case the high energy spectrum of AGN would be dominated by non-thermal processes, one could expect a significant amount of pair annihilation processes around . At this energy, SPI has a resolution of (Attié et al. 2003). Imaging analysis in a 50 keV wide bin around the restframe energy of the annihilation line has been performed on the three brightest sources of our sample. It has been possible to obtain only a 3 upper limit for the flux in the 485–535 keV band of 4.5, 4.4 and 3.1 for Centaurus A, NGC 4945 and the Circinus galaxy, respectively.
5.2 Comparison with BeppoSAX/PDS Results
As most of the data we discussed have been taken with ISGRI in the hard X-ray range above 20 keV, the high
energy instrument of BeppoSAX, PDS, has been used to make a comparison in the same energy band.
It should be taken into account that the PDS spectra alone cannot well constrain components like absorption or
Compton reflection. For the PDS analysis we fixed at the value found in the
literature for MCG–05–23–16 (, Mattson & Weaver 2004).
For NGC 4945, Centaurus A and Circinus the values we found for the PDS spectra are in agreement with what
has been reported for these sources in the BeppoSAX broad band analysis. The cases of NGC 6300 and ESO 103–G35 are
discussed further in this section.
For BeppoSAX broad band analyses of the sources in the sample,
which are beyond the scope of this work, we refer to specific papers,
i.e. Mattson & Weaver (2004) for MCG–05–23–16, Guainazzi et al. (2000) for NGC 4945, Grandi et al. (2003) for Centaurus A,
Matt et al. (1999) and Guainazzi et al. (1999) for the Circinus galaxy, Guainazzi (2002) for NGC 6300 and Wilkes et al. (2001)
for ESO 103–G35.
The best fit parameters of the PDS spectra are reported in Table 4.
5.2.1 The Circinus galaxy
The Circinus galaxy reveals also in the PDS data the presence of a high energy cut-off at keV, compatible with the ISGRI value of keV. The – contour plots obtained from INTEGRAL (solid line) and PDS data (dotted line) are reported in Figure 12. Both the INTEGRAL and PDS data sets are consistent with a high energy cut-off in the range 35–55 keV at 99% confidence level. We performed a fit of INTEGRAL and PDS spectra also with the reflection model used by Matt et al. (1999) to fit the combined spectrum of all BeppoSAX instruments. Fixing all the parameters but the normalization at the value reported by Matt et al. (1999), the fit results in a worse (2.5 with 9 d.o.f for the INTEGRAL spectrum and 11.4 with 7 d.o.f. for the PDS one) compared to a simple cut-off power law which confirms the difficulty in studying the reflection component modelling only the high energy data. Nevertheless the value of the photon index and the cut-off energy in the model of Matt et al. (1999) are consistent with the values we find for these parameters by fitting the INTEGRAL and PDS spectra only.
5.2.2 NGC 6300
As discussed in Guainazzi 2002, the shape of the BeppoSAX spectrum of NGC 6300 can be explained by the presence of a Compton-thick absorber with a high of about or by a Compton-thin absorber () added to a Compton reflection component with a high reflection fraction (). The first model applies better to our PDS data in the 15–150 keV region with and the photon index found is consistent with the one obtained from ISGRI data (even when in the fitting model of the ISGRI spectrum the absorption is fixed to the PDS value). The difference by a factor of between the used in the ISGRI data fit (best value reported by Guainazzi 2002) and the one found in PDS data cannot be considered significant due to the lack of data below 20 keV in our analysis. The value of the photon index and the lack of a cut-off below 200 keV observed in ISGRI and PDS spectra are characteristics common also to the best fit model used by Guainazzi (2002) for the BeppoSAX spectrum. Fitting PDS data with this model, which includes a reflection component, results in an unacceptable fit: = 7 (9 d.o.f). = 0.06 (3 d.o.f) is obtained for ISGRI data, but the low statistics of this spectrum does not allow us to draw a firm conclusion about this model.
5.2.3 Centaurus A
The best fit model for the PDS spectrum of Centaurus A is an absorbed power law, where the value of the photon index is in agreement with what was found by INTEGRAL during the low state, when the source was at the same flux level as in the BeppoSAX data. The is not well constrained and is compatible with the one obtained from INTEGRAL spectra. Adding a cut-off does not improve the and gives values of 300 keV. The results from the broad band analysis of BeppoSAX data (Grandi et al. 2003) are in agreement with what found by the PDS alone. No high energy cut-off nor evidence for Compton reflection has been found in this BeppoSAX analysis.
5.2.4 MCG–05–23–16
For MCG–05–23–16 only a comparison of the flux level is possible, and this shows that BeppoSAX caught the source at about the same level as INTEGRAL did, with a flux of 6.7 and 4.0 in the 20–40 and 40–60 keV bands, respectively. The PDS spectrum alone is best fitted by an absorbed power law with photon index and cut-off at keV. Fixing the parameters, the reflection model of Mattson & Weaver (2004) for the BeppoSAX data represents the PDS data as well ( = 1.2 with 8 d.o.f), but the spectrum is softer ( 1.7) and the cut-off appears at higher energies (fixed at 100 keV by Mattson & Weaver 2004).
5.2.5 ESO 103–G35
The PDS spectrum of ESO 103–G35 is well modeled by an absorbed power law with high energy cut-off (, 4 d.o.f.), but the values of and are not constrained, spanning at 3 level the ranges 0.5–2 and 20–180 keV, respectively. Therefore, we decided to fit the spectrum with the best fit model of the combined BeppoSAX data (Wilkes et al. 2001), even if, as reveled by our analysis of the PDS data, the spectrum reported by Wilkes et al. (2001) should be contaminated by the presence of a source in the +OFF background field. The model used requires a photon index of 1.7, a cut-off with energy of keV and –folding energy of 40 keV (we freely varied only the normalisation). The signal-to-noise ratio of the ISGRI spectrum of ESO 103–G35 is not high enough to investigate the presence of a high energy cut-off, and the ISGRI photon index is compatible with the BeppoSAX one.
5.2.6 NGC 4945
The PDS spectrum of NGC 4945 is best modeled by a highly () absorbed power law with a photon index and a not well constrained high energy cut-off at keV. The lower limit obtained from INTEGRAL data (130 keV) for the cut-off energy is consistent with what found by the PDS and the photon index is steeper () but still compatible at 3 with the PDS one. These values are in agreement with the results obtained by Guainazzi et al. (2000) for the broad band BeppoSAX spectrum (, , keV).
| Object | Model | 888Observed fluxes. | ||||
|---|---|---|---|---|---|---|
| () | (keV) | () | ||||
| MCG–05–23–16 | wabs cutoffpl | 3 | 1.5 | 0.6 (6) | ||
| NGC 4945 | wabs cutoffpl | 2.9 | 1.2 (5) | |||
| Centaurus A | wabs po | – | 5.3 | 1.4 (7) | ||
| Circinus galaxy | wabs cutoffpl | 1.9 | 0.3 (5) | |||
| NGC 6300 | wabs po | – | 1.3 | 0.8 (7) | ||
| ESO 103–G35 | wabs po highe | 18 | 1.74 | 29999 keV. | 0.7 | 0.5 (6) |
6 Discussion on individual sources.
The BeppoSAX observation was the first one above 10 keV for the Circinus galaxy and shows
a strong absorption with .
INTEGRAL data do not allow to constrain the value of , but adding this component
fixed at improves the fit significantly
( from 1.8 to 1.1).
Such a high absorption can originate in the molecular
torus surrounding the nucleus or in the hot plasma which scatters the optical broad lines, and
allows the observation of the direct emission only above 10 keV.
A high energy cut-off at 35–55 keV is required in both INTEGRAL and BeppoSAX data
(Matt et al. 1999 and this work).
This results in a temperature of for the distribution of thermal
electrons in the Comptonizing medium. The presence of a cut-off supports the scenario in which the
X-ray emission of Seyfert galaxies originates in a two-phases accretion disk, where the soft photons emitted by a cold
() optically thick disk are Comptonized in a hot () region, for example an
optically thin corona above the disk (Haardt & Maraschi 1993).
A Compton reflection component observed in the broad band BeppoSAX data (Matt et al. 1999 and Guainazzi et al. 1999)
has not been detected by INTEGRAL because of the lack of data below 20 keV.
Several observations of NGC 4945 have been performed in the hard X-ray band.
Done et al. (1996) presented a combined study of ASCA, Ginga and OSSE data in which they found
a continuum with a photon index and a lower limit
for the cut-off energy at .
A high energy cut-off in the range 100–300 keV has been detected in BeppoSAX and RXTE data
(Guainazzi et al. 2000, Madejski et al. 2000).
The INTEGRAL spectrum is well fitted with a highly
absorbed power law, and adding a cut-off component to the model does not improve the fit and results in a lower limit
of , consistent with what has been found by previous missions.
A preliminary analysis of a 250 ks INTEGRAL observation in January 2004 (revolution 149 and 150)
confirms the lack of a cut-off below 150 keV.
Hard X-ray variability on time scales of a day, observed in BeppoSAX and RXTE data,
is confirmed by a 20% flux decrease within 2 days detected by INTEGRAL in March 2003.
NGC 6300 is the weakest source in our sample with a flux ,
2 times lower than during BeppoSAX observations in 1999.
This low state can be expected in the frame proposed by Guainazzi 2002 in which NGC 6300
represents a case of a transient AGN, undergoing two
periods of low and high activity as seen also in other AGN (e.g. NGC 4051 and Mkn 3).
The double nature of the Compton-thin and Compton-thick object (Guainazzi 2002, Leighly et al. 1999)
cannot be studied with the INTEGRAL data available to date.
Longer exposure time and a spectrum which extends also below 20 keV are necessary to study these behaviours.
In agreement with the results found in BeppoSAX data (Guainazzi 2002 and this work),
the ISGRI spectrum does not reveal the presence of a high energy cut-off up to 150 keV.
Centaurus A is peculiar among AGN as it has been classified as a low luminosity
Fanaroff-Riley I galaxy (Fanaroff & Riley 1974), a misdirected BL Lac object (Morganti et al. 1992) and a
Seyfert 2 object (Dermer & Gehrels 1995).
The spectrum of Centaurus A in the X-ray band is well represented by a heavily absorbed power law continuum
with an iron line at 6.4 keV, features typical of Seyfert 2 spectra.
In contrast to other Seyfert 2 galaxies, the iron line is not associated with a strong Compton reflection continuum
(Rothschild et al. 1999, Grandi et al. 2003) and it is thought to be produced in a cold and optically thin
circumnuclear material (Benlloch et al. 2001).
INTEGRAL observations confirm the lack of a Compton reflection, as adding this component does not improve the fits and results
in a reflection fraction 0.1.
Only an upper limit can be derived from JEM-X data for the fluorescence iron line at 6.4 keV, with a flux an order of
magnitude above the values found in the literature (Grandi et al. 2003, Rothschild et al. 1999).
The absorption has been found to assume values from (Benlloch et al. 2001)
to (Turner et al. 1997), range in which also INTEGRAL results are placed.
Centaurus A is known to be a highly variable object on both long and short time scales (Jourdain et al. 1993).
Within 10 months, the hard X-ray flux of Centaurus A has changed by a factor of in INTEGRAL data.
The flux variation is associated with spectral variation,
which can be modelled equally well by an increase by a factor of
2 of the absorption or by the presence of a high energy cut-off at 120 keV in the low state spectrum.
Variations of the absorption are a common characteristic in
Seyfert 2 galaxies, with changes of 20–80% on a one year time scales (Risaliti et al. 2002). Small variations of
( 30%) have been already observed for Centaurus A in BeppoSAX (Grandi et al. 2003) and RXTE data (Benlloch et al. 2001).
It should be also taken into account that
the flux decrease of an unknown or unresolved component in the soft X-ray band can mimick
an increase of the absorption (Grandi et al. 2003).
The ratio between the high and low state spectra shows an increase at energies above 80 keV consistent with the presence of a cut-off at 122 keV,
which is however an unusual feature for Centaurus A.
Hints for a break or a cut-off in the hard X-ray and soft -ray spectra have been found by OSSE, BeppoSAX, and
RXTE data (Steinle et al. 1998, Grandi et al. 2003, Benlloch et al. 2001),
but these studies place this feature in the 300–700 keV range.
The high energy cut-off combined with the other characteristics of this object (iron line feature, lack of reflection,
lack of correlation between continuum and iron line variability) suggests the presence of a hot, thick and optically thin
accretion flow in the nucleus of Centaurus A (Grandi et al. 2003).
7 Conclusions
The spectral characteristics of our INTEGRAL sample can be generally summarized as follows:
a hard X-ray continuum emission described by a power law
with a wide range of photon indices () and, in the case of Circinus
and Centaurus A the presence of a high energy cut-off.
The average photon index obtained from INTEGRAL spectra is consistent
with the values found for other samples of Seyfert 2 galaxies in BeppoSAX
(Risaliti 2002, Deluit & Courvoisier 2003, Malizia et al. 2003 and this work),
OSSE (Zdziarski et al. 2000) and Ginga (Smith & Done 1996) data.
Only in certain cases adding a high energy cut-off to the fit model improves the results for average
spectra (Zdziarski et al. 2000, Malizia et al. 2003), while in others no cut-off is required, suggesting
a wide range for the energy of this feature (Deluit & Courvoisier 2003).
Studies of single objects confirm that
the cut-off in the 100–300 keV range is not a universal characteristic of all Seyfert 2 (Risaliti 2002),
and the results for our sample support these findings.
INTEGRAL confirms the presence of a cut-off at 50 keV for the Circinus galaxy, a lower limit of 130 keV for
NGC 4945 and the lack of this feature for NGC 6300, in agreement with what has been found in PDS spectra.
A poorly constrained cut-off at 120 keV has been detected for Centaurus A during the INTEGRAL low state,
but this feature has not been seen in the other INTEGRAL observations reported in this work and in the PDS spectrum.
Cut-offs below 100 keV have been found for MCG–05–23–16 and ESO 103–G35 by PDS, but could not be studied
by INTEGRAL because of the short exposure time of those observations.
The cut-off energy in AGN is an important parameter for the models of the cosmic X-ray background (XRB).
Consistent results have been achieved for example by the models of Gilli et al. 1999 and Treister & Urry 2005, in which a high energy cut-off at
300 keV has been assumed.
The existence of AGN with a cut-off at significantly lower energies should be taken into account in order to more accurately estimate
the contribution of the AGN to the XRB at energies where
the choice of this parameter is more relevant (Treister & Urry 2005).
Examples for these AGN are the Circinus galaxy, ESO 103–G35 and MCG–05–23–16 with cut-off energies in the
30–60 keV range, found by INTEGRAL and BeppoSAX.
It would be important to investigate if this type of objects constitutes only extreme cases or the
prototypes of a population with an cut-off energy below 100 keV.
In spite of the fact that the power law and the cut-off power law are phenomenological models,
the detection of a cut-off provides physical information about the presence of the Comptonization in a source.
Moreover, the presence of a cut-off in Seyfert 2 galaxies associated with the observation of Polarized Broad Lines (PBL)
could be an indication that these objects have a ”Seyfert 1 nucleus” and then
a hidden Broad Line Region, whereas the objects without PBL
could have nuclear properties intrinsically different from those of Seyfert 1 (Antonucci & Miller 1985, Tran 1995).
In fact a comparison between two samples of these Seyfert 2 subclasses (with and without PBL) and a sample of Seyfert 1
show that Seyfert 2 with PBL present
characteristics similar to those of Seyfert 1, i.e. the presence of a cut-off and the hardness of the spectrum (Deluit 2004).
More meaningful physical models, like Comptonization or reflection are too complex to be adequately constrained by the low
signal-to-noise data we have up to now.
INTEGRAL has already detected 38 AGN (up to January 2004, Beckmann et al. 2005b), among which there are 15 Seyfert 2 galaxies
and further INTEGRAL observations, both pointed and during regular scans of the Galactic Plane, will allow to investigate deeper
the primary nuclear emission of Seyfert 2, as already done for a number of AGN
(Courvoisier et al. 2003a, Beckmann et al. 2004, Pian et al. 2005, De Rosa et al. 2005, Beckmann et al. 2005a),
and to compare their characteristics with those of Seyfert 1 objects.
Acknowledgements.
We thank L. Piro to have encouraged the development of this work and C. Shrader for proof-reading of the manuscript. We would like to thank also the referee E. Pian for the valuable suggestions which helped us to improve the paper.References
- Antonucci & Miller (1985) Antonucci, R. R. J. & Miller, J. S. 1985, ApJ, 297, 621
- Arnaud (1996) Arnaud, K. A. 1996, in ASP Conf. Ser. 101: Astronomical Data Analysis Software and Systems V, 17
- Attié et al. (2003) Attié, D., Cordier, B., Gros, M., et al. 2003, A&A, 411, L71
- Bassani et al. (2004) Bassani, L., Malizia, A., Stephen, J., et al. 2004, Proceedings of the 5th INTEGRAL Workshop, ESA SP-552, p.139, [astro-ph/0404442]
- Beckmann et al. (2004) Beckmann, V., Gehrels, N., Favre, P., et al. 2004, ApJ, 614, 641
- Beckmann et al. (2005a) Beckmann, V., Gehrels, N., Shrader, C. R., et al. 2005a, accepted by ApJ, [astro-ph/0508327]
- Beckmann et al. (2005b) Beckmann, V., Shrader, C. R., Gehrels, N., & Soldi, S. 2005b, submitted to ApJ
- Benlloch et al. (2001) Benlloch, S., Rothschild, R. E., Wilms, J., et al. 2001, A&A, 371, 858
- Bird et al. (2004) Bird, A. J., Barlow, E. J., Bassani, L., et al. 2004, ApJ, 607, L33
- Chiappetti & dal Fiume (1997) Chiappetti, L. & dal Fiume, D. 1997, in Data Analysis in Astronomy IV, 101
- Courvoisier et al. (2003a) Courvoisier, T. J.-L., Beckmann, V., Bourban, G., et al. 2003a, A&A, 411, L343
- Courvoisier et al. (2003b) Courvoisier, T. J.-L., Walter, R., Beckmann, V., et al. 2003b, A&A, 411, L53
- De Rosa et al. (2005) De Rosa, A., Piro, L., Tramacere, A., et al. 2005, A&A, 438, 121
- Deluit & Courvoisier (2003) Deluit, S. & Courvoisier, T. J.-L. 2003, A&A, 399, 77
- Deluit (2004) Deluit, S. J. 2004, A&A, 415, 39
- Dermer & Gehrels (1995) Dermer, C. D. & Gehrels, N. 1995, ApJ, 447, 103
- Di Cocco et al. (2003) Di Cocco, G., Caroli, E., Celesti, E., et al. 2003, A&A, 411, L189
- Diehl et al. (2003) Diehl, R., Baby, N., Beckmann, V., et al. 2003, A&A, 411, L117
- Done et al. (2003) Done, C., Madejski, G. M., Życki, P. T., & Greenhill, L. J. 2003, ApJ, 588, 763
- Done et al. (1996) Done, C., Madejski, G. M., & Smith, D. A. 1996, ApJ, 463, L63
- Fanaroff & Riley (1974) Fanaroff, B. L. & Riley, J. M. 1974, MNRAS, 167, 31P
- Fishman et al. (1992) Fishman, G. J., Meegan, C. A., Wilson, R. B., Paciesas, W. S., & Pendleton, G. N. 1992, in The Compton Observatory Science Workshop, 26–34
- Frontera et al. (1997) Frontera, F., Costa, E., dal Fiume, D., et al. 1997, A&AS, 122, 357
- Gilli et al. (1999) Gilli, R., Risaliti, G., & Salvati, M. 1999, A&A, 347, 424
- Grandi et al. (2003) Grandi, P., Fiocchi, M., Perola, C. G., et al. 2003, ApJ, 593, 160
- Guainazzi (2002) Guainazzi, M. 2002, MNRAS, 329, L13
- Guainazzi et al. (1999) Guainazzi, M., Matt, G., Antonelli, L. A., et al. 1999, MNRAS, 310, 10
- Guainazzi et al. (2000) Guainazzi, M., Matt, G., Brandt, W. N., et al. 2000, A&A, 356, 463
- Haardt & Maraschi (1993) Haardt, F. & Maraschi, L. 1993, ApJ, 413, 507
- Hammersley et al. (1992) Hammersley, A. P., Ponman, T. J., & Skinner, G. K. 1992, NIMS, 311, 585
- Johnson et al. (1993) Johnson, W. N., Kinzer, R. L., Kurfess, J. D., et al. 1993, ApJS, 86, 693
- Jourdain et al. (1993) Jourdain, E., Bassani, L., Roques, J. P., et al. 1993, ApJ, 412, 586
- Lebrun et al. (2003) Lebrun, F., Leray, J. P., Lavocat, P., et al. 2003, A&A, 411, L141
- Leighly et al. (1999) Leighly, K. M., Halpern, J. P., Awaki, H., et al. 1999, ApJ, 522, 209
- Lund et al. (2003) Lund, N., Budtz-Jørgensen, C., Westergaard, N. J., et al. 2003, A&A, 411, L231
- Madejski et al. (2000) Madejski, G., Życki, P., Done, C., et al. 2000, ApJ, 535, L87
- Malizia et al. (2003) Malizia, A., Bassani, L., Stephen, J. B., et al. 2003, ApJ, 589, L17
- Mas-Hesse et al. (2003) Mas-Hesse, J. M., Giménez, A., Culhane, J. L., et al. 2003, A&A, 411, L261
- Masetti et al. (2004) Masetti, N., Palazzi, E., Bassani, L., Malizia, A., & Stephen, J. B. 2004, A&A, 426, L41
- Matsumoto et al. (2004) Matsumoto, C., Nava, A., Maddox, L. A., et al. 2004, ApJ, 617, 930
- Matt et al. (1999) Matt, G., Guainazzi, M., Maiolino, R., et al. 1999, A&A, 341, L39
- Mattson & Weaver (2004) Mattson, B. J. & Weaver, K. A. 2004, ApJ, 601, 771
- Morganti et al. (1992) Morganti, R., Fosbury, R. A. E., Hook, R. N., Robinson, A., & Tsvetanov, Z. 1992, MNRAS, 256, 1P
- Paul et al. (1991) Paul, J., Ballet, J., Cantin, M., et al. 1991, Advances in Space Research, 11, 289
- Pian et al. (2005) Pian, E., Foschini, L., Beckmann, V., et al. 2005, A&A, 429, 427
- Risaliti (2002) Risaliti, G. 2002, A&A, 386, 379
- Risaliti et al. (2002) Risaliti, G., Elvis, M., & Nicastro, F. 2002, PASA, 19, 155
- Rothschild et al. (1999) Rothschild, R. E., Band, D. L., Blanco, P. R., et al. 1999, ApJ, 510, 651
- Rothschild et al. (1998) Rothschild, R. E., Blanco, P. R., Gruber, D. E., et al. 1998, ApJ, 496, 538
- Sazonov et al. (2004) Sazonov, S. Y., Revnivtsev, M. G., Lutovinov, A. A., Sunyaev, R. A., & Grebenev, S. A. 2004, A&A, 421, L21
- Skinner & Connell (2003) Skinner, G. & Connell, P. 2003, A&A, 411, L123
- Smith & Done (1996) Smith, D. A. & Done, C. 1996, MNRAS, 280, 355
- Steinle et al. (1998) Steinle, H., Bennett, K., Bloemen, H., et al. 1998, A&A, 330, 97
- Terrier et al. (2003) Terrier, R., Lebrun, F., Bazzano, A., et al. 2003, A&A, 411, L167
- Tran (1995) Tran, H. D. 1995, ApJ, 440, 565
- Treister & Urry (2005) Treister, E. & Urry, C. M. 2005, accepted by ApJ, [astro-ph/0505300]
- Turner et al. (1997) Turner, T. J., George, I. M., Mushotzky, R. F., & Nandra, K. 1997, ApJ, 475, 118
- Ubertini et al. (2003) Ubertini, P., Lebrun, F., Di Cocco, G., et al. 2003, A&A, 411, L131
- Vedrenne et al. (2003) Vedrenne, G., Roques, J.-P., Schönfelder, V., et al. 2003, A&A, 411, L63
- Wilkes et al. (2001) Wilkes, B. J., Mathur, S., Fiore, F., Antonelli, A., & Nicastro, F. 2001, ApJ, 549, 248
- Winkler et al. (2003a) Winkler, C., Courvoisier, T. J.-L., Di Cocco, G., et al. 2003a, A&A, 411, L1
- Winkler et al. (2003b) Winkler, C., Gehrels, N., Schönfelder, V., et al. 2003b, A&A, 411, L349
- Zdziarski et al. (1995) Zdziarski, A. A., Johnson, W. N., Done, C., Smith, D., & McNaron-Brown, K. 1995, ApJ, 438, L63
- Zdziarski et al. (2000) Zdziarski, A. A., Poutanen, J., & Johnson, W. N. 2000, ApJ, 542, 703