address=Istituto Nazionale di Fisica Nucleare - Sezione di Napoli
Complesso Universitario di Monte Sant’Angelo, Via Cintia, 80126 - Napoli
Ultrahigh Energy Cosmic Rays Detection
Abstract
The paper describes methods used for the detection of cosmic rays with energies above 1018 eV (UHECR, UltraHigh Energy Cosmic Rays). It had been anticipated there would be a cutoff in the energy spectrum of primary cosmic rays around 3 eV induced by their interaction with the 2.7 ∘K primordial photons. This has become known as the GZK cutoff. However, several showers have been detected with estimated primary energy exceeding this limit.
Keywords:
Cosmic Ray, Ground Array, Fluorescence Detectors, P. Auger Observatory:
96.40.Pq, 96.40.De, 95.55.Vj1 Introduction
UHECRs form the tail of the cosmic-ray spectrum, which extends from 1 GeV to beyond eV Watson . Their energy is equivalent to that of a tennis ball moving at 100 km/h and their flux is about once a year every 100 km2 of the earth’s surafce. Because of their rarity we know relatively little about them; in particular, we do not understand how or where these particles gain their remarkable energies. The prediction of the existence of the Greisen-Zatsepin-Kuzmin (GZK) cut-off GZK for particles with energy above 3 eV has been faulted with the detection of several showers generated by a primary particles with energy well beyond eV Cris .
In this paper methods used for UHECR detection will be described.
Moreover first results of P. Auger Observatory (PAO) will be shown.
This experiment Auger has been conceived to measure
the properties of the highest-energy cosmic rays with
unprecedented statistical precision.
The PAO detects ultra-high energy cosmic rays by
implementing two complementary airshower techniques:
the combination of a large ground array and fluorescence detectors.
This hybrid observation of events allows a rich variety of measurements
on a individual shower, providing much more
information than with either detector alone.
The complete observatory
will consist of two instruments, constructed in
the northern and southern hemispheres, each covering
an area of 3000 km2.
2 Detection techniques
Currently UHECRs are investigated using two different detection methods. The first method consists on the distribution of a number of particle counters across a large area allowing detection of particles which survive to the detection level. The other method exploits the excitation of nitrogen molecules by the particles in the shower and the associated fluorescence emission of light in the 300-400 nm band. The light is detected by photomultipliers and the profile of the shower in the atmosphere can be inferred rather directly.
2.1 UHECR detection with ground arrays
An air shower produces a large number of particles spread out over a large area at the observation level. Particles are detected with an array of detectors deployed over an appropriate area of many square kilometers. The separation of detectors is typically many hundreds of meters. The density of charged particle and their arrival time are measured at each detector location. These informations allow the reconstruction of shower axis and shower core (the impact point of the axis on the ground) by fitting the station signal size to expected lateral distribution function (LDF). The primary energy is estimated by a local charged particle density at fixed distance from the core in meters (core distance) which depend by the array size. For example in the AGASA array was used s600 ; Agasa and in the PAO is used AugerIcrc . All of the arrays built to detect cosmic rays above 1019 eV have been located between 800 g cm-2 and sea level. This is appropriate, as the average maximum depth of showers of these primaries is about 750 g cm-2 and it is effective to study showers close to or beyond shower maximum. The shower disc has a thickness that increases from a few nanoseconds close to the shower core up to several microseconds at distances beyond 1 km. The accuracy of the timing measurement is only one of the factors that limit the directional precision: a second is the area of the detector. With giant arrays the arrival direction has been measured to an accuracy of between 0.5∘ and 5∘.
2.2 Detection with fluorescence detectors
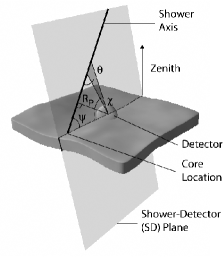
The first successful implementation of the fluorescence technique was obtained by the Fly’s Eye group Bird . The fluorescence detector follows the trajectory of an extensive air shower and measures the energy dissipated by shower particles in the atmosphere that acts as an air calorimeter of more than 1010 tons. For this purpose, the whole sky is viewed by many segmented mirrors focusing the collected fluorescence light emitted isotropically along the trajectory of the shower on a photomultiplier matrix. Correlation between the light intensity and light arrival time detected in each PMT provides unambiguous information on energy released and shower path in the atmosphere. The shower detector plane (SDP), defined in Figure 1, is constructed from sequence of hit photomultipliers. Then the distance to the shower axis (impact parameter) Rp and incident angle in the plane are determined by fitting the time sequence of several photomultiplier signals. Once the track geometry is determined, the number of photons Nγ received by a photomultiplier is calculated. Since there is also contamination from direct and scattered Cerenkov light, the longitudinal size Ne(x) of the extensive air shower for each angular bin is calculated via an iterative process to remove those contributions which depend upon the viewing angle between the pointing direction of the photomultiplier and the shower axis. The resultant photoelectrons are directly proportional to the number of charged particles in the angular bin. From the integration, Ne(x)dx , the total track length is estimated. If a shower is seen simultaneously by two fluorescence detectors (stereo event), a shower detector plane for each one can be determined and the intersection of these planes defines the shower trajectory without timing information. The total track length can also be determined independently by each detector.
2.3 AGASA and HiRes Experiment
As an example of the two techniques above described AGASA Agasa2 and
HiReS HiRes Experiment are discussed.
AGASA was operated at the Akeno Observatory (Tokyo), the operation had been
started in February 1990 and was closed in January 2004 with an 95%
overall live ratio.
In an km2 area 111 detector stations were deployed.
Each station was equipped with 2.2 m2 surface detector
with a 5 cm-thick scintillator viewed by a PMT.
At 27 southern stations muon detectors were built. They consisted
of 14–20 proportional counters aligned below an absorber
(30 cm-thick iron or 1 m-thick concrete: 0.5 GeV threshold energy for
vertical incidence).
The primary energy was estimated by a local charged particle density at
600 m from the core, known as :
.
The error of primary energy determination is
at eV and at
eV.
The exposure of AGASA is almost constant above eV and
is m2 sr s.
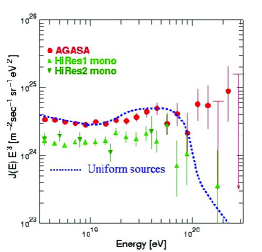
Figure 2 shows the energy spectrum of UHECRs above
eV err . The vertical axis denotes
the differential flux multiplied by . Poisson bounds are
given at a confidence level (CL) of 68%. Upper limits are given
at a 90% CL. The dashed curve represents the expected flux by
the GZK hypothesis for the uniform source distribution yat .
The most noticeable feature is the observation of cosmic rays beyond the GZK
cutoff energy. Eleven events were detected above
eV against the expected events Agasa2 .
HiRes Experiment have two detectors located atop desert mountains
in west central Utah.
The detectors consist of mirrors that collect fluorescence
light and focus it on arrays of 256 hexagonal photomultiplier tubes
(PMT’s). Each PMT subtends about one degree of sky. The HiRes-I
detector consists of 21 mirrors arranged to look from 3 to 17 degrees
in elevation and almost 360 degrees in azimuth. The HiRes-II
detector, located 12.6 km SW of HiRes-I, consists of 42 mirrors, which
cover 3 to 31 degrees in elevation and almost 360 degrees in azimuth.
The spectrum of the HiRes-I and HiRes-II detectors, observing in
monocular mode are shown in Figure 2 where a marked deficit
of events above eV can be noted.
This energy is the threshold for pion
production in interactions between cosmic ray protons and the average
photon of the CMBR; i.e., the deficit occurs at the energy of the GZK
cutoff. On the contrary the results of the AGASA experiment seem to indicate
that the spectrum continues above the ankle at a constant power law.
To test whether HiRes data are consistent with this interpretation of
the Agasa result, the HiRes data were fit, from the ankle to the pion
production threshold, to a power law, then continue the power law to
higher energies. This tests the hypothesis that the GZK cutoff is
absent, as the AGASA data seem to show. The power law index is . If the cutoff were absent HiRes expect to see 29.0 events
above eV, while only 11 event have been seen.
The Poisson probability of seeing 11 or fewer events,
with a mean of 29.0, is HiRes .
3 Pierre Auger Observatory
The PAO was designed to observe, in coincidence, the shower particles at ground and the associated fluorescence light generated in the atmosphere. This is achieved with a large array of water Cherenkov detectors coupled with air-fluorescence detectors (eyes) that overlook the surface array. It is not simply a dual experiment. Apart from important cross-checks and measurement redundancy, the two techniques see air showers in complementary ways. The surface detector (SD) measures the lateral structure of the shower at ground level, with some ability to separate the electromagnetic and muon components. On the other hand, the fluorescence detector (FD) records the longitudinal profile of the shower during its development through the atmosphere. A hybrid event is an air shower that is simultaneously detected by the fluorescence detector and the ground array. Data are recovered from both detectors whenever either system is triggered. The Observatory started operation in hybrid production mode in January, 2004. Surface stations have a 100% duty cycle while fluorescence eyes can only operate on clear moonless nights. Both surface and fluorescence detectors have been running simultaneously 14% of the time. The SD accumulated aceptance is larger than 1600 km2 sr yr while the FD aceptance is 14% of the SD due to the limited duty cycle Matthews . The number of hybrid events represents 10% the statistics of the surface array data. The southern site of the Pierre Auger Cosmic Ray Observatory in Argentina now covers an area of approximately 1500 km2 with an explosure of 1750 km2 sr yr and a full efficiency above 3 EeV for zenith angles less than 60∘ Parizot . Two of the Auger fluorescence detector sites (Los Leones and Coihueco) have been operating in a stable manner since January 2004 and a third site (Los Morados) began operation in March 2005.
3.1 The Hybrid Performance and Measurements
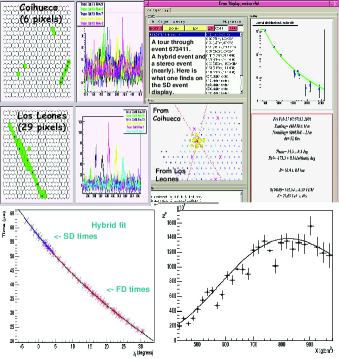
A hybrid detector has excellent capability for studying the highest energy cosmic ray air showers. Much of its capability stems from the accurate geometrical reconstructions it achieves. Timing information from even one surface station can much improve the geometrical reconstruction of a shower over that achieved using only eye pixel information. The reconstruction accuracy is better than the ground array counters or the single eye could achieve independently. A core location resolution of 50 m is achieved. The resolution for the arrival direction of cosmic rays is 0.6∘ Bonifazi . Due to the much improved angular accuracy, the hybrid data sample is ideal for anisotropy studies and, in particular, for point source searches. The combination of the air fluorescence measurements and particle detections on the ground provides an energy measurement almost independent of air shower simulations. The fluorescence measurements determine the longitudinal development of the shower, whose integral is proportional to the total energy of the electromagnetic particle cascade. At the same time, the particle density at any given distance from the core can be evaluated with the ground array. It is important to note that both techniques have different systematics, and results are preliminary at this stage while the Observatory is under construction. The hybrid analysis benefits from the calorimetry of the fluorescence technique and the uniformity of the surface detector aperture. Operation started in January, 2004 and over 16000 hybrid events have been successfully reconstructed up to now Mostafa . An example of hybrid and stereo (two FD eyes) event with an energy of 21 Eev is reported in Figure 3.
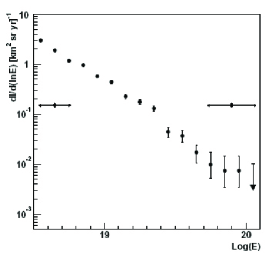
3.2 The first AUGER energy spectrum and Anisotropy Studies
The methods to calculate the cosmic ray energy spectrum are simple and robust, exploiting the combination of FD and SD. The methods do not rely on detailed numerical simulation or any assumption about the chemical composition. The spectrum in Figure 4 is only a first estimate and is related with data from 1 Jan 2004 through 5 Jun 2005 Sommers . Events are included for zenith angle 0-60∘ and for energies above 3 EeV, in total 3525 events. It has significant systematic and statistical uncertainties. The indicated statistical error for each point comes directly from the Poisson uncertainty in the number of measured showers in that logarithmic energy bin. There is larger systematic uncertainty in the conversion of S(1000) to energy. Part of that comes from the FD energies themselves. The accuracy is limited by the available statistics, and the total systematic energy uncertainty grows with energy: from 30% at 3 EeV to 50% at 100 EeV. This uncertainty is indicated by horizontal double arrows in Figure 4, and a 10% systematic uncertainty in the exposure is indicated by vertical arrows.
The Auger data have been analyzed to search for excesses of events near the direction of the galactic center in several energy ranges around EeV energies Selvon . In this region the statistics accumulated by the Observatory are already larger than that of any previous experiment. Using both the data sets from the surface detector and hybrid data sets any significant excess is find. These results do not support the excesses reported by AGASA and SUGAR experiments. An upper bound on the flux of cosmic rays arriving within a few degrees from the galactic center in the energy range from 0.8-3.2 EeV is set: @ 95% CL with in [1.0-4.0] Selvon . Also the search for correlations of cosmic ray arrival directions with the galactic plane and with the super-galactic plane at energies in the range 1-5 EeV and 12 above 5 EeV found no significant excess Selvon .
References
- (1) M. Nagano and A.A. Watson, Rev. Mod. Phy., 72 (2000)
- (2) Greisen, K., Phys. Rev. Lett., 16 (1966) 748; Zatsepin, Z.T. and Kuz’min, V.A., Pisma Zh. Eksp. Teor. Fiz. 4 (1966)
- (3) C. Aramo(ed.) et al.,”GZK and Surroundings” CRIS 2004 Nucl. Phys. B (Proc. Suppl.) 136 (2004) 1-453
- (4) The AUGER Coll., NIM A523 (2004) 50-95
- (5) Hillas, A.M. et al., 12th ICRC (Australia) 3 (1971) 1001
- (6) H.Y. Dai et al., J. Phys. G 14 (1988) 793
- (7) P. Ghia for AUGER Coll., 29th ICRC (India) (2005)
- (8) D. Bird et al., NIM A349 (1994) 592
- (9) Agasa Coll., Nucl. Phys. B (Proc. Suppl.) 136 (2004) 18
- (10) G. Thomson, Nucl. Phys. B (Proc. Suppl.) 136 (2004) 28
- (11) Takeda, M. et al., Astropart. Phys. 19 (2003) 447
- (12) Glushkov, A.V. et al., 28th ICRC (Japan) (2003) 389
- (13) J. Matthews for AUGER Coll., 29th ICRC (India) (2005)
- (14) E. Parizot for AUGER Coll., 29th ICRC (India) (2005)
- (15) C. Bonifazi for AUGER Coll., 29th ICRC (India) (2005)
- (16) M. Mostafa for AUGER Coll., 29th ICRC (India) (2005)
- (17) P. Sommers for AUGER Coll., 29th ICRC (India) (2005)
- (18) A. Selvon for AUGER Coll., 29th ICRC (India) (2005)