Spectroscopic abundance analysis of dwarfs in young open cluster IC 4665
Abstract
We report a detailed spectroscopic abundance analysis for a sample of 18 F-K dwarfs of the young open cluster IC 4665. Stellar parameters and element abundances of Li, O, Mg, Si, Ca, Ti, Cr, Fe and Ni have been derived using the spectroscopic synthesis tool SME (Spectroscopy Made Easy). Within the measurement uncertainties the iron abundance is uniform with a standard deviation of 0.04 dex. No correlation is found between the iron abundance and the mass of the stellar convective zone, and between the Li abundance and the Fe abundance. In other words, our results do not reveal any signature of accretion and therefore do not support the scenario that stars with planets (SWPs) acquire their on the average higher metallicity compared to field stars via accretion of metal-rich planetary material. Instead the higher metallicity of SWPs may simply reflect the fact that planet formation is more efficient in high metallicity environs. However, since that many details of the planet system formation processes remain poorly understood, further studies are needed for a final settlement of the problem of the high metallicity of SWPs.
The standard deviation of [Fe/H] deduced from our observations, taken as an upper limit on the metallicity dispersion amongst the IC 4665 member stars, has been used to constrain proto-planetary disk evolution, terrestrial and giant planets formation and evolution processes. The total reservoir of heavy elements retained by the nascent disks is limited and high retention efficiency of planet building material is supported. Under modest surface density, gas giant planets are expected to form in locally enhanced regions or start efficient gas accretion when they only have a small core of a few . Our results do not support the possibility that the migration of gas giants and the circularization of terrestrial planets’ orbits are regulated by their interaction with a residual population of planetesimals and dust particles.
Subject headings:
Galaxy: Open Clusters and Associations: Individual: IC 4665 – Stars: Planetary Systems: Formation – Stars: Planetary Systems: Protoplanetary Disks – Stars: Abundances1. Introduction
Since the first report of an extrasolar planet orbiting a solar-type star in 1995 (Mayor & Queloz 1995), over one hundred planetary systems have been discovered. Two competing scenarios of planet formation and evolution are gravitational instability and core accretion-gas capture. The theories can be discriminated and tested by studying the observed properties of extra solar planetary systems (see e.g. review by Bodenheimer & Lin 2002). A key property of stars with planets (SWPs) that has emerged from the extensive observations hitherto has been that the metal abundance of SWPs is on the average about 0.25 dex higher than those of typical control sample stars (Laws et al. 2003) and that the frequency of planets is a strong function of the metallicity of the host star (Santos et al. 2004; Fischer et al. 2004). Two possible explanations have been put forward: either planets form preferentially around stars rich in heavy elements or the observed overabundance is caused by enrichment as a result of accretion of H-deficient planetary material onto the stellar photosphere (Gonzalez 1997).
In contrast to Jupiter and Saturn, a number of extra solar planets are found to have orbital periods of several days. Orbital migration predicted by the current models of planet formation has been invoked to explain the occurrence of close-in giant planets found by radial velocity surveys (e.g., Lin, Bodenheimer & Richardson 1996). As the planet migrates, it scatters along the way planetesimals in the disk, causing them to fall onto the central star and enrich the stellar surface layer with heavy elements. Scattering amongst planetesimals and angular momentum losing of giant planets, also leads to the bombardment of their host star. Material fallen onto the star is diluted in the convection zone (CZ). Thus depending on the mass of the CZ, a given amount of accreted planetary material will lead to different level of overabundances of the stellar surface layer in heavy elements (see e.g. Gonzalez 1997). For a given spectral type (i.e. initial mass), the CZ mass decreases from the initial value of the entire stellar mass in the early stage of contraction to a fraction as it approaches and passes the zero-age-main-sequence. For solar type stars, the decline of the CZ mass ceases after about 30 Million years, reaching a nominal value of around 0.025 . Accretion of metal-enriched protoplanetary material after this epoch is potentially detectable. Note that for solar type main sequence stars, CZ mass decreases as stellar mass () increases. The time scale for reaching the main sequence also decreases with increasing . For a given mass of protoplanetary material, any signature of the protracted accretion should therefore be more evident in stars of early spectral types.
Open clusters are physically related groups of stars which are believed to form from the same homogeneous large cloud in the Galaxy at almost the identical time. Therefore one expects that stars of a given young cluster should all have the same surface chemical abundances, unless they are altered by some physical processes. These remarkable properties make young clusters excellent testbeds to test the scenario of accretion of H-deficient planetary material as the cause of the high metallicity of SWPs. Signature that accretion has occurred can be revealed by searching for star-to-star variations in metal content. In addition, in this scenario, one expects that the enrichment will be more pronounced in F dwarfs than in stars of later types, since, as discussed above, F-type dwarfs have a smaller CZ.
Several spectroscopic studies aimed at detecting signatures of pollution by accretion of planetary material by measuring the metallicity dispersion in open clusters have been published. Wilden et al. (2002) observed 16 stars in the Pleiades and found evidence indicating possible accretion in one star, which shows an excessive metallicity 0.1 dex above the cluster mean. Paulson et al. (2003) analyzed 55 FGK dwarfs in the Hyades and they found two stars of abundances 0.2 dex in excess of the cluster mean. Unfortunately, the cluster membership of the two stars turns out to be questionable. Similar studies have also been extended to binary or multiple star systems (Laws & Gonzalez 2001; Gratton et al. 2001; Desidera et al. 2004). Gratton et al. (2001) carry out a differential abundance analysis for six main sequence binary systems and found one pair (HD 219542) exhibiting a 0.09 dex iron content difference. A more recent study of this system by Desidera et al. (2004) however shows that the result of Gratton et al. is probably spurious. Laws & Gonzalez (2001) report the detection of a small metallicity difference between the two components of 16 Cyg. Desidera et al. (2004) perform differential abundance analysis for 23 wide binaries. They find that most of the pairs exhibit abundance differences smaller than 0.02 dex and no pairs show differences in excess of 0.07 dex.
Murray et al. (2001) suggest that lithium serves as a good tracer of the mixing depth of the convective zone. 6Li is easily destroyed during the pre-main-sequence evolutionary phase and should therefore be completely absent in main sequence stars. If any 6Li is detected in mature solar type stars, there would be a high probability that it is accreted. The recent claims of detection of 6Li in SWP HD 82943 by Israelian et al. (2001; 2003), are however disputed by Reddy et al. (2002; but see also Israelian et al. 2004a). The absence of 6Li in other SWP’s however suggests such events are rare among mature stars (Mandell et al. 2004). Nevertheless, if 6Li depletes within a few Myr after the planet consumption, this signature would be erased among the main sequence stars. Compared to 6Li, destruction of the more abundant isotope 7Li requires a higher temperature of 2.5 million Kelvin. If the temperature at bottom of the convective envelope exceeds this value, then any 7Li in the envelope will be destroyed as well. For stars with a thick convective zone (type G or later), 7Li is destroyed within a few hundred million years. Stars more massive than late F have much thinner convective envelopes where the base temperatures are generally too low to destroy lithium. Consequently 7Li can survive for a few billion years in those stars. However, in addition to the so-called ”lithium-dip” around 6500 K, generally attributed to some extra mixing mechanism, scatters have also been observed at all other temperatures in many clusters. The cause of the lithium abundance dispersion amongst stars of the same temperature has long been debated. If accretion plays a role in this problem, then one expects that a dispersion in iron abundance should also be observable (Israelian et al. 2004b).
In this paper, we present spectroscopic abundance analysis for a sample of 18 F to early K dwarfs in the open cluster IC 4665, using spectra obtained with the Keck I 10 m telescope. IC 4665 (, deg), at a distance of 350 pc, is a young open cluster, but not so young as the T Tauri stars or other very young associations. Mermilliod (1981a, b) estimates an age of 3– yr and a reddening of . Allain et al. (1996) confirm that the age of IC 4665 is close to Per ( Myr) by studying the rotational periods and star-spot activities of young solar-type dwarfs in IC 4665. The age is particularly meaningful for the current study aimed at detecting possible variations of abundance dispersion with the CZ mass: after this age, the mass of the CZ stays essentially constant for solar mass stars. The star membership of IC 4665 has been studied by Prosser (1993) and Prosser & Giampapa (1994), utilizing astrometric, photometric and spectroscopic data. Being a very young cluster, stellar surface activities in this cluster (starspots, coronal X-ray emission and H emission) have been widely studied (e.g., Allian et al. 1996; Giampapa, Prosser & Fleming 1998; Martín & Montes 1997; Messina et al. 2003). No detailed spectroscopic abundance analysis has been reported, however, except the study of Li abundances in 14 dwarfs by Martín & Montes (1997).
Since clusters are generally far from us, obtaining high quality spectra for large samples of cluster members have only become feasible in recent years with the advent of 10 m class telescopes. Except for Fe and Li, only very restricted measurements of abundances of other elements in cluster stars have been published. Available data include detailed abundance analysis for 12 Hyades stars (Cayrel et al. 1985), 16 Pleiades stars (Wilden et al. 2002), 9 M 34 stars (Schuler et al. 2003), 22 IC 4651 stars (Pasquini et al. 2004) and a few Pleiades and NGC 2264 stars (King et al. 2000). Nevertheless, given that the initial stellar mass is the only variable parameter in a cluster, detailed cluster elemental abundance analysis can potentially not only place strong constraints on the enrichment of the interstellar medium, the star formation history in the disk, but can also provide excellent testbeds for the stellar evolution theory. It is expected that the current work may prove useful for this endeavour by adding a substantial amount of new data.
The observations and data reduction procedures are described in Section 2. Section 3 describes abundance analysis using the spectral synthesis tools SME (Spectroscopy Made Easy) and presents the results. It is followed by an error analysis in Section 4. Abundance dispersions yielded by our observations are discussed in Section 5. The implications of our results on the planet formation processes are discussed in Section 6 and on protoplanetary disk masses in Section 7. We conclude with a brief summary in Section 8.
2. Observation and data reduction
The spectra were obtained in October 1999 and October 2000 using the HiRes spectrograph (Vogt 1992) mounted on the Keck I 10 m telescope. A Tektronix CCD of 24 pixel size was used as the detector. The spectra covered the wavelength range from 6300 to 8730 Å, split into 16 orders, with small inter-order gaps amongst them. The integration time ranged from 10 minutes to half an hour, yielding signal-to-noise ratios from to 150 per resolution element, at a resolving power of about 60,000.
The spectra were reduced using IRAF following the procedures described in Soderblom et al. (1993). The noao.imred.echelle package was used for flat-fielding, scattered light removal and order extraction. Wavelength calibration was achieved using exposures of a Th-Ar lamp.
3. Abundance determinations with SME
Spectral analyses, including determinations of the stellar parameters and elemental abundances, were carried using the software package SME (Spectroscopy Made Easy), originally developed by Valenti & Piskunov (1996). SME determines the basic stellar parameters and elemental abundances by matching the synthesized spectrum to the observed one. It uses Kurucz stellar model atmospheres and solves radiative transfer to create synthetic spectra. A nonlinear least squares algorithm is then used to solve for any subset of the input parameters, including , , radial and rotational velocities, micro- and macro-turbulence velocities and element abundances. The radiative transfer routine in SME assumes LTE and negligible magnetic field, and neglects molecular line opacity. Due to these limitation, the current analysis is limited to stars of spectral types F, G, and early K. Stars of later types have been excluded.
| Parameter | Value |
|---|---|
| 5735 K | |
| 4.44 cm s-2 | |
| [M/H] | 0.0 |
| 0.73 km s-1 | |
| 3.1 km s-1 | |
| 1.60 km s-1 | |
| 2.5 |
Atomic data of spectral lines (, van der Waals damping constants) were initially retrieved from the Vienna Atomic Line Data-base (VALD, Piskunov et al. 1995; Ryabchikova et al. 1999; Kupka et al. 1999;) using the ”stellar” requests with the parameter expected fractional depth set to greater than 0.2 %. Seven spectral segments, each of approximately 20 Å wide, were selected, centered at 6336, 6425, 6490, 6595, 6831, 8435 and 8708 Å. The segments include Fe II and Fe I lines from a broad range of equivalent widths, excitation potentials and values to allow accurate stellar parameters to be derived. Additional segments of widths less than 10 Å were then selected for the purpose of abundance determinations for individual elements, e.g. one centered at 6707 Å for Li, one at 7774 Å for O, and another at 7230 Å for Si, etc.
In the analysis, we have followed the procedures described in Wilden et al. (2002). Firstly a model solar spectrum was created using the atomic data retrieved from the VALD and compared to the high-resolution, high signal-to-noise ratio (SNR) solar spectrum (Kurucz et al. 1984) from the National Solar Observatory (NSO). Bad spectral regions were masked out. We then used the solar spectrum to solve for improved atomic data of spectral lines of interest in the pre-selected spectral segments. The improved atomic data thus obtained were later used to determine basic stellar parameters as well as elemental abundances for our sample stars in IC 4665.
The determination of solar photospheric abundances depends on stellar atmospheric models. In an innovative yet controversial approach, Asplund et al. (2005) have recently published a new solar abundance scale deduced based on a time-dependent, 3D hydrodynamical model of the solar atmosphere. Given that the current work is more interested in the relative abundances (or more precisely the abundance dispersion amongst the cluster members) and the fact that SME uses a 1D stellar atmosphere, we have opted to use the ‘old’ solar abundance scale determined based on the traditional 1D model by Grevesse, Noels & Sauval (1996). The basic stellar parameters of the Sun derived for the SME solar model are listed in Table 1. The parameter in the list refers to the enhancement factor of the van der Waals damping constant. These values were adopted when determining values of spectral lines. To reduce the number of free parameters, the solar surface gravity was fixed at the standard value of 4.44 cm s-2. The overall metallicity parameter, [M/H], was used to interpolate the grid of model atmospheres and to scale the solar elemental abundances (except for elements to be solved) when calculating opacities. In addition to microturbulent velocity , macroturbulent velocity and rotation velocity were also set individually. However, since it is difficult to distinguish the effects of rotation and macroturbulence, especially when fitting line profiles of slowly rotating stars such as the Sun, usually we fixed one parameter and solved for the other. SME ignores stellar surface differential rotation and treats the star as a uniform rotator. The simplification does not pose a problem for slowly rotating stars. After solving the free atomic parameters ( and the van der Waals damping constants), our best fit solar model spectrum yields a Marquardt algorithm value of 180 and a line rms of 0.8 %, compared to the corresponding values of 353 and 1.19 %, respectively, obtained by Wilden et al. (2002).
| Star | (SME) | b | ||||
|---|---|---|---|---|---|---|
| (K) | (cm s-2) | (km s-1) | (km s-1) | (km s-1) | (km s-1) | |
| P 19 | 6370 | 4.435 | 0.26 | 4.54 | 5.20 | 10 |
| P 147 | 6189 | 4.490 | 1.02 | 3.97 | 4.21 | * |
| P 39d | 5867 | 4.503 | 1.25 | 3.85 | 13.6 | 15 |
| P 107 | 5626 | 4.560 | 0.68 | 3.36 | 30.3 | 27 |
| P 150d | 5535 | 4.572 | 1.62 | 3.35 | 26.6 | 25 |
| P 151 | 5494 | 4.583 | 1.46 | 3.15 | 12.4 | * |
| P 60 | 5483 | 4.583 | 1.27 | 3.15 | 9.83 | 13 |
| P 199 | 5168 | 4.641 | 0.57 | 2.55 | 3.17 | * |
| P 75d | 5347 | 4.465 | 1.60 | 3.10 | 14.1 | 16 |
| P 165 | 5292 | 4.594 | 1.56 | 3.05 | 31.8 | 40 |
| P 267 | 5286 | 4.650 | 0.43 | 2.41 | 1.92 | * |
| P 64 | 5267 | 4.618 | 0.95 | 2.81 | 3.32 | * |
| P 71d | 5251 | 4.604 | 1.55 | 2.96 | 14.6 | 17 |
| P 94 | 5168 | 4.640 | 0.87 | 2.54 | 4.89 | 10 |
| P 100d | 4913 | 4.654 | 1.46 | 0.00 | 16.9 | 21 |
| P 332 | 4989 | 4.660 | 0.76 | 0.00 | 2.34 | * |
| P 349 | 4917 | 4.662 | 0.57 | 0.00 | 3.89 | * |
| P 352 | 5105 | 4.658 | 0.87 | 0.00 | 4.30 | * |
-
a
Calculated using Eq. (16.2) in Gray (1992); b Calculated using the relation given in Fischer & Valenti (2003) for stars of K. For cooler stars, the values are set to zero; c From Prosser & Giampapa (1994); d Variable star (c.f. The 73rd Name-list of Variable Stars, Kazarovets & Samus 1997).
| Star | Li | Li(MM)a | O | Mg | Si | Ca | Ti | Cr | Fe | Ni |
|---|---|---|---|---|---|---|---|---|---|---|
| Sunb | 1.16 | * | 8.87 | 7.58 | 7.55 | 6.36 | 5.02 | 5.67 | 7.50 | 6.25 |
| P 19 | 3.19 | * | 8.61 | 7.59 | 7.55 | 6.24 | 4.84 | 5.82 | 7.51 | 6.30 |
| P 147 | 2.64 | * | 8.95 | 7.59 | 7.56 | 6.35 | 5.01 | 5.68 | 7.51 | 6.24 |
| P 39 | 3.02 | * | 8.84 | 7.54 | 7.55 | 6.40 | 5.11 | 5.61 | 7.50 | 6.17 |
| P 107 | 3.03 | 3.0 | 9.38 | 7.54 | 7.42 | 6.36 | 4.93 | 5.59 | 7.51 | 6.16 |
| P 150 | 3.19 | 3.1 | 9.22 | 7.91 | 7.32 | 6.54 | 5.23 | 5.64 | 7.46 | 6.13 |
| P 151 | 3.01 | * | 9.04 | 7.81 | 7.57 | 6.49 | 5.11 | 5.58 | 7.50 | 6.16 |
| P 60 | 3.02 | * | 8.98 | 7.55 | 7.63 | 6.42 | 5.13 | 5.69 | 7.50 | 6.19 |
| P 199 | 1.51 | * | 9.09 | 7.57 | 7.49 | 6.18 | 5.56 | 5.59 | 7.43 | 6.39 |
| P 75 | 3.33 | 3.3 | 9.33 | 7.54 | 7.84 | 6.51 | 5.10 | 5.50 | 7.51 | 6.13 |
| P 165 | 3.03 | 3.1 | 9.10 | 7.42 | 7.39 | 6.52 | 5.27 | 5.72 | 7.47 | 6.19 |
| P 267 | * | * | 8.84 | 7.57 | 7.61 | 6.32 | 5.38 | 5.76 | 7.42 | 6.36 |
| P 64 | * | * | 9.02 | 7.46 | 7.41 | 6.17 | 5.40 | 5.82 | 7.40 | 6.37 |
| P 71 | 2.96 | 3.1 | 9.51 | 7.67 | 7.81 | 6.52 | 5.27 | 5.48 | 7.51 | 6.17 |
| P 94 | 1.44 | 2.1 | 8.67 | 7.56 | 7.49 | 6.50 | 5.18 | 5.60 | 7.47 | 6.18 |
| P 100 | 2.66 | 2.8 | 9.87 | 7.41 | 7.93 | 6.48 | 5.25 | 5.54 | 7.48 | 6.27 |
| P 332 | * | * | 9.83 | 7.74 | 7.86 | 6.14 | 5.34 | 5.56 | 7.51 | 6.59 |
| P 349 | * | * | 9.67 | 7.44 | 7.94 | 6.17 | 5.23 | 5.57 | 7.41 | 6.50 |
| P 352 | * | * | 9.50 | 7.68 | 7.75 | 6.23 | 5.33 | 5.48 | 7.43 | 6.48 |
-
a
From Martín & Montes (1997); b From Grevesse, Noels & Sauval (1996)

Note that because the strength of an absorption line depends not only on the stellar surface chemical composition, but also on the excitation conditions as well as on other stellar properties that affect the line profile, as one moves from one star to another of a different spectral type, some lines strengthen while others weaken, some new lines appear while some others disappear. Thus the spectral line atomic data that we have determined by fitting the solar spectrum, when applied to stars of other spectral types, may introduce some errors in the results. However, for the limited range of spectral types covered in the current study, this problem is not expected to be serious, especially considering that we are more interested in the differential abundances, rather than in the absolute elemental abundances.
Once the atomic data of spectral lines of interest have been determined by fitting the solar spectrum, they are used to solve stellar parameters and element abundances of target stars. In order to reduce the degeneracy amongst the stellar global parameters, and macroturbulent velocity were not optimized. Instead, we calculated using Eq. (16.2) of Gray (1992) and estimated using the formula given in Fischer & Valenti (2003). However, it is found that in some slow rotating late type stars, adopting thus obtained leads to negative values of . To avoid such unphysical situation happening, we arbitrarily set to zero for all stars of lower than 5000 K.
A total of 33 stars were observed. Amongst them, one is later found to be a double-line spectroscopic binary and two actually do not belong to IC 4665. In addition, 12 stars in the sample are found to have color temperatures lower than 4800 K. For these very cool stars, line blending becomes increasingly problematic. Kurucz atmospheric models for such cool stars are also known to be inadequate. We have therefore decided to leave out these stars in our analysis. Our final sample contains 18 stars. The global parameters of these stars are presented in Table 2. Col. 1 is the star name taken from Prosser (1993). Cols. 2–3 give, respectively, determined from our spectral analysis using SME and calculated from Eq. (16.2) of Gray (1992). Cols. 4–7 give, respectively, micro-turbulent velocities determined from SME, macro-turbulent velocities calculated using the formula of Fischer & Valenti (2003) for stars of K, derived from SME, and finally given in Prosser & Giampapa (1994). Elemental abundances of Li, O, Mg, Si, Ca, Ti, Cr, Fe, and Ni derived from SME are presented in Table 3. Li abundances given in Martín & Montes (1997) are also listed in the Table for comparison. Oxygen abundances, deduced from the O I 7774 triplet and discussed in details in a separate paper (Shen et al. 2005; Paper II thereafter), are included here for completeness.
Sample spectra from 6326 to 6345 Å, one out of the seven spectral segments chosen to determine global stellar parameters (, , etc.) are illustrated in Figure 1 for five program stars, selected to represent the different regimes of effective temperature spanned by stars of the whole sample. The observed spectrum of each star (histogram) is compared to the best-fit synthetic spectrum obtained with the SME. The residual of the fit is also plotted near the bottom of each panel. The region from 6341 to 6344 Å was masked out in the fitting. Also masked out was an unidentified absorption feature near 6334 Å, observed only in the spectrum of P 19. In general, the synthetic spectrum fits the observed line profiles well. An exception was the Fe I line at 6335.33 Å in the spectrum of P 19. The value that we determined for this line from fitting the NSO solar spectrum was , compared to the value of retrieved from the VALD. Adopting the value from the VALD did not improve the fit, we eventually decided to exclude this line in the analysis of P 19.
4. Error analyses
4.1. Lunar corrections
To validate and verify the accuracy of our SME solar solution, we have run the SME on a lunar spectrum, applying the atomic data deduced from fitting the NSO solar spectrum. The lunar spectrum was obtained by Dr. H.-W. Zhang using an echelle spectrograph mounted on the National Astronomical Observatory 2.16 m telescope in Xinglong of China. The spectrum has a resolving power of and a S/N of approximately 300. The differences between the solar parameters determined from the NSO solar spectrum and those determined from the lunar spectrum are listed in Table 4. In all cases, the abundance corrections are small compared to, for example, the spurious abundance variations of yielded by the SME as reported and discussed in Valenti & Fischer (2005). Given the small values of the lunar corrections and the uncertainties in the applicability of those corrections to stars of spectral type other than of the Sun, and considering that we are more interested in the differential rather than the absolute abundances in the current study, we have decided not to apply the lunar corrections to abundances deduced for our IC 4665 sample stars.
| Parameter | Correction |
|---|---|
| 28 K | |
| [M/H] | |
| km s-1 | |
| O | |
| Mg | 0.03 |
| Si | 0.03 |
| Ca | 0.06 |
| Ti | 0.06 |
| Cr | |
| Fe | 0.02 |
| Ni | 0.02 |
4.2. Effective temperature
| Star | (K) | (K) | |||
|---|---|---|---|---|---|
| P 19 | 11.95 | 0.64 | 0.53 | 6399 | 7682 |
| P 147 | 13.45 | 0.73 | 0.74 | 6026 | 6519 |
| P 39 | 12.93 | 0.75 | 0.69 | 5950 | 6770 |
| P 107 | 12.94 | 0.84 | 0.84 | 5626 | 6064 |
| P 150 | 13.08 | 0.86 | 0.83 | 5558 | 6107 |
| P 151 | 13.57 | 0.78 | 0.85 | 5837 | 6021 |
| P 60 | 13.43 | 0.88 | 0.80 | 5493 | 6239 |
| P 199 | 14.59 | 1.01 | 1.02 | 5100 | 5385 |
| P 75 | 13.70 | 0.89 | 0.85 | 5460 | 6021 |
| P 165 | 13.40 | 0.90 | 0.96 | 5428 | 5592 |
| P 267 | 14.83 | 1.04 | 1.09 | 5017 | 5166 |
| P 64 | 14.32 | 0.95 | 1.05 | 5274 | 5288 |
| P 71 | 13.68 | 0.92 | 0.91 | 5365 | 5779 |
| P 94 | 14.26 | 1.01 | 0.93 | 5100 | 5703 |
| P 100 | 14.37 | 1.06 | 1.10 | 4963 | 5136 |
| P 332 | 14.54 | 1.09 | 1.11 | 4884 | 5107 |
| P 349 | 14.65 | 1.11 | 1.18 | 4833 | 4916 |
| P 352 | 14.62 | 1.08 | 1.09 | 4910 | 5165 |
Table 5 gives effective temperatures derived from the and color indices. The color indices were taken from Prosser (1993). was derived using the formula of Alonso et al. (1996). From (Mermilliod 1981a), we obtained a color excess of using the equation of Dean et al. (1978). Since the magnitudes were observed using the Kron system, we calculated the color temperature using the equation given by Randich et al. (1996),
where .
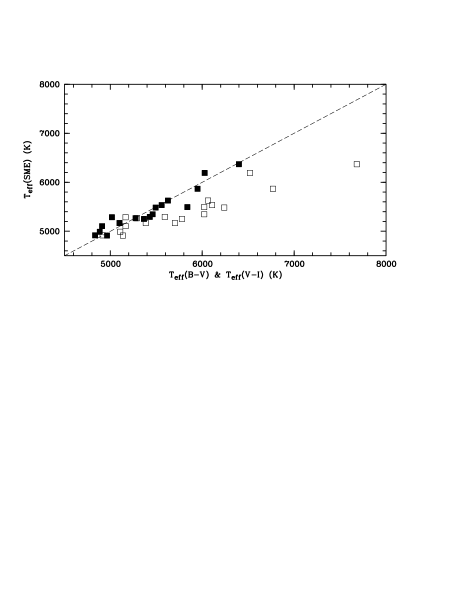
In Figure 2 we plot effective temperatures derived from the SME (c.f. Table 2) against those derived from the and from the color indices. Overall, color temperatures calculated from the color index agree well with values determined using the spectroscopic method. For the 18 sample stars, differences between the two temperatures have an average value of mere 2 K and a standard deviation of 141 K. Parts of the scatter are likely caused by inhomogeneous reddening towards individual stars – in our analysis, we have adopted a constant reddening constant of and . In order to examine the possible variations of reddening towards the individual stars, we have measured the equivalent widths (EWs) of the diffuse interstellar absorption band at 6613 Å. The values of EW(6613) are found to vary from 0.057 to 0.137 Å with typical uncertainties of less than 0.005 Å. If we use the fitted linear relation between and EW(6613) given by Cox et al. (2005), a difference of 0.08 Å in EW(6613) translates into a variation of 0.4 in , and a corresponding variation of 1000 K in . On the other hand, we find that if we adopt the reddening implied by the measured EW(6613) for individual stars when calculating , the resultant differences between and (SME) become larger, not reduced, implying that inhomogeneous reddening is probably not the main cause for the observed discrepancy between and (SME). Alternatively, given the large scatter in the relation between the observed EW(6613) and , it is possible that the increased discrepancies between and (SME) are caused by EW(6613) not being an accurate enough indicator of . In contrast to the color temperatures, Fig. 2 shows that color temperatures are systematically higher than the SME values by approximately a constant offset of about 411 K, clearly too large to be accounted for by measurement uncertainties. Although color index is generally believed to be a better temperature indicator than , as the former is less affected by uncertainties in reddening corrections, the close agreement between and (SME) makes us to believe that the colors for those IC 4665 stars are possibly unreliable.
Stars in young open clusters are known to be susceptible to strong surface activities. In a separate paper devoted to oxygen abundance (Paper II), we show that there is strong evidence suggesting that stellar activities are responsible for the anomalous oxygen abundances deduced from the O I triplet lines for dwarfs in IC 4665 – the abundances increase by almost an order of magnitude as the effective temperature decreases from 6400 to 4900 K. Similar trends have previously also been observed in two other young clusters, the Pleiades and M 34. One of the major observational consequence of strong surface activities is that they will generate color anomalies. As such, it is possible that for young cluster stars, color indices are no longer good diagnostics for stellar effective temperature. It is suggested that high surface magnetic fields in active stars can power enhanced chromospheric emission and affect magnetically sensitive lines. And as a consequence, non-thermal radiation related to stellar activity may lead to corrupted temperatures estimated using the spectroscopic method (Gaidos & Gonzalez 2002). On the other hand, no correlation is found between the abundance derived from a particular line and its Land factor (Drake & Smith 1993; Steenbock & Holweger 1981) and between the temperature discrepancy and indices of stellar activity (Gaidos & Gonzalez 2002). We believe that spectroscopic effective temperatures derived in the current work using SME are probably more reliable than those derived using photometric methods.
4.3. Error budgets
| Li | O | Mg | Si | Ca | Ti | Cr | Fe | Ni | |
| P 19 ( K) | |||||||||
| K | 0.07 | 0.09 | 0.01 | 0.02 | 0.04 | 0.04 | 0.09 | 0.05 | 0.05 |
| K | 0.07 | 0.05 | 0.04 | 0.04 | 0.07 | 0.04 | 0.01 | 0.06 | 0.07 |
| 0.00 | 0.03 | 0.02 | 0.01 | 0.02 | 0.02 | 0.03 | 0.02 | 0.01 | |
| 0.00 | 0.05 | 0.01 | 0.01 | 0.00 | 0.02 | 0.05 | 0.01 | 0.01 | |
| % | 0.00 | 0.00 | 0.01 | 0.01 | 0.01 | 0.00 | 0.07 | 0.00 | 0.01 |
| % | 0.00 | 0.00 | 0.01 | 0.00 | 0.00 | 0.00 | 0.04 | 0.00 | 0.00 |
| Total Err | 0.08 | 0.10 | 0.06 | 0.05 | 0.06 | 0.06 | 0.12 | 0.07 | 0.08 |
| P 151 ( K) | |||||||||
| K | 0.12 | 0.15 | 0.05 | 0.02 | 0.10 | 0.11 | 0.10 | 0.08 | 0.05 |
| K | 0.11 | 0.24 | 0.02 | 0.01 | 0.09 | 0.09 | 0.10 | 0.06 | 0.04 |
| 0.01 | 0.01 | 0.01 | 0.01 | 0.03 | 0.00 | 0.01 | 0.01 | 0.02 | |
| -0.01 | 0.01 | 0.01 | 0.00 | 0.04 | 0.01 | 0.00 | 0.02 | 0.01 | |
| % | 0.02 | 0.03 | 0.04 | 0.00 | 0.14 | 0.07 | 0.03 | 0.07 | 0.02 |
| % | 0.01 | 0.02 | 0.05 | 0.01 | 0.16 | 0.08 | 0.02 | 0.08 | 0.03 |
| Total Err | 0.13 | 0.24 | 0.11 | 0.06 | 0.19 | 0.14 | 0.12 | 0.11 | 0.11 |
| P 332 ( K) | |||||||||
| K | 0.15a | 0.12 | 0.00 | 0.08 | 0.11 | 0.14 | 0.13 | 0.05 | 0.03 |
| K | 0.13a | -0.15 | 0.03 | 0.05 | 0.10 | 0.12 | 0.10 | 0.03 | 0.02 |
| 0.01a | 0.03 | 0.03 | 0.00 | 0.02 | 0.01 | 0.00 | 0.02 | 0.03 | |
| 0.01a | 0.03 | 0.02 | 0.01 | 0.04 | 0.03 | 0.02 | 0.01 | 0.01 | |
| % | 0.01a | 0.01 | 0.01 | 0.02 | 0.04 | 0.04 | 0.01 | 0.00 | 0.01 |
| % | 0.01a | 0.03 | 0.04 | 0.02 | 0.06 | 0.03 | 0.02 | 0.02 | 0.01 |
| Total Err | 0.19a | 0.19 | 0.13 | 0.15 | 0.15 | 0.16 | 0.17 | 0.06 | 0.12 |
-
a
For star P 100 ( K), as the Li line in the spectrum of P 332 is too weak to measure.
In order to obtain estimates of the possible errors of individual elemental abundances derived using the SME, caused by uncertainties in the SME determined stellar global parameters, including , and , we have rerun the SME by varying by amounts of K, by and by % from the optimal values, for three stars, selected to represent different temperature regimes spanned by the sample stars. The resultant changes in individual elemental abundances are listed in Table 6. Errors generated in the process of line profile fitting, caused by limited S/N ratios of the diagnostic lines, were estimated by varying the elemental abundance and then analyzing its effects on the residuals of the fit. In the case of iron, as we used about 100 iron lines to determine its abundance and the lines distribute in all the seven spectral segments, we estimate an error from the scatter of abundance values deduced from the seven spectral segments individually. The total error budget, after adding these uncertainties in quadrature, are listed in Table 6.
We show in the previous subsection that the differences between the SME temperatures and the color temperatures have a standard deviation of about 141 K. We believe that a larger part of the scatter is caused by uncertainties in the color temperature rather than in the SME temperature, as the former is probably affected by stellar surface activities which produce color anomalies. Thus our assumption that the SME temperatures are probably accurate to K is probably realistic. If we increase the uncertainties of to K, the resultant errors of Fe abundances increase to about 0.1–0.2 dex.
5. Abundance Dispersions
In this section, we discuss the implications of metallicity dispersion on the protracted accretion of protoplanetary material under the assumption that the observed heavy elemental abundances only reflect those of the stars’ surface CZ.
5.1. Iron abundance dispersion and CZ mass
Because of their much lower masses, planets, including gas giants, contain much smaller amounts of heavy elements than their host stars. The accretion of planetary material can only make an observable difference if it contaminates only the thin outer CZ of solar-type stars. In the scenario that SWPs acquire higher than the average metallicity via accretion of metal-rich planetary material, one expects that stars with a relatively shallow CZ will exhibit a greater degree of pollution than those with a deep CZ.
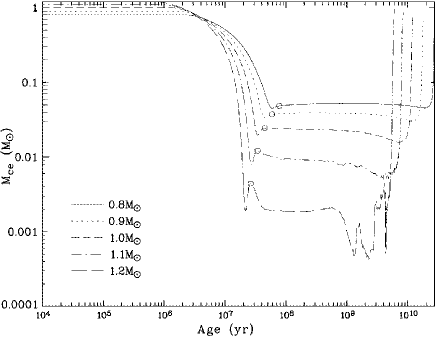
The evolution of CZ mass () with time for stars of mass between 0.8 and 1.2 , obtained using Eggleton’s stellar evolution code (Eggleton 1971; Pols et al. 1995), is plotted in Figure 3. The Figure shows that over time scales comparable to the age of the open cluster IC 4665 (30–40 Myr), of young stars of has already declined substantially and stabilized to its main-sequence value – about 0.002 for F dwarfs and for G and later type dwarfs.
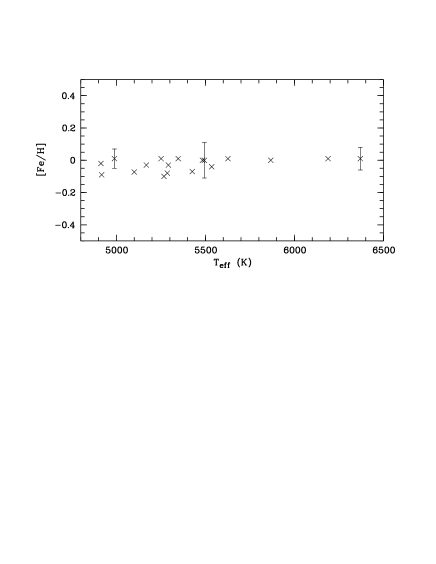
For main sequence stars, effective temperature increases with stellar mass. To search for possible correlation between metallicity and CZ mass, we plot in Figure 4 [Fe/H] against for all stars in our sample. Within the observational uncertainties of individual stars, –0.11 dex, no correlation is found. A first order polynomial fit to the data yields a slope of essentially zero ( and a linear correlation coefficient of 0.27. In addition, the upper boundary of the measured metallicities does not show any evidence of rising as increases (i.e. as CZ mass decreases), as one would expect in the accretion scenario. We note however that only a few stars in our sample have higher than 5500 K. The 18 stars in our sample yield an average iron abundance of [Fe/H] = and a standard deviation of dex, while the full range of [Fe/H] is about 0.15 dex. The measurement uncertainties for hottest stars (i.e. most massive ones) in our sample are about dex.
For an iron abundance of [Fe/H], the mass fraction of all refractory elements is about . If all heavy elements, both refractory and volatile, are included, then the corresponding mass fraction will be 6 times larger, i.e. (Dppen 2000). Thus an upper limit of enrichment by accretion implies a maximum mass of accreted material which is given by,
| (1) |
The hottest star in our sample is P 19. Based on the Age-Zero models of Drilling & Landolt (2000), we estimate that P 19 has a mass between 1.4–1.2 and a CZ mass . The star has an iron abundance of [Fe/H] = 0.01, which is dex higher than the cluster mean, and may have a metallicity that is at the maximum dex richer than the cluster mean. An enrichment at this level, i.e. , caused by accretion of planetary material, would thus require 0.6 of refractory material, including iron. The limit would be raised to 3 if all volatile heavy elements are augmented. These mass upper limits would be reduced to 0.3 and 2 , respectively, if the constraint is applied with the measurement uncertainty (i.e. 0.07 dex), or to 0.2 and 1 , respectively, if the constraint is applied with the difference between the most likely value and the cluster mean value (i.e. 0.04 dex).
In the above discussion, we have adopted to obtain a stringent upper limit on the amount of pollution. The standard deviation of iron abundance for the whole sample appears to be smaller than the measurement uncertainty of individual stars (i.e. ), suggesting that 1) is an upper limit for the metallicity dispersion and 2) our estimate for may be over conservative. [In contrast, Wilden et al. (2002) may have under estimated the magnitude of .] Based on the assumption that the sixteen G-type stars in our sample provide an statistically significant data set, we may set in Eq. (1). For an G dwarf, . Therefore for refractory material only. The constraint on when the volatile heavy elements are also included is 10 , which is comparable to that (–40 ) inside Jupiter and Saturn (Guillot et al. 2004). For a 0.8 star with , the lack of metallicity dispersion implies in refractory and 20 in volatile heavy elements which are comparable to the total mass in all the terrestrial planets and in a single gas giant, respectively.
5.2. Lithium abundance
Lithium abundances are listed in Table 3 and compared to those previously measured by Martín & Montes (1997). The results agree well, except for P 94. Both analyses yield similar effective temperatures for this star – they find K, compared to our value of 5168 K. The discrepancy is found to be caused by differences in the observed line strengths. Our spectrum yields an equivalent width of 30 mÅ for the Li I 6708 resonance line, much smaller than the value of 90 mÅ given in their paper.
It is well established that lithium burning during the pre-main-sequence evolution leads to its depletion in young stellar clusters (Soderblom 1995). Observation of lithium depletion in Hyades indicates that additional mixing mechanisms must be at work apart from the standard convective mixing (e.g. Schatzman & Baglin 1991). The presence of additional mixing processes will not only lead to the destruction of lithium in the stellar surface layer, but can also reduce the level of enrichment (if any accretion of heavy elements occurs) by efficiently flattening the radial abundance profile generated by the accretion of planetary material and therefore hinder the detection of the enhancement. For example, Vauclair (2004) has recently studied the thermohaline convection induced by the inverse metallicity gradient and shown that if the negative abundance gradient produced by the accretion of H-deficient material exceeds a certain threshold, “metallic fingers” might be created that dilute the accreted material inside the star. On the other hand, since IC 4665 is much younger than Hyades ( Myr), any diffusion, if occurred, may not have had time to dilute the polluted CZ of IC 4665 stars.
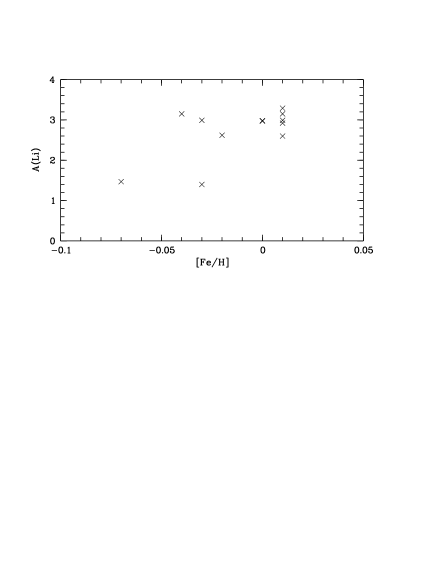
Table 3 indicates a factor of three spread in lithium abundance, (Li), amongst the IC 4665 stars which have essentially identical iron abundances. The large dispersion in the (Li) suggests that the lithium depletion time scale is comparable to the age of the cluster and therefore the signature of planet consumption, if present, would be preserved. Following the discussion in Section 1, we now consider the possibility that the extent to which the large dispersion in (Li) may be due to the late accretion of lithium-rich protoplanetary material. If accretion of planetary material is indeed responsible for the high lithium abundances observed in several of the stars and for large scatter of (Li) of the whole sample, then stars with enhanced (Li) should also exhibit enhanced abundances of other heavy elements. Alternatively, if the large dispersion in (Li) is entirely caused by physical processes other than accretion, one would expect no correlation between the lithium abundance and those of other metals, and that all stars of a given open cluster should have similar metal abundances. To discriminate these two possible scenarios, we plot in Figure 5 lithium abundance against that of iron for stars in our sample. No obvious correlation is found. However, there is some marginal evidence indicating that stars of higher lithium abundances also have slightly higher iron abundances, up to [Fe/H] = 0.01, compared to the sample mean of [Fe/H] . This marginal iron enhancement is however well within the measurement uncertainties.
Our results from the analysis of IC 4665, i.e. the absence of any correlation between [Fe/H] and and between (Li) and [Fe/H], are consistent with the previous finding of Pinsonneault et al. (2001), Santos et al. (2004), and Fischer & Valenti (2005). However, such a correlation (Laughlin & Adams 1997) would be expected if the impinging planets are entirely disrupted in the thin stellar CZ. All these arguments suggest that pollution by accretion of metal-rich planetary material is probably not the major contributor to the observed high metallicity of SWPs.
5.3. Other elements
Gonzalez (1997) points out that since light elements are generally strongly depleted in rocky planetesimals, the existence of a correlation between the elemental abundances and their condensation temperatures could be a strong signature of late-stage accretion of planetary material. Tentative evidence pointing to such systematic abundance variations as a function of condensation temperature has indeed been found by Smith et al. (2001) in some SWPs. Unfortunately, the observed trends can easily be confused with those resulted from the Galactic chemical evolution. In the current study, we have determined abundances for Li, O, Mg, Si, Ca, Ti, Cr, Fe, and Ni and the results are listed in Table 3. If accretion is at work as suggested by Gonzalez (1997), then one would expect an enhancement in the abundances of refractory elements (those with condensation temperatures near or above that of iron) are enhanced relative to those of volatile elements. Elements analyzed in the current work have condensation temperatures (Lodders 2003) of 1142 K (Li), 180 K (O), 1336 K (Mg), 1529 K (Si), 1517 K (Ca), 1582 K (Ti), 1296 K (Cr), 1334 K (Fe) and 1353 K (Ni). It is unfortunate that the abundances of oxygen, the only volatile element analyzed here, show a spurious trend with effective temperature. As we will show in a separate paper (Paper II), the anomalous oxygen abundances, deduced from the triplet permitted lines, seem to be strongly affected by stellar surface activities and therefore do not represent the true photospheric values.
| [Mg/H] | [Si/H] | [Ca/H] | [Ti/H] | [Cr/H] | [Fe/H] | [Ni/H] | |
|---|---|---|---|---|---|---|---|
| Mean | 0.01 | 0.06 | 0.00 | 0.18 | 0.05 | 0.03 | 0.02 |
| s.d. | 0.13 | 0.19 | 0.14 | 0.17 | 0.11 | 0.04 | 0.13 |
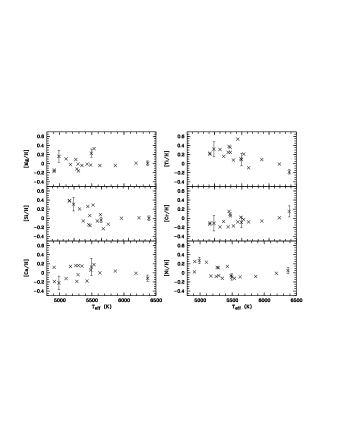
The abundances of Mg, Si, Ca, Ti, Cr and Ni are plotted in Figure 6 against . Except for Mg and Ca, all other four elements show spurious trends with . In the case of Si, Ti and Ni, the derived abundance decreases with increasing . For Cr, the trend is the opposite. The average abundances of these elements as well as of iron are given in Table 7, along with their standard deviations. Except for iron, the abundances of all other elements show large scatters, with standard deviations larger than 0.1 dex, which are clearly too large to be accounted for by line measurement uncertainties alone, and seem to be mainly caused by the spurious variations with of the derived abundances.
Similar small but statistically significant variations with are also observed in the Si, Ti, Cr and Ni abundances for stars of Pleiades previously analyzed by Wilden et al. (2002) using the SME. In their study, the abundances of Si and Ni are found to decrease by 0.1–0.2 dex as increases from 4800 to 6000 K, whereas those of Ti and Cr increase by about 0.2 dex. In their extensive study of over one thousand stars using the SME Version 2, Valenti & Fischer (2005) found spurious trends in the derived abundances of up to 0.3–0.4 dex as varies from 4700 to 6200 K. They removed such trends by applying empirical corrections determined from polynomial fits to the data. That elemental abundances determined for a homogeneous sample such as an open cluster exhibit some unanticipated correlation with stellar parameters such as is not a unique feature of the SME, but is also found in other techniques such as those based on equivalent width (EW) analysis. Using the EW method, Schuler et al. (2003) determine elemental abundances for 9 solar-type dwarfs, spanning a temperature range from 4700 to 6200 K, in the open cluster M 34 and find that cool stars have 0.1–0.2 dex lower Mg, Al, Ca, Cr, Ti and Fe abundances than hotter ones. For Si the trend is reversed, whereas no significant trend is found for Ni. In their analysis, abundances of Si were derived from lines of relatively high excitatio ( eV), whereas for Fe, Ti, Cr, Ca, Al and Mg, most of the lines used were of modest excitation (–4 eV). Few Fe and Ni lines in their analysis had excitation potentials higher than 5 eV. Schuler et al. suggest that NLTE effects are responsible for the observed spurious trends. In our analysis of IC 4665, Si abundances were derived from lines of –6 eV, those of Cr from lines of –4 eV and those of Ni from lines of –5 eV. The observed spurious trends of abundances of these elements with are therefore consistent with the picture of Schuler et al. However, in our analysis Ti abundances were derived from lines of very low excitation (–2 eV), yet they were found to decrease with increasing . More observations and further quantitative investigations of the NLTE effects are needed for a better understanding of the underlying causes of these spurious abundance trends.
6. Metallicity Homogeneity in CZ’s and the Planet Formation Processes
In this Section, we discuss the implications of metallicity homogeneity among the solar type stars in IC 4665. Similar to the previous Section, we assume that the observed heavy elemental abundances only reflect those of the star’s surface CZ. Jeffery, Bailey and Chambers (1997) discussed the six possible sources of material accreted onto the solar surface and estimated how much rocky material of each source could have been accreted during the main-sequence time of the Sun. In their analysis, protoplanetary disc debris and giant planet are the two main contributors that could give more than 1 of infalling material to the solar surface. We will discuss the two sources one by one in this section. In Section 6.1 and Section 6.2, we will discuss the possibility of grains or small planetesimals to be ejected into the CZ of its central star. While in Section 6.3 and Section 6.4, the possibility of a giant planet to be swallowed by its central star is discussed.
6.1. Constraints on the evolution of debris disks
The analysis in the previous Section suggests that it is unlikely that the metallicity of the CZ of a SWP is significantly enhanced through post-formation consumption of planets. Nevertheless, protracted accretion of protostellar material is expected to proceed during the depletion of debris disks. We now utilize the above data to extract implications on the clearing of planetesimal disks.
Based on the IR and millimeter excess continuum radiation, the total mass of grains contained in a typical protostellar disk around T Tauri stars is estimated to be in the range of – (Beckwith et al. 1990). In young clusters, the fraction of stars with detectable traces of grain emission declines rapidly with the age on the time scale of Myr (Haisch et al. 2001; Carpenter et al. 2005). The reduction implies that grains are either accreted by their host stars or have grown substantially. For stars in the T Tauri phase, since the CZ extends throughout the whole star, must be replaced by the total mass of the star, , when determining using Eq.(1). We will discuss the implication of abundance homogeneity using Eq.(1) in the next subsection.
Grain growth leads to the formation of planetesimals. During the post T Tauri phase, planetesimals produce dust through collisions (Kenyon & Bromley 2002). Stars of ages comparable to that of IC 4665 have been found to show a large dispersion in their mid-IR excess, which is generally attributed to reprocessed radiation emitted mostly by grains of sizes in the range of 10–100m (Rieke et al. 2005). The observed mid-IR excess from an optically thin circumstellar disk is given by,
| (2) | |||||
| (3) |
where and are flux densities from the dust grains and from the central star, respectively, is the distance to the source, is the dust opacity, and are effective temperature and radius of the central star, the average dust temperature and the Planck function, approximated by the Rayleigh-Jeans formula which is suitable for the mid- and far-infrared wavelength regime of interest here.
From the evolution of the 24 m excess deduced from observations by Rieke et al. (2005), one finds that for a star of maximum mid-IR at age , the total mass of circumstellar dust grains is given by,
| (4) | |||||
where is the wavelength of maximum photon emission of the grains, i.e. cm K. If we assume an opacity at 1.3 mm, cm2 g-1 (for grains of radii 0.1 m to 3 mm, varies in the range of 0.14–0.87 cm2 g-1; Pollack et al. 1994) and a dust temperature of 150 K (thus the grains have a maximum photon emission rate at 24 m), then a solar type star at the age of IC 4665 (i.e. Myr) with the maximum IR excess should have about dust grains.
The Poynting-Robertson (PR) drag by the central star’s radiation causes the grains to migrate toward the star on a time scale (Backman & Paresce 1993),
| (5) |
For 24 m size grains of particle density g cm-3 at a distance of 1 AU, yr. Under the steady state assumption, the total amount of grains accreted over the age of IC 4665 is therefor . This value is much smaller than estimated in the last Section from the observed metallicity dispersions. In other words, the expected pollution due to the PR decay of the grains is well below the current detection limit.
However, the grains have to be continually replenished by colliding planetesimals. Under the assumption that the collisions between planetesimals lead to an equilibrium power-law size distribution (Wetherill & Stewart 1989),
| (6) |
and the collision frequency for planetesimals in the size range with all other smaller planetesimals is,
| (7) |
where is the collision cross section, which is reduced to the geometrical area for relatively high velocity dispersion and denotes the number density of planetesimals of sizes smaller than . Assuming a fraction of all collisions leads to planetesimals’ total fragmentation and the replenishment of planetesimals of smaller sizes, with a size distribution as given by Eq. (6), an equilibrium state would be attainable. We assume the smallest size of planetesimals to be 24 m. The largest size of planetesimals, for which single collisions amongst them can contribute to the replenishment of grains within the Poynting-Robertson timescale , is estimated to be around cm. The corresponding upper mass limit is 46 . The actual upper limit of the planetesimal size may be smaller than . Then, the corresponding total mass of the parent-planetesimals becomes,
| (8) |
Using calculated above, we obtain , if .
Thus, the decline of with time also implies a diminishing . In principle, depletion of the population of planetesimal parent bodies can occur as a consequence of their captures by the host star. This process is however unlikely the dominant outcome given that the inferred reduction in is much larger than the upper limit . A more likely cause for the reduction is probably associated with the accretion of planetesimals by relatively massive embryos and protoplanets.
6.2. Constraints on terrestrial planet formation and late bombardment
We now consider the constraints set by the upper limit of on the extent of low-level metallicity pollution due to the protracted bombardment of planetary material onto the host star. With those constraints, we infer some implications on the process of terrestrial planet formation.
In the sequential accretion scenario, it is customary to adopt the minimum mass nebula model as a fiducial prescription of initial condition for planet formation in the solar system. The minimum mass nebula model is based on the assumption that all the heavy elements in the primitive solar nebula have been retained by the present-day terrestrial and giant planets. Current theories of planet formation suggest that planetesimals grow through coagulation. As a consequence of their mutual gravitational scattering (Palmer et al. 1993) and their tidal interaction with the disk gas (Artymowicz 1992), planetesimals attain relatively modest eccentricities (Kominami & Ida 2002). With nearly circular orbits, the growth of planetesimals is stalled when they evolve into dynamically separated protoplanetary embryos with isolation masses (Lissauer 1993) which increases from a few times that of the Moon at 0.5 AU to a fraction of Mars just inside the snow line (Kokubo & Ida 2002).
Analogous to the decline of IR continuum radiation associated with hot, warm, and cold dusts, the signature of gas accretion onto protostellar disks appears to decrease on the time scale of 3–10 Myr (Hartmann 1998). There are also evidence that the gas surface density in the inner disk also vanishes on a comparable time scale (Najita 2003). If gas in the outer regions of disks decreases on a similar time scale, gas giant formation must proceed within a few Myr. In contrast, the final assemble of terrestrial planets may occur on a much longer time scale even though the initial growth of the grains may have occurred during the first few Myr. The giant-impact scenario for the origin of the Moon suggests that collisions between protoplanets may have occurred after they have differentiated (Cameron & Benz 1991). Independent cosmochemical analysis based on the Hafnium/Tungsten isotopic abundances in meteorites and the Earth lithosphere suggests that the final assemble of terrestrial planet formation occurred on a time scale of 30–50 Myr in the Solar System (Yin et al. 2002). Since this time scale is comparable to the age of IC 4665 and that for the CZ of solar-type stars to evolve to their asymptotic masses, we can apply our data to extract useful implications on the formation of the terrestrial planets.
In disks with heavy-element contents less than that of the minimum mass nebula, gas giant cannot emerge prior to gas depletion (Ida & Lin 2004a). Nevertheless, embryos with relatively low isolation masses can emerge in the inner regions of the disk. After the gas depletion, these embryos’ eccentricity would be excited in a gas-free environment through their distant gravitational interaction with each other (Chambers, Wetherill & Boss 1996). When their orbits cross with each other, their growth through coagulation would resume. On the time scale of 100 Myr, this sequence of events leads to the emergence of a small number of protoplanets with masses comparable to that of the Earth and eccentricities comparable to the ratio of their surface escape and orbital speed which is –0.3 (Chambers & Wetherill 1998). In contrast, the present-day eccentricities of the terrestrial planets in the solar system are well below these values.
There are several scenarios to account for this discrepancy. Although tidal interaction between planetesimals and the residual gas can suppress the embryos’ eccentricity, very delicate timing is required for the emergence of sufficiently massive protoplanets and sufficiently small eccentricities (Kominami & Ida 2004). Another potential damping mechanism is dynamical friction exerted on the embryos by low-mass planetesimals (e.g. Palmer et al. 1993). However, a population of low-mass planetesimals with total mass comparable to that of the terrestrial planets is needed to effectively reduce the eccentricity of the latter (Goldreich et al. 2004). Some planetesimals may be accreted by the terrestrial planets while a fraction of them may be scattered into their host stars on a time scale comparable to the age of IC 4665. The above constraint on the dispersion in [Fe/H] places an upper limit on to be for stars.
Other scenarios for terrestrial planets’ low eccentricities rely on the presence of gas giant planets. In disks with masses comparable to that of the minimum mass nebula model, gas giant planets can form just beyond the snow line prior to the gas depletion. In this limit, the giant planets’ gravitational perturbation can induce secular resonances which sweep over extended regions of the disks during the gas depletion (Ward 1981). The eccentricity of planetesimals along the path of the sweeping secular resonance is excited by the gas giants while it is also damped by their tidal interaction with the residual gas. The combined influences of these two effects induce the planetesimals to cross each other’s orbits with aligned longitudes of periapse and promote their growth through cohesive collisions (Nagasawa, Lin & Thommes 2005). After their masses become comparable to that of the Earth, the protoplanetary cores become detached, with low-eccentricity orbits, from the sweeping secular resonance of gas giants (Thommes, Nagasawa & Lin 2005). The high retention efficiency of refractory planetesimals by the terrestrial planets implies very limited amount of stellar pollution by protracted planetesimal accretion, which is in good agreement with the metallicity homogeneity we have established here.
The dynamical evolution from embryos to protoplanets is determined by the gas depletion time scale as well as the gas giants’ mass and eccentricity. If Jupiter and Saturn formed with their present eccentricities and gas in the solar nebula was depleted over an e-folding time scale of 3 Myr, the residual planetesimals would be efficiently retained and assembled into terrestrial planets with present-day masses and eccentricities over –50 Myr (Lin, Nagasawa, & Thommes 2005). But, if Jupiter and Saturn had much smaller initial eccentricities or if the total mass of the gas in the solar nebula rapidly declined below the mass of Jupiter, the gas giants would impose a weak secular perturbation on the dynamical evolution of the planetesimals during the propagation of their secular resonance. When the mass of the disk gas decreases below to that of the gas giants, their secular resonances are stalled at asymptotic locations which are determined by either the dynamical configuration of multiple gas giant planets or the relativistic precession in systems with only single gas giant planets. In this gas-depleted background, the massive embryos scatter and accrete the low-mass residual planetestimals and evolve into proto terrestrial planets with low eccentricities (Chambers & Cassen 2002). A population of planetesimals are scattered onto the gas-giants’ secular resonances where they lose angular momentum to the gas giants, gain eccentricity, and eventually collide with their host star. Possible consequences of this process include 1) the intense cometary bombardment onto Pic (Levison, Duncan & Wetherill 1994) and 2) the large dispersion in the IR excess of debris disks around young (Rieke et al. 2005) and mature stars (Beichman et al. 2005). However, the observationally inferred upper limit on suggests that the amount of planetesimals lost to their host stars may not be sufficient to absorb all the excess kinetic energy that needs to be lost during the circularization of the terrestrial planets.
6.3. Implication on the evolution of short-period gas giants
Although the scenario of gross metallicity enhancement in SWP’s CZ through planetary consumption is disproved by the constraint placed by Eq.(1), the possibility of one or two gas giants being accreted by their host stars still cannot be ruled out with the present sets of data. We discuss here some implications of this possibility.
Beyond the snow line, the condensation of volatile ices greatly increases the isolation mass to several times that of the Earth. Provided there is an adequate reservoir (i.e. in relatively massive disks), gas is readily accreted onto the cores initially through a phase of slow Kelvin-Helmholtz contraction and followed by a phase run-away dynamical accretion. Gas giant planets form readily near the snow line during the active phase of protostellar-disk accretion (Pollack et al. 1996). When the gas giant planets acquire masses comparable to that of Jupiter, these gas giants induce the formation of gaps in the disk which not only quenches their growth, but also causes their orbits to migrate with the viscous evolution of the disk (c.f. Lin & Papaloizou 1986a,b). This scenario has been invoked (Lin, Bodenheimer & Richardson 1996) to account for the origin of the first short-period planet discovered around a main sequence star, 51 Peg (Mayor & Queloz 1995). Along their orbital decay, gas giant resonantly capture and drive the residual planetesimals to migrate with them. As their eccentricity grows, these planetesimals may be scattered into their host stars (Yu & Tremaine 2001). This process occurs while the host stars are sufficiently young that their interior is fully convective. Therefore it cannot significantly modify the metallicity of the host stars.
There are several other versions of the migration scenario. Before the protoplanets have sufficient mass to open up gaps in their nascent disks, they tidally interact with both the disk region interior and exterior to their orbit (Goldreich & Tremaine 1980). Due to a geometric offset, it has been suggested that Earth mass planetesimals may undergo Type-I migration (Ward 1986), migrate to the stellar proximity, and form short-period gas giants in situ (Ward 1997). It has also been suggested that the migration of gas giants may be induced by their gravitational scattering of a large population of residual planetesimals (Murray et al. 1998). The apparent chemical homogeneity of the stars in IC 4665 implies that if these processes occurred, the residual planetesimals near the stellar surface must be cleared before the CZ significantly reduces its mass. Since the total mass of planetesimals needed is comparable to that of the gas giants and the expected migration time scale is expected to be much longer than 10–30 Myr, the planetesimals scattering migration, if occurred, would introduce a metallicity enhancement much larger than that constrained by our data.
In principle, the above constraint can be disregarded on the ground that only 1–2% solar type stars host short-period gas giants. However, the period distribution of extra solar planets is approximately flat over the range of several days to months (e.g. Udry, Mayor & Santos 2003). Numerical simulations of gas giant formation and migration reproduce the period distribution in the weeks to years range but they also over predict the frequency of short-period planets by nearly an order of magnitude (Ida & Lin 2004b). One possible resolution for this discrepancy is that a significant fraction of the planets migrated to the disk centers either plunge into the host stars (Sandquist et al. 1998) or are tidally disrupted (Gu et al. 2003, 2004). These events may occur during the post-formation tidal evolution or during the epoch of disk depletion in multiple- planet systems (Nagasawa & Lin 2005).
In addition to tidal disruption, short-period gas giants are also vulnerable to photo-evaporation and magnetic stripping through unipolar induction. Outflow is observed around HD 209458b (Vidal-Madjar et al. 2003). Although the mass loss rate around its mature main sequence star is low, it could be considerably higher during the early active phase of protostellar and planetary evolution. Catastrophic mass loss from gas giants has been suggested as a potential avenue for the formation of Neptune-mass planets (e.g. Boss et al. 2002). If the removed gas from the metal-enriched planetary envelopes is accreted by the host stars, their metallicity would also be enhanced. The absence of any significant metallicity dispersion implies that the debris of tidally-disrupted or photo-evaporated gas giants is either blown away from host stars or accreted by them before their CZ have established their asymptotic structure. Based on this result, we predict that the frequency of short-period planets around post T Tauri stars is comparable to that of the mature stars.
6.4. Implication on the evolution of eccentric gas giants and multiple-planet systems
The number of stars we have analyzed and presented for IC 4661 and the Pleiades clusters is small. The statistical significance of our constraints on the short-period planets may be limited since they are found only in 1-2% of the target stars. However, at least 10% of nearby solar-type stars appear to bear longer-period planets around them and in most cases these planets are in multiple systems (e.g. Marcy et al. 2000a). As the time baseline of precision radial velocity data expand, the fraction of stars with planets is expected to increase substantially (Armitage et al. 2002). Thus, the observed metallicity homogeneity among the stars in IC 4665, when combined with that obtained early for the Pleiades stars (Wilden et al. 2002), does provide statistical meaningful constraints on the pollution of planet bearing stars in general.
The eccentricity of the extra solar planets is nearly uniform between 0 and 0.7 (Marcy et al. 2000b). Although planets’ resonant interaction with the disk has been invoked as a potential mechanism for exciting their eccentricities (Goldreich & Sari 2003), both resonant and nonlinear damping processes limit the extent of eccentricity excitation, especially for planets with mass less than ten times that of Jupiter (Goldreich & Tremaine 1980, Artymowicz 1992, Papaloizou et al. 2001).
An alternative scenario for the origin of large planetary eccentricities is dynamical instabilities in multiple-planet systems. Such systems are expected to be around most SWP’s (Marcy et al. 2000a) because the emergence of the first gas giants promotes the formation of the next-generation planets just beyond the outer edge of the disk gap they induce (Bryden et al. 2000a). Dynamical instabilities can arise prior to (Bryden et al. 2000b; Kley 2003), during (Nagasawa et al. 2003), and after disk depletion (Rasio & Ford 1996; Weidenschilling & Marzari 1996; Lin & Ida 1997).
If SWP’s were mostly formed in clusters, similar to most young stellar objects (Lada & Alves 2004), their encounters with each other could also perturb the orbits of long-period planets and trigger dynamical instabilities in multiple-planet systems (Laughlin & Adams 1998). Finally, many planets, including those with short periods, are found in binary stars. If the inclination between the stellar and planetary orbits are sufficiently large, the Kozai effect may also induce planets to attain nearly parabolic orbits and strike their host stars (Innanen et al. 1998; Murray et al. 1998) or trigger dynamical instability in multiple systems.
Planets in dynamically unstable systems undergo orbit crossings and close encounters which lead to large eccentricities, merges, and escape from their host stars (Lin & Ida 1997; Papaloizou & Terquem 2001). Under some circumstances, planets may be scattered to the stellar proximity (Ford et al. 2005) or directly into the star. Numerical simulations of planetary impacts onto their host stars (Sandquist et al. 1998) show that a Jupiter-mass planet cannot penetrate through the CZ of G dwarfs without being completely disintegrated by the hydrodynamic drag. But with the constraints set by Eq. (1), the observed metallicity homogeneity amongst the limited number of stars we have analyzed is insufficient to rule out this possibility for stars with masses . This constraint is much more stringent for F stars. However, only a fraction of a one-Jupiter-mass impactor may be removed from the planet as it penetrates directly through the much shallower CZ of a star. Depending on the actual location of most of the heavy elements within the planet (possibly mostly confined in the core) and its orbital impact parameters, it is not clear whether the accretion of a planet onto an F-type star can result in greater metallicity enhancement of its CZ than a G-type star. With only one F star in our data set, we need further quantitative studies of these processes to address the apparent discrepancy between the expectations of the accretion scenario and observations such as those presented in the current work.
7. Constraints on the protoplanetary-disk masses
In this Section, we consider the alternative possibility that abundance is uniform throughout the stars and use the metallicity dispersion to derive constraints on the efficiency of planet formation in protostellar disks. Based on the analysis in § 5, we adopt the standard deviation of [Fe/H] () as the upper limit for the metallicity dispersion.
7.1. Mixing in the protocluster cloud
The remarkable abundance homogeneity among the stars in both IC 4665 and the Pleiades clusters cannot be attained unless their progenitor clouds are thoroughly mixed. These clouds are assembled from smaller clouds with presumably a range of metallicity. Turbulence provides a support against the clouds’ own self gravity as well as induces mixing to homogenize the clouds. At least several eddie turn-over time scales are needed for the metallicity dispersion to be reduced below the observed upper limit (Klessen & Lin 2003). Thus, the progenitor clouds must be bona fide entities rather than transitory flow pattern in the interstellar medium.
The total mass of these clusters is only a few . If the original clouds have comparable masses, the injection of supernova remnants of one or two O stars would be sufficient to significantly modify their metallicity. The absence of metallicity dispersion amongst the cluster stars suggests that the span of star formation epoch in these clouds must have been shorter than the main sequence life time of the massive stars which is Myr. This inference is consistent with the range of stellar ages in the Taurus complex (Cohen & Kuhi 1978). By examining the heavy element abundance patterns of two Hyades candidates and seven members of the Ursa Major group, Gaidos & Gonzalez (2002) also reach a similar conclusion that any variation in metallicity within a cluster is likely caused by heterogeneous incorporation of heavy elements into protostars, rather than by the influence of massive stars of a previous generation.
7.2. Mass of protostellar disks
According to the current paradigm for star formation, all the gas in young stellar objects has been processed through protostellar disks (Shu et al. 1993). It is customary to classify protostellar evolution in four stages: 1) The embedded phase extending over Myr, during which massive, self gravitating disks are embedded in collapsing progenitor clouds; 2) The active disk evolution phase lasting Myr, during which the energy dissipation associated with mass diffusion and angular momentum transfer contributes to most of the disk luminosity; 3) The passive disk evolution phase proceeding over several Myr during which the disk mass is reduced to around that of the minimum mass nebula and the disk’s luminosity is mostly due to the reprocessed stellar radiation; 4) The weak-line T Tauri phase evolving on the time scale of several more Myr during which gas accretion onto the host stars vanishes and the signature of the m–mm size grains declines.
During each of these stages, gas and dust evolve independently. In differentially rotating accretion disks, the rate of gas diffusion is determined by the efficiency of its angular momentum transport processes (Lin & Papaloizou 1996). Disk gas may also be photo-evaporated at rates which are determined by the intensity of the UV photons which can reach the outer disk regions (Hollenbach & Adams 2004).
In contrast, only sub-mm grains are well coupled and evolves with the disk gas. The migration of larger-than-mm grains is determined by the effectiveness of the hydrodynamic drag process (Takeuchi et al. 2005). Heavy elements contained in super-km planetesimals are no longer significantly affected by the disk gas (Garaud et al. 2004) and most of them are either retained by the protoplanets or scattered beyond the orbits of the outermost planets.
The stars’ asymptotic metallicity is determined not only by that of their progenitor clouds, but also by the efficiency of dust retention and gas outflow from the disk. Due to the diverse avenues of evolution, the accretion of gas and of heavy elements are not expected to proceed at the same rates. Even if the progenitor cloud of IC 4665 is well mixed initially, different physical processes could lead to an observable dispersion in the IC 4665 stars.
There are two possible implications to this dichotomy: 1) the accretion of condensible heavy elements is self regulated or 2) the retention efficiency of heavy elements by protostellar disks is limited. The presence of planets in the solar system implies a minimum mass nebula is the lower limit on the amount of heavy elements which was left behind in the disk as planet-building blocks. Current sequential planet models suggest that similar disks must be preserved around a significant fraction of all young stellar objects in order to account for the ubiquity of Jupiter-mass planets around nearby stars (Ida & Lin 2004a,b). At least during the passive phase of their evolution, protostellar disks are observed with total grain masses comparable to that contained in the minimum mass nebula (Beckwith & Sargent 1991).
But, the orbital decay time scale for these grains is much less than the disk evolution time scale and their retention requires their growth time scale to be shorter than . In principle, dust can settle to the mid-plane and become gravitationally unstable in turbulent-free protostellar disks (Goldreich & Ward 1973). But the sedimentation also leads to a strong shear layer (Weidenschilling & Cuzzi 1993) which becomes unstable well before the onset of gravitational instability (Sekiya & Ishitsu 2000; Garaud & Lin 2004). Gravitational instability can still occur in regions where the abundance of heavy elements is comparable to that of the hydrogen and helium (Sekiya 1998; Youdin & Shu 2002). With such a large concentration of heavy elements, cohesive collisions can also lead to . Such high concentration of heavy elements may be accomplished through 1) sublimation near the snow line (Stevenson & Lunine 1988), 2) upstream diffusion (Morfill & Voelk 1984; Clarke & Pringle 1988), 3) grain recycle through stellar winds (Shang et al. 2000), 4) differential grain migration (Youdin & Chiang 2004), or 5) grain trapping by persistent giant vortices (Adams & Watkins 1995; Godon & Livio 1999).
In principle, all of these processes can occur at each stage of protostellar evolution. However, any one of these processes can also lead to the retention of a large fraction of the heavy elements pass through the disk and introduce a metallicity dispersion in their host stars. Similar to the condensed heavy elements, a fraction of disk gas may be evaporated either through photo-evaporation (e.g. Hollenback & Adams 2004) or winds driven by the central stars. Unless gas loss is coordinated with the retention of heavy elements by planetesimals, these competing processes are likely diversify the rates of gas and of heavy element accretion and generate metallicity dispersion amongst the host stars. Note that the dust migration rate actually increases during the depletion of the disk as the hydrodynamic drag on the radial migration of the grains is reduced (Takeuchi et al. 2005). A theoretical challenge is to account for both the chemical homogeneity and the ubiquity of planets.
The growth rate and isolation mass of planetesimals increase with and , respectively. In the limit of efficient grain retentions, the surface density of planet-building blocks is much higher than that of the minimum mass nebula, which promotes the rapid emergence of cores and gas giants (Ida & Lin 2004a), even during the active phases of disk evolution when the accretion rate onto their host stars is greater than yr-1. After the first-generation planets acquire sufficient mass to open gaps in their nascent disk, they migrate with the disk gas. Along their inwardly migrating path, these planets capture any residual planetesimals and grains which are coupled to the gas onto their main motion resonances and sweep them into their host stars (Ida & Lin 2004b). This self regulated clearing of the heavy elements would occur continually until the disk is so depleted that the formation time scale of the last gas giants becomes comparable to their orbital migration time scale, which is determined by the mass diffusion and angular momentum transport time scale in the disk. The final stalling condition is satisfied when the mass of the residual planetesimal disks is reduced to that of the minimum mass nebula.
The self-regulated disk-clearing scenario provides an attractive hypothesis to resolve the [Fe/H]-homogeneity versus ubiquitous-planet paradox. But it also predicts the existence of planets around a relatively large fraction of stars, including metal deficient ones. This extrapolation is inconsistent with the fact that the fraction of SWP’s is observed to be a rapidly increasing function of their metallicity (Santos et al. 2004; Fischer & Valenti 2005). The observed correlation can be best reproduced by the sequential planet formation models which are based on the assumption that the ratio () of the retained to the total heavy elements accreted through the protostellar disks is independent of the metallicity of their host stars (Ida & Lin 2004b). The fiducial value of this ratio for the minimum mass nebula is (Hayashi et al. 1985). The homogeneity of different mass stars indicates an upper limit for this ratio to be , which also appears to be independent of . (The constraints set by the stars in the Pleiades cluster is ; Wilden et al. 2002). This upper limit means that the total reservoir of heavy elements retained by their nascent disks is less than five times that of the minimum mass nebula. The cause for this magnitude of is unclear.
The upper limit on also provides a constraint on the gas giant formation. In the early version of gas giant formation model, 10–20 cores are needed to initiate efficient gas accretion (Pollack et al. 1996). Such massive cores would emerge within the observed disk depletion time scale of 3–10 Myr if is several times larger than that of the minimum mass nebula. The upper limit of determined here places a constraint on . Modest values of can still lead to the ubiquitous production of gas giant planets if 1) is enhanced near the snow line or 2) efficient gas accretion is initiated with modest core masses. The former possibility is consistent with the present-day location of Jupiter being close to the snow line in the solar nebula whereas the latter possibility is in agreement with the recently revised upper limit on the core mass of Jupiter (Guillot et al. 2004). The gas accretion barrier may be bypassed with either an opacity reduction through grain depletion (Ikoma, Nakazawa & Emori 2000) or other efficient energy transfer mechanisms though the radiative regions of the envelope.
8. Summary
In the current paper, we present the first abundance study other than Li for the young open cluster IC 4665. Elemental abundances of Li, O, Mg, Si, Ca, Ti, Cr, Fe and Ni have been determined for 18 dwarfs of spectral types from F to early K, using high-resolution spectra obtained with the HiRes spectrograph mounted on the Keck I 10 m telescope. Except for iron, abundances of all other elements, including O, Si, Ti and Cr, show large scatters and trends with effective temperature. Similar trends are also observed in Pleiades (Wilden et al. 2002), M 34 (Schuler et al. 2003) and in field stars (Valenti & Fischer 2005). Except for Li, for which the abundance scatter is probably caused by depletion, variations observed in other elements are probably spurious, although their causes remain unclear. In the case of oxygen, as we will show in a separate paper (Paper II), there is strong evidence suggesting that stellar surface activities are to blame for the observed large variations of abundances deduced from the 7772,7774,7775 triplet lines. Accurate abundance determinations for open clusters are pivotal to constrain the formation and evolution of star clusters and the chemical evolution of the Galaxy. A better understanding of the underlying physical processes that may affect abundance determinations in open clusters is thus essential.
No correlation is found both between the metallicity and mass of the convection zone, and between the Li and Fe abundances, i.e., no signature of accretion of H-deficient planetary material is found. Thus our current observations for a limited sample of IC 4665 dwarfs seem to favor the scenario that the high metallicity of SWPs is simply the consequence that planets form more efficiently in metal-rich environs. However, given that many details of the processes of star-planet interactions remain not well understood, further studies are favorable before the problem of the high metallicity of SWPs can be settled.
Finally, using the deduced standard deviation of [Fe/H] as an upper limit on the metallicity dispersion amongst the sample stars, we cast various constraints to show that 1) The total reservoir of heavy elements retained by their nascent disks is less than five times that of the minimum mass nebula; 2) The retention efficiency of planet building material is high; 3) The accumulation of grains may be locally enhanced; 4) Efficient gas accretion may have initiated around cores with only a few ; 5) The amount of protracted accretion of planetary material is limited; and 6) The migration of gas giants and the circularization of terrestrial planets’ orbits are not regulated by their interaction with a residual population of planetesimals and dust particles.
References
- (1) Adams, F. C., & Watkins, R. 1995, ApJ, 451, 314
- (2) Allain, S., Bouvier, J., Prosser, C., Marschall, L. A., & Laaksonen, B. D. 1996, A&A, 305, 498
- (3) Alonso, A., Arribas, S., & Martinez-Roger, C., 1996, A&A, 313, 873
- (4) Artymowicz, P. 1992, PASP, 104, 769
- (5) Armitage, P. J., Livio, M., Lubow, S. H., & Pringle, J. E. 2002, MNRAS, 334, 248
- (6) Asplund, M., Grevesse, N., & Sauval, A. J. 2005, ASP Conf. Ser., in press (astro-ph/0410214)
- (7) Backman, D. E., & Paresce, F., 1993, Protostars & Protoplanets III, 1253
- (8) Beckwith, S. V. W., & Sargent, A. I. 1991, ApJ, 381, 250
- (9) Beckwith, S. V. W., Sargent, A. I., Chini, R. S., & Gsten, R. 1990, AJ, 99, 924
- (10) Beichman, C. A., Bryden, G., Gautier, T. N., et al. 2005, ApJ, 626, 1061
- (11) Bodenheimer, P., & Lin, D. N. C. 2002, Annu. Rev. Earth Planet. Science, 30, 113
- (12) Boss, A. P., Wetherill, G. W., & Haghighipour, N. 2002, Icarus, 156, 291
- (13) Bryden, G., Bzyczka, M., Lin, D. N. C., & Bodenheimer, P. 2000a, ApJ, 540, 1091
- (14) Bryden, G., Lin, D. N. C., & Ida, S. 2000b, ApJ, 544, 481
- (15) Cameron, A. G. W., & Benz, W. 1991, Icarus, 92, 204
- (16) Carpenter, J. M., Wolf, S., Schreyer, K., Launhardt, R., & Henning, T. 2005, AJ, 129, 1049
- (17) Cayrel, R., Cayrel de Strobel, G., & Campbell, B. 1985, A&A, 146, 249
- (18) Chambers, J. E., Wetherill, G. W., & Boss, A. P. 1996, Icarus, 119, 261
- (19) Chambers, J. E., & Wetherill, G. W. 1998, Icarus, 136, 304
- (20) Chambers, J. E., & Cassen, P. 2002, M&PS, 37, 1523
- (21) Clarke, C. J., & Pringle, J. E. 1988, MNRAS, 235, 365
- (22) Cohen, M., & Kuhi, L. V. 1978, Conference on Protostars and Planets, Tucson, Ariz., Moon and the Planets, 19, 203
- (23) Cox, N. L. J., Kaper, L., Foing, B. H., & Ehrenfreund, P. 2005, A&A, 438, 187
- (24) Dppen, W. ed. 2000, Allen’s Astrophysical Quantities (4th ed.; New York: AIP)
- (25) Dean, J. F., Warren, P. R., & Cousins, A. W. J. 1978, MNRAS, 183, 569
- (26) Desidera, S., Gratton, R. G., Scuderi, S., et al. 2004, A&A, 405, 207
- (27) Drake, J. J., & Smith, G. 1993, ApJ, 412, 797
- (28) Drilling, J. S., & Landolt, A. U. ed. 2000, Allen’s Astrophysical Quantities (4th ed.; New York: AIP)
- (29) Eggleton, P. P., 1971, MNRAS, 151, 351
- (30) Fischer, D. A., & Valenti, J. 2003, in Scientific Frontiers in Research on Extrasolar Planets, eds. D. Deming & S. Seager (San Francisco: ASP), ASP Conf. Ser., 294, 117
- (31) Fischer, D. A., Valenti, J. A., & Marcy G. W., 2004, in IAU Symp 219 Stars as Suns: activity, evolution and planets, ed. A.K. Dupree, ASP Conf. Series, 219, 29
- (32) Fischer, D. A., & Valenti, J. A. 2005, ApJ, 622, 1102
- (33) Ford, E. B., Lystad, V., & Rasio, F. A. 2005, Nature, 434, 873
- (34) Gaidos, E. J., & Gonzalez, G. 2002, New Astronomy, 7, 211
- (35) Garaud, P., Barrire-Fouchet, L., & Lin, D. N. C. 2004, ApJ, 603, 292
- (36) Garaud, P., & Lin, D. N. C. 2004, ApJ, 608, 1050
- (37) Giampapa, M. S., Prosser, C. F., & Fleming, T. A. 1998, ApJ, 501, 624
- (38) Godon, P., & Livio, M. 1999, ApJ, 523, 350
- (39) Goldreich, P., Lithwick, Y., & Sari, R. 2004, ApJ, 614, 497
- (40) Goldreich, P., & Sari, R. 2003, ApJ, 585, 1024
- (41) Goldreich, P., & Tremaine, S. 1980, ApJ, 241, 425
- (42) Goldreich, P., & Ward, W. R. 1973, ApJ, 183, 1051
- (43) Gonzalez, G. 1997, MNRAS, 285, 403
- (44) Gratton, R. G., Bonanno, G., Claudi, R. U., Cosentino, R., Desidera, S., Lucatello, S., & Scuderi, S. 2001, A&A, 377, 123
- (45) Gray, D. F., 1992, The observation and analysis of stellar photospheres, p 356, equation (16.2)
- (46) Grevesse, N., Noels, A., & Sauval, A. J. 1996, Standard Abundances, in Cosmic Abundances, eds S. S. Holt and G. Sonneborn, ASP Conference Series 99, 117-126
- (47) Gu, P.-G., Lin, D. N. C., & Bodenheimer, P. H. 2003, ApJ, 588, 509
- (48) Gu, P.-G., Bodenheimer, P. H., Lin, D. N. C. 2004, ApJ, 608, 1076
- (49) Guillot, T., Stevenson, D. J., Hubbard, W. B., & Saumon, D. 2004, in: Jupiter. The planet, satellites and magnetosphere. Edited by Fran Bagenal, Timothy E. Dowling, William B. McKinnon. Cambridge planetary science, Vol. 1, Cambridge, UK: Cambridge University Press, p. 35 - 57
- (50) Haisch, K. E. J., Lada, E. A., & Lada, C. J. 2001, ApJ, 553, 153
- (51) Hartmann, L. 1998, Accretion Processes in Star Formation (Cambridge: Cambridge Univ. Press)
- (52) Hayashi, C., Nakazawa, K., & Nakagawa, Y. 1985, in Protostars and Planets II, ed. D. Black & M. S. Mathews (Tucson: Univ. Arizona Press), 1100
- (53) Hollenbach, D., & Adams, F. C. 2004, Debris Disks and the Formation of Planets: A Symposium in Memory of Fred Gillett, ASP Conference Series, Vol. 324, p168
- (54) Ida, S., & Lin, D. N. C. 2004a, ApJ, 604, 388
- (55) Ida, S., & Lin, D. N. C. 2004b, ApJ, 616, 567
- (56) Ikoma, M., Nakazawa, K., & Emori, H. 2000, ApJ, 537, 1013
- (57) Innanen, K., Mikkola, S., & Wiegert, P. 1998, AJ, 116, 2055
- (58) Israelian, G., Santos, N. C., Mayor, M. & Rebolo, R. 2001, Nature, 411, 163
- (59) Israelian, G., Santos, N. C., Mayor, M. & Rebolo, R. 2003, A&A, 405, 753
- (60) Israelian, G., Santos, N. C., Mayor, M. & Rebolo, R. 2004a, in Origin and Evolution of the Elements, Eds: A. McWilliam & M. Rauch. Pasadena: Carnegie Observatories, in press
- (61) Israelian, G., Santos, N. C., Mayor, M. & Rebolo, R. 2004b, A&A, 414, 601
- (62) Jeffery, C. S., Bailey, M. E., & Chambers, J. E. 1997, Obs, 117, 224
- (63) Kazarovets, E. V. & Samus, N. N. 1997, Information Bulletin on Variable Stars, 4471, 1
- (64) Kenyon, S. J., & Bromley, B. C. 2002, AJ, 123, 1757
- (65) King, J. R., Soderblom, D. R., Fischer, D., & Jones, B. F. 2000, ApJ, 533, 944
- (66) Klessen, R., & Lin, D. N. C. 2003, Physical Review E, vol. 67, Issue 4, id. 046311
- (67) Kley, W. 2003, CeMDA, 87, 85
- (68) Kokubo, E., & Ida, S. 2002, ApJ, 581, 666
- (69) Kominami, J., & Ida, S. 2002, Icarus, 157, 43
- (70) Kominami, J., & Ida, S. 2004, Icarus, 167, 231
- (71) Kupka, F., Piskunov, N. E., Ryabchikova, T. A., Stempels, H. C., & Weiss, W. W. 1999, A&AS, 138, 119 (VALD-2)
- (72) Kurucz, R. L., Furenlid, I., Brault, J., & Testerman, L. 1984, National Solar Observatory Atlas No. 1: Solar Flux Atlas from 296 to 1300 nm (Sunspot: Natl. Solar Obs.)
- (73) Lada, E. A., & Alves, J. F. 2004, IAU Symp, 221, 3
- (74) Laughlin, G., & Adams, F. C. 1997, ApJ, 491, 51
- (75) Laughlin, G., & Adams, F. C. 1998, ApJ, 508, 171
- (76) Laws, C., & Gonzalez, G. 2001, ApJ, 553, 405
- (77) Laws, C., Gonzalez, G., Walker, K. M., et al. 2003, AJ, 125, 2664
- (78) Levison, H. F., Duncan, M. J., & Wetherill, G. W. 1994, Nature, 372, 441
- (79) Lin, D. N. C., Bodenheimer, P., & Richardson, D. 1996, Nature, 380, 606
- (80) Lin, D. N. C., & Ida, S. 1997, ApJ, 477, 781
- (81) Lin, D. N. C., Nagasawa, M., & Thommes, E. W. 2005, in preparation
- (82) Lin, D. N. C., & Papaloizou, J. 1986a, ApJ, 309, 846
- (83) Lin, D. N. C., & Papaloizou, J. 1986b, ApJ, 307, 395
- (84) Lin, D. N. C., & Papaloizou, J. C. B. 1996, ARA&A, 34, 703
- (85) Lissauer, J. J. 1993, ARA&A, 31, 129
- (86) Lodders, K., 2003, ApJ, 591, 1220
- (87) Mandell, A. M., Ge, J., & Murry, N. 2004, IAU Symp, 213, 55
- (88) Marcy, G. W., Butler, R. P., Fischer, S. A., & Vogt, S. S. 2000a, IAU Symp, 202, 3
- (89) Marcy, G. W., Cochran, W. D, & Mayor, M. 2000b, in Protostars and Planets IV, ed. V. Mannings, A. P. Boss, & S. S. Russell (Tucson: Univ. Arizona Press), 1285
- (90) Martín, E. L., & Montes, D. 1997, A&A, 318, 805
- (91) Mayor, M., & Queloz, D. 1995, Nature, 378, 355
- (92) Mermilliod, J. C. 1981a, A&AS, 44, 467
- (93) Mermilliod, J. C. 1981b, A&A, 97, 235
- (94) Messina, S., Pizzolato, N., Guinan, E., & Rodoni, M. 2003, A&A, 410, 671
- (95) Morfill, G. E., & Voelk, H. J. 1984, ApJ, 287, 371
- (96) Murray, N., Hansen, B., Holman, M., & Tremaine, S. 1998, Science, 279, 69
- (97) Murray, N., Chaboyer, B., Arras, P., Hansen, B. & Noyes, R. W., 2001, ApJ, 555, 801
- (98) Nagasawa, M., & Lin, D. N. C. 2005, DDA, 36.0704
- (99) Nagasawa, M., Lin, D. N. C., & Ida, S. 2003, ApJ, 586, 1374
- (100) Nagasawa, M., Lin, D. N. C., & Thommes, E. W. 2005, in preparation
- (101) Najita, J. 2003, AAS, 202, 2411
- (102) Palmer, P. L., Lin, D. N. C., & Aarseth, S. J. 1993, ApJ, 403, 336
- (103) Papaloizou, J. C. B., Nelson, R. P., & Masset, F. 2001, A&A, 366, 263
- (104) Papaloizou, J. C. B., & Terquem, C. 2001, MNRAS, 325, 221
- (105) Pasquini, L., Randich, S., Zoccali, M., Hill, V., Charbonnel, C., & Nordstrm, B. 2004, A&A, 424, 951
- (106) Paulson, D. B., Sneden, C., & Cochran, W. D. 2003, AJ, 125, 3185
- (107) Pinsonneault, M. H., De Poy, D. L. & Coffee, M. 2001, ApJ, 556, L59
- (108) Piskunov, N. E., Kupka, F., Ryabchikova, T. A., Weiss, W. W., & Jeffery, C. S. 1995, A&AS, 112, 525 (VALD-1)
- (109) Pollack, J. B., Hollenbach, D., Beckwith, S., Simonelli, D. P., Roush, T., & Fong, W. 1994, ApJ, 421, 615
- (110) Pollack, J. B., Hubickyj, O., Bodenheimer, P., Lissauer, J. J., Podolak, M., & Greenzweig, Y. 1996, Icarus, 124, 62
- (111) Pols, O. R., Tout, C. A., Eggleton, P. P., & Han, Z., 1995, MNRAS, 274, 964
- (112) Prosser, C. F. 1993, AJ, 105, 1441
- (113) Prosser, C. F. & Giampapa, M. S. 1994, AJ, 108, 964
- (114) Randich, S., Aharpour, N., Pallavicini, R., Prosser, C. F., & Stauffer, J. R. 1997, A&A, 323, 86
- (115) Rasio, F. A., & Ford, E. B. 1996, Science, 274, 954
- (116) Reddy, B. E., Lambert, D. L., Laws, C., Gonzalez, G. & Covey, K. 2002, MNRAS, 335, 1005
- (117) Rieke, G. H., Su, K. Y. L., Stansberry, J. A., et al. 2005, ApJ, 620, 1010
- (118) Ryabchikova T. A. Piskunov N. E., Stempels H. C., Kupka F., & Weiss W. W. 1999, Physica Scripta T83, 162-173 (VALD-2)
- (119) Sandquist, E., Taam, R. E., Lin, D. N. C & Burkert, A. 1998, ApJ, 506, L65
- (120) Sandquist, E. L., Dokter, J. J., Lin, D. N. C., & Mardling, R. A. 2002, ApJ, 572, 1012
- (121) Santos, N. C., Israelian, G., & Mayor, M. 2004, A&A, 415, 1153
- (122) Schatzman, E., & Baglin, A. 1991, A&A, 249, 125
- (123) Schuler, S. C., King, J. R., Fischer, D. A., Soberblom, D. R., & Jones, B. F. 2003, AJ, 125, 2085
- (124) Sekiya, M. 1998, Icarus, 133, 298
- (125) Sekiya, M., & Ishitsu, N. 2000, Earth Planets Space, 52, 517
- (126) Shang, H., Shu, F. H., Lee, T., Glassgold, A. E. 2000, Space Science Reviews, v. 92, Issue 1/2, p. 153-176
- (127) Shen, Z.-X., Liu, X.-W., Zhang, H.-W., Jones, B. & Lin, D. N. C. 2005, in preparation
- (128) Shu, F. H., Najita, J., Galli, D., Ostriker, E., & Lizano, S. 1993, in Protostars and Planets III, ed. E. H. Levy & J. I. Lunine (Tucson: Univ. Arizona Press), 3
- (129) Smith, V. V., Cunha, K. & Lazzaro, D. 2001, AJ, 121, 3207
- (130) Soderblom, D. R. 1995, Memorie della Societa Astronomia Italiana, 66, 347
- (131) Soderblom, D. R., Stauffer, J. R., Hudon, J. D., & Jones, B. F., 1993, ApJS, 85, 315
- (132) Steenbock, W., & Holweger, H., 1981, A&A, 99, 192S
- (133) Stevenson, D. J. & Lunine, J. I. 1988, Icarus, 75, 146
- (134) Takeuchi, T., Clarke, C. J., & Lin, D. N. C. 2005, ApJ, 627, 286
- (135) Thommes, E. W., Nagasawa, M. & Lin, D. N. C. 2005, in preparation
- (136) Udry, S., Mayor, M., & Santos, N. C. 2003, A&A, 407, 369
- (137) Valenti, J. A., & Fischer, D. A., 2005, ApJS, 159, 141
- (138) Valenti, J. A., & Piskunov, N. 1996, A&AS, 118, 595
- (139) Vauclair S. 2004, ApJ, 605, 874
- (140) Vidal-Madjar, A., Lecavelier des Etangs, A., Dsert, J.-M., Ballester, G. E., Ferlet, R., Hbrard G, & Mayor, M. 2003, Nature, 422, 143
- (141) Vogt, S. S. 1992, in ESO Workshop on High Resolution Spectroscopy with the VLT, ed. M. H. Ulrich (Garching: ESO), p.223
- (142) Ward, W. R. 1981, Icarus, 47, 234
- (143) Ward, W. R. 1986, Icarus, 67, 164
- (144) Ward, W. R. 1997, ApJ, 482, 211
- (145) Wetherill, G. W., & Stewart, G. R. 1989, Icarus, 77, 330
- (146) Weidenschilling, S. J., & Cuzzi, J. N. 1993, Protostars and Planets III, ed. G. Levy & J. Lunine (Tucson: Univ. Arizona Press), 1031
- (147) Weidenschilling, S. J., & Marzari, F. 1996, DPS, 28, 1214
- (148) Wilden, B. S., Jones, B. F., Lin, D. N. C., & Soderblom, D. R. 2002, AJ, 124, 2799
- (149) Yin, Q., Jacobsen, S. B., Yamashita, K., et al. 2002, New Hf-W Data that are Consistent with Mn-Cr Chronology: Implications for Early Solar System Evolution. Lunar Planet. Sci. Conf., 33, 1700-1701.
- (150) Youdin, A. N., & Chiang, E. I. 2004, ApJ, 601, 1109
- (151) Youdin, A. N., & Shu, F. H. 2002, ApJ, 580, 494
- (152) Yu, Q., & Tremaine, S. 2001, AJ, 121, 1736