Frequency-Dependent Shift in the Image Centroid of the Black Hole at the Galactic Center as a Test of General Relativity
Abstract
The inferred black hole in the Galactic center spans the largest angle on the sky among all known black holes. Forthcoming observational programs plan to localize or potentially resolve the image of Sgr A* to an exquisite precision, comparable to the scale of the black hole horizon. Here we show that the location of the image centroid of Sgr A* should depend on observing frequency because of relativistic and radiative transfer effects. The same effects introduce a generic dependence of the source polarization on frequency. Future detection of the predicted centroid shift and the polarization dependence on frequency can be used to determine the unknown black hole spin and verify the validity of General Relativity.
1 Introduction
The individual orbits of fast-moving stars near the dynamical center of the Milky Way galaxy indicate the existence of a black hole of mass solar masses at the position of the radio/infrared source Sgr A* (Schödel et al., 2003; Ghez et al., 2005). The angular scale occupied by the horizon of this black hole, – micro-arcseconds (as), is a factor of larger than the nuclear black hole in the distant galaxy M87 and orders of magnitude larger than all other known black holes. Recent observations revealed infrared emission from the radio source Sgr A* which flares on a timescale of tens of minutes, comparable to the horizon crossing time of accreting gas (Genzel et al., 2003). This data has motivated an observational program to monitor shifts of tens of as in the centroid of the infrared image of Sgr A* due to an orbiting hot spot in the accretion flow during flares (Broderick & Loeb, 2005), using the newly constructed PRIMA instrument on Very Large Telescope (VLT) (Paumard et al., 2005). In parallel, there are plans to image Sgr A* at as resolution with a Very Large Baseline Array (VLBA) of observatories at sub-millimeter wavelengths (Miyoshi et al., 2004), at which the accreting gas is expected to be optically-thin and the black hole shadow may be recovered (Falcke et al., 2000).
The faint emission from Sgr A* is commonly interpreted as a consequence of a radiatively inefficient accretion flow around the black hole (Yuan et al., 2003). The observed break in the sub-millimeter spectrum is thought to signal the transition of the flow to the optically thin regime at wavelengths below the break. The flux below the break wavelength is expected to be dominated by emission from the vicinity of the black hole horizon, where general relativistic effects become significant. These effects result from the warping of spacetime by the black hole (e.g., gravitational redshift, rotation of polarization via parallel propagation) and the rapid motion of the disk near the innermost stable circular orbit (ISCO; e.g., Doppler shift, beaming, Lorentz boosted polarization vectors, etc.). Although attempts have been made to incorporate these effects into the determination of the unpolarized spectrum in the optically thin limit (Kurpiewski & Jaroszynski, 2000), earlier studies have not included a complete treatment of the polarization spectrum111At frequencies significantly larger than the plasma and cyclotron frequencies, treatments that assume the plasma eigenmodes are uncoupled (e.g. Bromley et al., 2001). are inappropriate. In the vacuum limit, the two plasma eigenmodes remain strongly coupled such that the polarization is parallely propagated regardless of the details of the plasma. and are not applicable to the sub-millimeter wavelength regime where the opacity is non-negligible.
Here we produce images for three variations on the model of Yuan et al. (2003), listed in Table 1, each adjusted to roughly fit the observed radio and infrared spectrum. The primary distinction between the different cases in Table 1 is the black hole spin, ranging from non-rotating to maximally rotating (). This was done using the methods employed by Broderick & Loeb (2005) and detailed in Broderick & Blandford (2003, 2004), and we direct the reader to these papers for more information. From the calculated images we compute the unpolarized and polarized spectra as well as the location of the image centroid as functions of frequency.
2 Accretion Models
We model the structure of the accretion flow based on the results of Yuan et al. (2003), who showed that the vertically-averaged electron density and temperature could have a nearly power-law dependence on radius. Here we write the density, , and temperature, , of the thermal electrons, as well as the density, , of non-thermal electrons, as having the spatial distribution
| (1) | ||||
where is the cylindrical radius relative to the black hole spin axis, and the assumed constants are listed in Table 1 for three fiducial black hole spins. In all models, the non-thermal electrons have a spectral index of 1.25 and a minimum Lorentz factor of 100. The magnetic field strength is set to be a fixed fraction () of equipartition relative to the protons and is chosen to be toroidal, as found in recent general-relativistic magnetohydrodynamic simulations (De Villiers et al., 2003). The accreting gas is assumed to be in free fall inside of the ISCO (, and for , and , respectively), and in Keplerian rotation otherwise. In all cases the disk angular momentum was aligned with the spin of the black hole.
3 Discussion
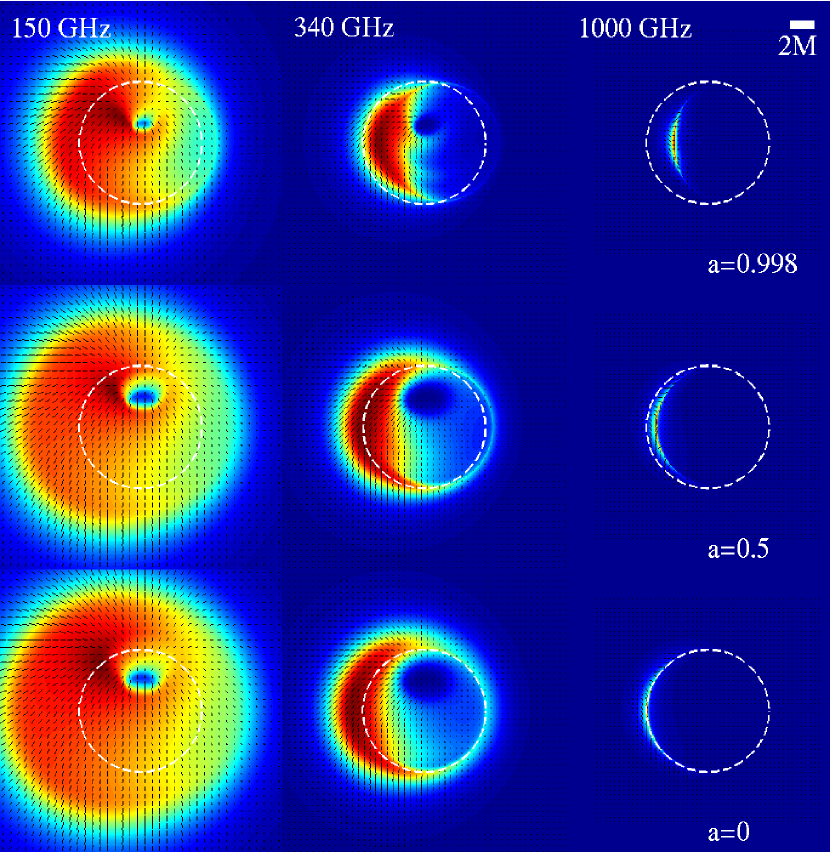
As shown in Figure 1, the photosphere becomes smaller at higher frequencies as expected. However, special relativistic aberration and the Doppler effect make the photosphere asymmetric about the rotation axis of the accretion flow. At high frequencies, the emission is dominated by a small region located on the approaching side of the disk. This has two immediate consequences: a high polarization at high frequencies (10-20%), and a definite shift in the image centroid as a function of black hole spin due to strong gravitational lensing. At frequencies the black hole “shadow” discussed by Falcke et al. (2000) (see also Takahashi, 2004; Miyoshi et al., 2004) becomes apparent. However, in contrast to previous work, the rotation of the disk makes the shadow highly asymmetric and even for the non-rotating case it only roughly follows the photon capture cross section (shown by the white dashed line). Because rotation is a generic feature of the accretion flow, it is unlikely that sub-millimeter imaging of Sgr A* will show a well defined shadow, as suggested before based on a much more simplistic model for emissivity profile.

The unpolarized and polarized spectra are shown in Figure 2. High black hole spin (and thus high Keplerian velocity at the disk inner edge) leads to a broadened sub-millimeter bump, yielding a marginally better fit to the data. Given the current uncertainties inherent in modeling the inner edge of the accretion flow, this is not necessarily evidence for spin. However, it does demonstrate the importance of relativistic effects between and . The polarized spectra shows the anticipated asymptotic behavior at high observing frequencies, which strongly discriminates between low and high spin black holes. In addition to the high frequency behavior there is a sub-millimeter bump in the polarization fraction as well. Again the data appears to marginally favor high spin. However, in this case as well, there is significant uncertainty in the emission characteristics, most notably the geometry of the magnetic field. Nevertheless, our assumption of a toroidal field is likely to be justified in the inner regions of the disk due to the strong shear present in that region.

The position of the image centroids as a function of frequency is plotted in Figure 3. As suggested by Figure 1 the image centroids asymptote to differing fixed positions at high frequencies. The asymptotic positions are determined by strong gravitational lensing, and thus are sensitive to the parameters of the black hole. In contrast, when the photosphere has a large radius (i.e., at low frequencies), the black hole spin has little influence and thus the image centroids become degenerate. The centroid location rapidly changes as the photosphere shrinks to the scale of the horizon. This necessarily occurs during the transition between the optically thick and the optically thin regimes. Therefore, high precision absolute astrometry of the image centroids at radio and infrared wavelengths can constrain the black hole spin.
While quantitative differences exist for different magnetic field geometries in both the polarized spectra and the locations of the image centroids, the qualitative characteristics (which depend only upon the asymmetric opacity and relativistic effects) remain the same. As a result, detailed multi-wavelength studies of the polarization and image centroids provide a method by which the spin of the black hole at the Galactic center may be measured.
References
- Aitken et al. (2000) Aitken D. K., Greaves J., Chrysostomou A., Jenness T., Holland W., Hough J. H., Pierce-Price D., Richer J., 2000, ApJL, 534, L173
- Bower et al. (2002) Bower G. C., Falcke H., Sault R. J., Backer D. C., 2002, ApJ, 571, 843
- Bower et al. (2003) Bower G. C., Wright M. C. H., Falcke H., Backer D. C., 2003, ApJ, 588, 331
- Broderick & Blandford (2003) Broderick A., Blandford R., 2003, MNRAS, 342, 1280
- Broderick & Blandford (2004) Broderick A., Blandford R., 2004, MNRAS, 349, 994
- Broderick & Loeb (2005) Broderick A. E., Loeb A., 2005, MNRAS, in press (astro-ph/0506433)
- Bromley et al. (2001) Bromley B. C., Melia F., Liu S., 2001, ApJL, 555, L83
- De Villiers et al. (2003) De Villiers J., Hawley J. F., Krolik J. H., 2003, ApJ, 599, 1238
- Falcke et al. (2000) Falcke H., Melia F., Agol E., 2000, ApJL, 528, L13
- Genzel et al. (2003) Genzel R., Schödel R., Ott T., Eckart A., Alexander T., Lacombe F., Rouan D., Aschenbach B., 2003, Nature, 425, 934
- Ghez et al. (2005) Ghez A. M., Salim S., Hornstein S. D., Tanner A., Lu J. R., Morris M., Becklin E. E., Duchêne G., 2005, ApJ, 620, 744
- Kurpiewski & Jaroszynski (2000) Kurpiewski A., Jaroszynski M., 2000, Acta Astronomica, 50, 79
- Miyoshi et al. (2004) Miyoshi M., Ishitsuka J. K., Kameno S., Shen Z., Horiuchi S., 2004, Progress of Theoretical Physics Supplement, 155, 186
- Paumard et al. (2005) Paumard T., Perrin G., Eckart A., Genzel R., Léna P., Schödel R., Eisenhauer F., Müller T., Gillessen S., 2005 ”ESO Astrophysics Symposia” in press, ”Scientific prospects for vlti in the galactic centre: Getting to the schwarzschild radius”
- Schödel et al. (2003) Schödel R., Ott T., Genzel R., Eckart A., Mouawad N., Alexander T., 2003, ApJ, 596, 1015
- Takahashi (2004) Takahashi R., 2004, ApJ, 611, 996
- Yuan et al. (2003) Yuan F., Quataert E., Narayan R., 2003, ApJ, 598, 301