The intriguing giant bow shocks near HH 131 111Based in part on data collected at Subaru Telescope, which is operated by the National Astronomical Observatory of Japan.
Abstract
Using the High Dispersion Spectrograph (HDS) at the Subaru Telescope, echelle spectra of two giant arcs, i.e. nebulosities Cw and L (hereafter Nebu. Cw and L, or simply Cw and L) associated with HH 131 in Orion are presented. Typical emission lines of Herbig-Haro (HH) objects have been detected towards Nebu. Cw with the broadband filter KV 408. With the low dispersion spectrograph at the National Astronomical Observatories (NAO) 2.16 m telescope, spectra of Nebu. C, L and K are obtained, which also show strong [S ] 6717/6731, H and [N ]6583 emission lines. Position-velocity distributions of Cw and L are analyzed from the long-slit spectra observed with the HDS H narrowband filter. The fastest radial velocity of Cw is –18.0 km s-1. When the flow at L goes to the south, it slows down. The fastest radial velocity of L has been observed of –45.0 km s-1 and the slowest value is about –18.3 km s-1, the radial velocity gradient is about 200 km s-1 pc-1. The similarity of the fastest radial velocity of Cw to the slowest value of L and their positional connection indicate that they are physically associated. There is a tendency for the entire flow to become less excited and less ionized when going further to the south (i.e., from Nebu. K, L to C), where the most extended (and presumably evolved) objects are seen. The electron densities of all the observed nebulosities are low (102 cm-3). Double kinematic signatures have been found in Cw from its [N ]6583 profiles while the observed H profiles of Cw are almost symmetric. Bow shock models appear to agree with the observed position-velocity diagrams of the [N ] spectra better than H spectra, and a bow shock with its wing, apex and postshock has been possibly revealed near Cw from the [N ] emission. With the suggestion that these arcs are HH shocks possibly ejected out of the Orion A molecular cloud by an uncertain source, their spectra show low to intermediate excitation from their diagnostic line ratios.
1 Introduction
Mass outflows emerge from young stellar objects (YSOs) at very early stages of star formation processes. Mass outflows are traced by Herbig-Haro (HH) objects at optical wavelengths, while molecular hydrogen and [Fe ] emission are seen at near infrared wavelengths. At mm-wavelengths bipolar molecular outflows are best observed in the lines of CO. HH objects are collisionally excited nebulae produced by outflows ejected by YSOs, and they trace either shocks where outflows ram the quiescent interstellar medium (terminal working surfaces) or shocks produced by colliding fluid elements ejected from the source at different velocities and times (internal working surfaces) (Raga et al. 1990). The conception of parsec scale HH flows has altered our understanding of optical jets and HH objects since Bally & Devine firstly discovered the giant HH 34 flow which extends about 3.4 pc (Bally & Devine 1994; Reipurth et al. 1997; Devine 1997). The total extension of an HH flow is much larger than originally thought (Mundt & Fried 1983), surpassing 1 pc in most cases. Thanks to the technical development of larger CCD arrays, wide field surveys of optical outflows have been recently carried out covering dozens of square degrees in nearby star forming regions (Yan et al. 1998; Zhao et al. 1999; Yang & Yao 2000; Wang et al. 2000, 2001; Wu et al. 2002; Sun et al. 2003; Walawender et al. 2005). Spectrographic measurements and analyses in terms of bow shock models provide a comprehensive picture of the outflow phenomenon of YSOs (Schwartz 1975; Hartigan et al. 1987; Raga et al. 1996). However, it is not yet clear in how far the pc scale HH objects impact on the surrounding interstellar medium (ISM). HH 131 and its nearby giant bow shocks possibly provide the most intriguing targets, which are located well outside the Lynds 1641 (hereafter L1641) dark cloud, i.e., about 1.5∘ southwest of L1641. In L1641 not only the largest number of HH objects (in all 70 from the list by Reipurth 1999), and the prototypical HH objects, HH 1 and HH 2, but also the first pc scale HH flow, HH 34, have been discovered. All of these HH objects are situated inside or very close to the boundary of the Orion A giant molecular cloud (GMC). With narrowband imaging Ogura (Ogura 1991) discovered HH 131 and some large nebulosities like A, B, C, …, K and L, and suggested that those nebulosities might be physically HH objects. The linear scale of a single bow shock of them is even larger than 3 pc (we adopt a distance of 450 pc). Intending to study their nature, with the SUBARU telescope we have made spectrographic observations toward Cw and L. Cw is located slightly west to the given position of C (see the image shown in Fig. 1, which was derived with the 0.6/0.9 cm Schmidt telescope at Xinglong Station of National Astronomical Observatories (NAO), Chinese Academy of Sciences). Low-dispersion spectra of C, L and K were also obtained with the spectrograph mounted at the NAO 2.16 m telescope.
2 Observation and Data Reduction
With the High Dispersion Spectrograph (HDS) at the Subaru Telescope, the observations of Nebu. Cw and L were carried out on the night of October 22/23 2001. The filters used in the observations were a broadband one named StdYc or KV 408, and a narrowband one named StdHa or H. Table 1 lists the observing targets and instrumental parameters. The slit with a width of 1.0′′ provided a spectral resolution of 36000 corresponding to a velocity resolution of 8.3 km s-1 that was confirmed by sky lines. The observed spectra were wavelength calibrated using exposures to a Th-Ar comparison lamp. The accuracy of wavelength calibration is better than 0.01 Å, or 0.5 km s-1 at H.
We obtained spectra for Cw with the KV 408 filter, the slit length was set as 5′′, its exposure time was 1800 sec. Flux calibration was achieved using echelle spectra of the standard star Hz 15 (Stone 1977), and its exposure time was 120 sec. The wavelength range covered 4390–5710 Å and 5810–7130 Å for CCD1 and CCD2, respectively. The linear dispersion of the CCD near 6600 Å was 0.04 Å pixel-1 or 1.8 km s-1.
Narrowband long-slit spectra were taken for Cw and L (see Fig. 1) with the slit at position angles of 0∘ and 150∘, respectively. The slit length was 60′′. The StdHa/H filter was used, which was centered on 6580 Å with a passband of 54.6 Å, covering H and [N ]6548/6583 emission lines. The integration time of each position was 20.5 hours. The angular scale on the CCD frame was 0.27′′ pixel-1 along the direction of the slit (CCD 22 binning mode used).
Except of overscanning dealt with a procedure provided by the SUBARU project group, data reduction has been made with the IRAF package, including bias-subtraction, flat-fielding, spectra extraction, wavelength and flux calibrations, and velocity corrections. For the observations with the H filter, wavelength calibration has to be made according to two echelle orders (Order 91 and 90) separately instead of most likely just for Order 91. Then we co-add these two calibrated spectra into one spectrum (priv. comm. with Aoki Wako and Akito Tajitsu).
In data reduction we noticed the problem caused by contamination of sky line emission. Because of the limited slit length used for the broadband mode, subtraction of the sky emission spectrum was impossible since the observed object fills the entire slit aperture. In the case of the narrowband mode, the sky emission was possibly subtracted, because the relatively much longer slit aperture used was covering regions where the signal from the object was much weaker than that at peak. These regions were taken for establishing the ‘sky spectrum’ (including a small contribution from the extended object), which was then subtracted from the ‘object spectrum’. As a consequence, the sky emission could be slightly over- or under-subtracted (see little tips or valleys at 20 km s-1 in Fig. 7 and Fig. 8).
Low-dispersion spectroscopic observations of Nebu. C, L and K were made with the NAO 2.16 m reflector using a Cassegrain spectrograph during 1999 December 5–9. The grating used was 100 Å mm-1. The slit was 4.0′ long with a width of 2.0′′. The resulting spectral resolution is 7Å. All slit orientations followed the north-south direction.
3 Results and Discussions
3.1 Emission lines
3.1.1 Low-dispersion spectra
Fig. 2 displays the low resolution spectra of Nebu. C, L and K, which were observed with the NAO 2.16 m telescope. Line identifications and integrated line intensities are presented in Table 2 . The [S ] 6717/6731, H and [N ]6583 lines have been clearly detected and show strong emission towards all the three nebulosities. Although the detections of [N ]6548 and H are certain, there are large uncertainties in their line intensities than in the former four lines. The detection of [O ]6300 emission from L is tentative due to strong contamination of sky light. Continuum emission was not detected from any of the three nebulosities. The clearly detected emission lines toward C, L and K are characteristic signatures of HH objects with strong forbidden lines and no continuum emission. No reddening correction has been applied to the emission line intensities through the entire paper. Such a correction is not critical in the interpretation of line ratios which are close in wavelength, e.g., those of H to [S ] or [S ]6717/6731.
The electron densities () listed in Table 2 have been deduced from the [S ]6717/6731 line intensity ratios assuming an electron temperature of 10,000 K (Osterbrock 1989). They tend to decrease from about 400 to less than 50 cm-3 for K, L and C.
3.1.2 HDS spectra
Towards Cw, the [S ] 6717/6731, H, [N ] 6548/6583, [O ] 6300/6363 and H emission lines have been detected in our HDS echelle spectra (Fig. 3). Continuum emission was not detected. The H and H lines present broader profiles than those of [S ] and [N ] while the case of the [O ]6300/6363 lines is less clear. Gaussian fitting parameters are given in Table 3. The detected lines suggest that Nebu. Cw possesses quite a complex kinematic structure. At least two velocity components are seen at about –15 km s-1 (It is a heliocentric velocity when not specially noted through the entire paper) and 0 km s-1, respectively. There is likely also a third component around 20–27 km s-1, which is most likely from the sky emission, or partly from the Orion star forming region. So the giant bow shock Cw is slightly moving toward us with the extreme velocity of –17.5 km s-1 seen in the [N ]6583 emission line. The complex velocity structure of Cw will be discussed in detail in Sect. 3.3.
The [S ], [N ] and [O ] lines have all emission peaks at about –15 km s-1 (in Table 4). From the line emission peak intensities, we estimate that: [S ](6717+6731)/H1.55 and [N ]6583/[S ](6717+6731)0.41. According to the integrated fluxes (in Table 3), [S ](6717+6731)/H1.54 (1.33 without the third velocity component included, and the third component of H is never counted for ratio calculations because of the certainty of H emission from the sky) and [N ]6583/[S ](6717+6731) 0.38 (0.31).
According to the total fluxes, [S ]6717/67311.34 (1.37). From the peak intensities in Table 4, [S ]6717/67311.26. This implies that the electron density is about 80–170 cm-3. The non-detection of [O ] 5007 implies that the shock velocity is less than 100 km s-1 (Hartigan et al. 1987).
3.2 What is the nature of the nebulosities?
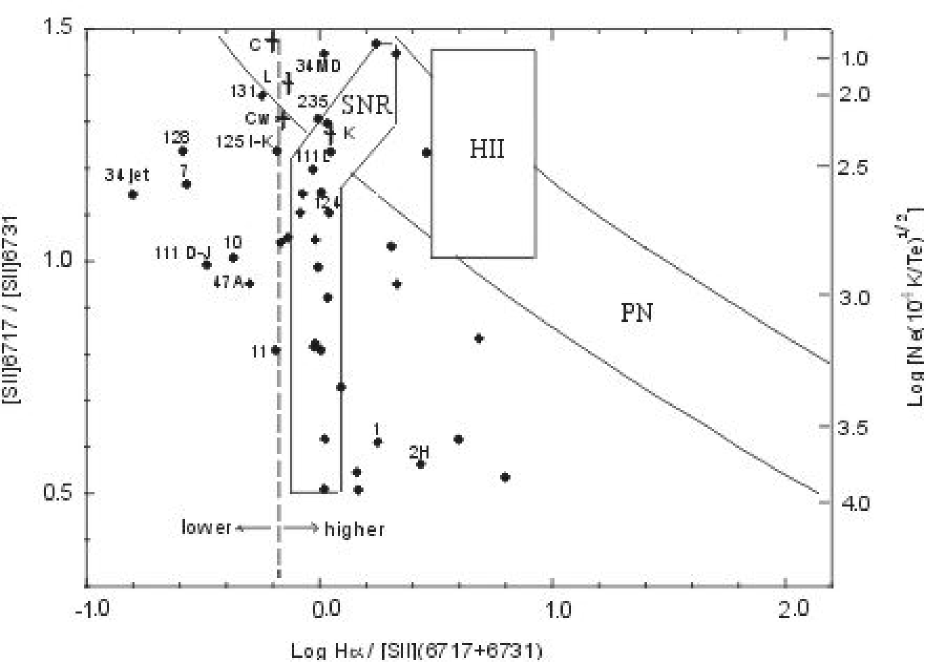
In order to explore the true nature of these nebulosities we have plotted the line ratios of H/[S ](6717+6731) versus the ratios of [S ]6717/6731 for Nebu. C, Cw, L and K in Fig. 4, comparing them with those of HH objects, compiled by Raga et al. (1996), and planetary nebulae (hereafter PNe), supernova remnants (hereafter SNRs) and H regions (adopted from the figures by Sabbadin et al. 1977 and Meaburn & White 1982). Similar to the morphology displayed in Fig. 1, in Fig. 4 Nebu. Cw (C), K and L present a physical nature very close to that of SNRs and far from that of H regions or PNe. The strong [S ] 6717/6731 and the non-detection of [O ]5007 suggest that Nebu. Cw (C), K and L cannot be SNRs (Fesen et al. 1985; Fesen & Hurford 1996). Therefore we suggest that these nebulosities are HH shocks. In Fig. 4 Nebu. Cw (C), K and L have line ratios similar to those of HH 125 I–K, HH 131, HH 128, HH 111 L, HH 235 (or GGD 35), HH 34MD and HH 124 A–C. It is especially interesting that HH 125 and HH 124 also present large bow shocks (Walsh et al. 1992). HH 128, HH 34MD, HH 111 L and possibly HH 235 are parts of individual pc scale HH objects (Reipurth et al. 1997; Ray et al. 1990,). One giant part of the HH 111 flow, i.e. HH 311, extends out to 5.5′ (0.7 pc at a distance of 450 pc, Reipurth et at. 1997), which has been previously thought as the largest extension of an HH bow shock. Nebu. C extends more than 26 ′, i.e. 3.4 pc with D 450 pc. It is much larger than the former one.
Raga et al. (1996) made statistics on a large fraction of optical spectra of HH objects and derived a quantitative criterion to divide HH spectra into the high, intermediate and low excitation categories. A dashed vertical line in Fig. 4 shows the division of high/intermediate excitation (to the right side) and low excitation of HH spectra (to the left side) according to the line ratio of [S ](6717+6731)/H with a value of 1.5. The intensity ratios of [SII](6717+6731)/H are 1.6, 1.4, and 0.9 for Nebu. C (Cw), L and K, respectively. With the clear criterion and the non-detection of [O ]5007, their spectra show low to intermediate excitation. The excitation tends to decrease from Nebu. K, L to C, that is, there is a tendency for the flow to become less excited when going further to the south.
3.3 Position-velocity distributions of Nebu. Cw and L
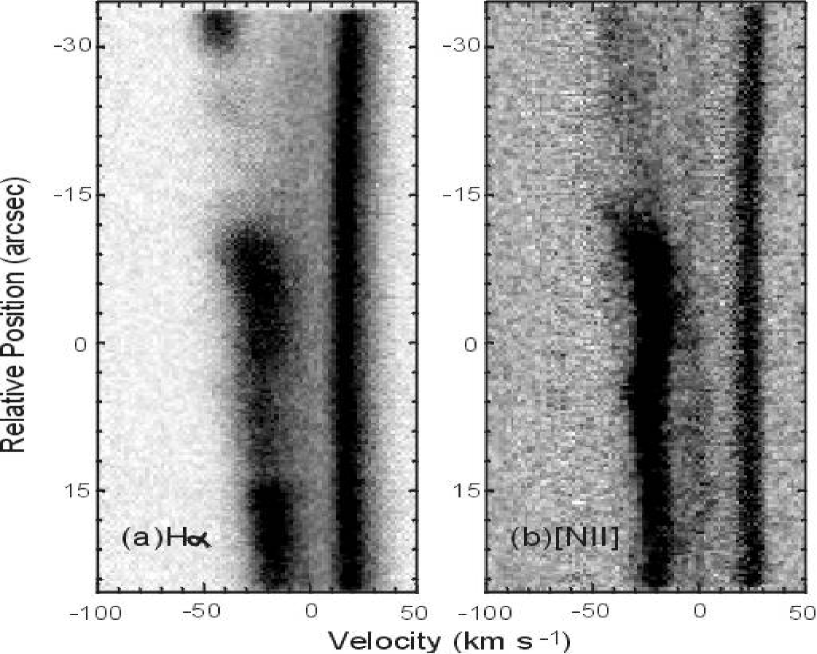
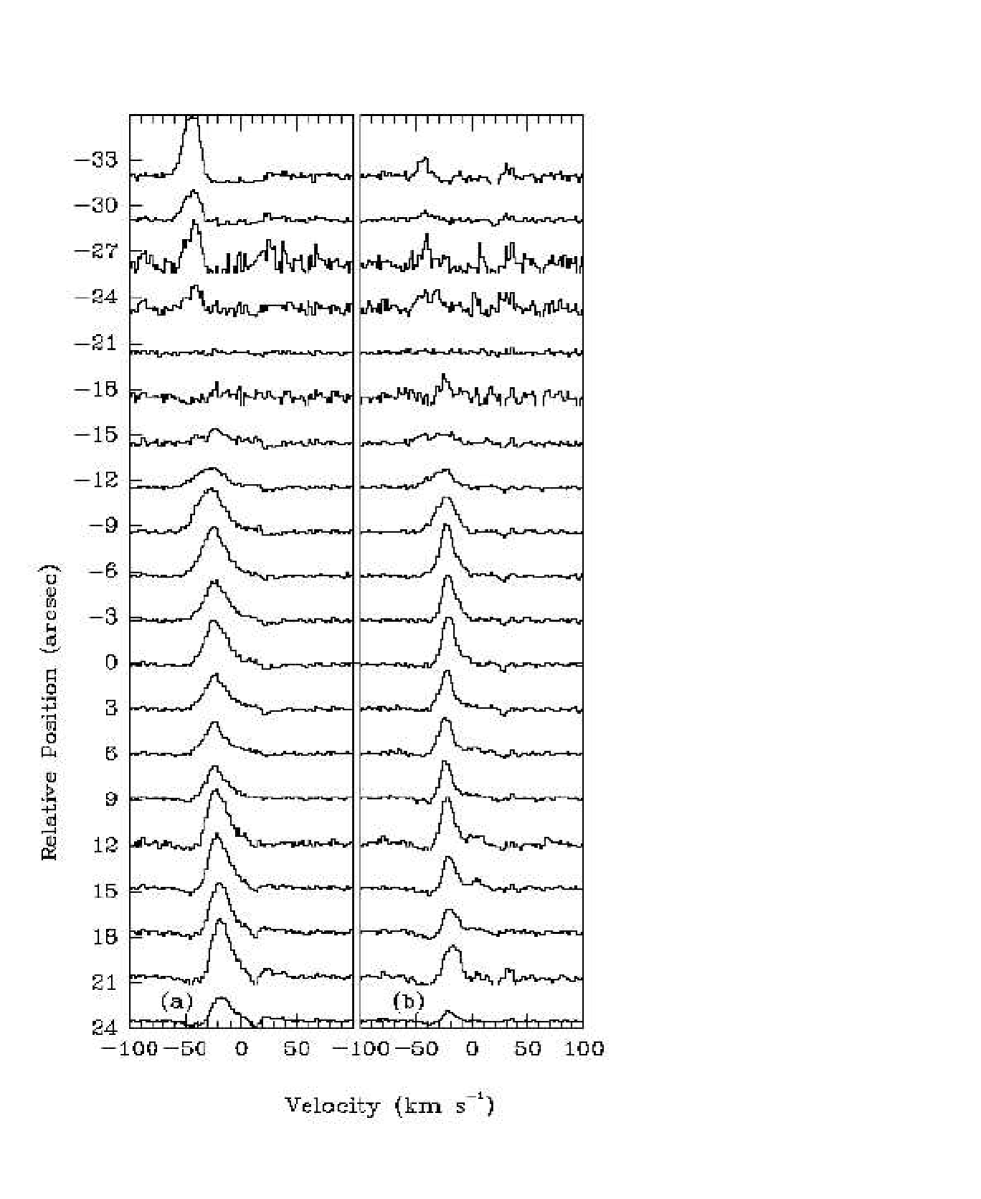
Figs. 5 and 6 display the position-velocity diagrams obtained from the long-slit spectra of Nebu. Cw and L, respectively. We have detected three emission lines, H at 6563 and [N ] at 6583 and 6548 Å. [N ]6548 is the faintest of the three lines, only clearly seen at the brightest positions with the relative position (hereafter denoted as Y) at –6–0′′ for both Cw and L, and is thus not displayed or further analyzed. For each line one component () at 20–25 km s-1 is relatively homogeneous through the entire slit and has been identified as sky emission (Fig. 5 and 6). Similar velocity values of [N ]6548 and [S ] 6717/6731 have also been estimated in Table 3. In Fig. 5 the other two velocity components are clearly seen in [N ] towards Cw. One is at about 0 km s-1 () and the other is around –15 km s-1 (). The component appears to be blended with some background emission, which possibly represents emission from the local star forming region. The component is also likely contaminated with a fainter similar background. At H a bright feature has been observed at the same position as the [N ] line with Y around 0′′. However, the two velocity components have not been discerned at H while the background is strong. In Fig. 6 it is shown that the position-velocity diagrams of both H and [N ] of L are different from Cw. They present less complex velocity features showing that the emission is possibly from several spatially separate parts. Dividing each line into twenty spatially equal parts (each part corresponds to 3′′), spectra have been extracted. And Figs. 7 and 8 give their profiles with the sky emission component () subtracted in the way described in Sect. 2.
In general, with Declination () increasing, i.e. with Y increasing in Cw and decreasing in L, both Cw and L tend to have more negative velocity values (see Fig. 5–8). In the following we present and discuss their individual features in detail.
At Y=0.0′′ Nebu. Cw is brightest with the velocity of –18.0 km s-1. The emission starts to be seen at Y=–21.0′′ with 3.7 km s-1. The component becomes brighter with increasing Y when Y=–21′′ – –15.0′′. At Y=–12.0′′ the profile shows clearly double peaked feature with =–0.1 km s-1 and =–17.4 km s-1. Above Y=–9.0′′, the component begins to be brighter than while gets closer and closer to . At Y=–6.0′′–0.0′′ the emission becomes brightest while the component disappears; then the emission gets fainter with Y increasing till it almost disappears at Y15.0′′. H is obviously broader than [N ]6583, and likely the corresponding and components of H are blended, therefore, the above variations of velocities and intensities with different positions are only barely seen. Fig. 9 displays the Gaussian fitting parameters of the [N ]6583 profiles of Cw varying with positions, including the central velocity in (a), FWHM in (b), the relative central intensity in (c) and the peak intensity in (d) where the component is indicated with filled circles and the one with open symbols.
For Nebu. L the velocity distribution is different from Cw. Except of a slight wiggle around Y=6′′, as a whole with Y increasing the velocity decreases while the emission intensity has maxima at three positions (–33.0′′, –6.0′′ and 21.0′′) (see Fig. 6 and 8). At Y=–33.0′′, Nebu. L has its fastest velocity value of –43.4 km s-1 measured in [N ]6583, and –44.5 km s-1 in H. The slowest velocity –18.3 km s-1 is reached at Y=21.0′′, which approximates to of Cw. The fastest radial velocity of Cw is similar to slowest value of Nebu. L. Together with their positional connection, this indicates that they are physically associated. So when Nebu. L goes further to the south, it slows down with a radial velocity gradient of 200 km s-1 pc-1, which is comparable to that of the blue or the red lobe of the HH 34 flow (Devine et al. 1997).
3.4 Comparison of observations with bow shock models
Line profiles and position-velocity diagrams have been theoretically predicted by Hartigan et al. (1987) and Raga & Böhm (1986) for a bow shock. They assume that a large fraction of the bow shock falls in the slit. In addition, they have showed that as the slit width changes the predicted line profiles alter radically, and profiles can also be significantly different from one line to the other with the same slit width (Figs. 3e, 3t and 3v of Hartigan et al. 1987). For our case, the slits actually sample a very small region of the enormous arcs. So, when we compare our observation results with their predictions, it might be reasonable that some disagreements will occur.
Hartigan et al. (1987) presented theoretical line profiles of bow shock models with different shock velocities () and orientations (denoted by , which is the angle of the plane of the sky w.r.t. the axis of symmetry of the bow shock). For Nebu. Cw a low shock velocity can be derived from the [N ]6583 line rather than from H (shock velocity equals 45.0 km s-1, where is the full width at zero intensity level). Double-peak H profiles occur only when 150 km s-1 and 45∘ ( is adjusted to follow the definition by Raga & Böhm (1986)). However, such double kinematic signatures have been found in the [N ]6583 profiles of Cw. The observed H profiles of Cw are almost symmetric. Comparing the computed position-velocity diagrams of [N ]6583 with those of H predicted by Raga & Böhm (1986) in their Figs. 2 and 3, we note that at each the [N ]6583 diagram has more delicate structures at peaks than H although both appear very similar. Thus, the difference of observation results at [N ]6583 and H may be explained. When carefully comparing the computed position-velocity diagrams of [N ]6583 with our observations we do not find a certain range of well constrained (possibly 45∘).
According to the models of Hartigan et al. (1987), which are in general made for H profiles, when =90∘ the two peaks arise from different areas on the bow shock; the high radial velocity component arises from near the apex, and the low radial velocity from the wings. As decreases, the distinction between peaks becomes less clear, since the expansion of postshock material distributes emission over a range of radial velocities. Toward Nebu. Cw we have explicitly seen how the fast velocity component and the slow one vary with positions in [N ]6583 instead of in H. At Y=–21.0′′– –15′′, [N ]6583 profiles only show the slow velocity component, which might be due to the wing of the shock. At Y=–12.0′′– –9′′, the profiles are double peaked with both the slow and the fast velocity components ( and ), which could be from the transition region of the wing and the apex. At Y=–6′′–0′′, the profiles are brightest with only the fast velocity emission that is from the shock apex. At Y=3′′–12′′, the profiles present increasingly getting weaker emission with broader component which is likely due to the expansion of postshock material. Similar analyses of velocity structures obtained with line profiles of [Fe ]1.644m lines were given by Pyo et al. (2002) for L1551 IRS 5.
3.5 Possible origin and more on the nature of the giant bow shocks
As we have known from their prominent similarities of PNe, SNRs, H regions and HH objects, and therefore lots of confusion made in history, now we are about to re-examine the nature of these giant arcs. Firstly they are not PNe which are usually symmetrical and possess small scales. Secondly, it’s very unlikely for them to be from SNRs. By far no SNRs have been found near these arcs. Thirdly, can they belong to the extremely large H region, the Barnard’s Loop (BL)? The much more diffuse nebulae to the west (Fig. 1) are most likely due to BL. Heiles et al. (2000) find that in BL 2.0 cm-3, which is one to two orders of magnitude lower than the values of the nebulosities we have measured. If these arcs were related to BL, it would be a real problem for so diffuse nebulae to be locally enhanced into such well defined structures. So it becomes highly possible that these arcs are HH shocks. In view of rather low radial velocities (20–40 km s-1, or – 5– 25 km s-1), more extended morphology features, and the narrow line width ( 45.0 km s-1), the bow shocks observed by us cannot be taken as normally defined HH objects. Additionally, there is neither YSO nor molecular dense gas nearby these shocks, these striking features could come from somewhere far away. The spatial extent which HH objects or jets can flow through, has been realized from typical 0.3 to 3 pc, and then even 10 pc, we now have no reason to suspect that some HH objects could even pass through a larger scale. These nebulosities are possibly the case.
As already intuitively suggested by Fig. 1 and kinematically analyzed in previous sections, it turns out that these nebulosities loose velocity and excitation, but gain size when moving southwards, i.e. going south from Nebu. K to C. So the center of expansion is somewhere in the north. Inspecting the large scale distribution of the giant bipolar HH flows investigated by Reipurth et al. (1998) and Mader et al. (1999), Nebu. C is aligned with HH 404, HH 403 and HH 127 (Fig. 10), which are on the direction with a position angle (P.A.) of 16∘, while HH 131, HH 127 and the L1641-N VLA source are on a line with P.A.11∘. HH 404, HH 403 and HH 127 form a giant bipolar HH flow driven by L1641-N VLA (Reipurth et al. 1998). We wonder if Nebu. C is associated with the giant HH flow or not. If HH 131, Nebu. C and L were driven by the VLA source, the distance that the bow shocks have moved through would be 15 pc, the age of the shocks would be about 2105 yr provided the average velocity of the shocks is 100 km s-1 when they flow through ISM. However, the VLA source is a deeply embedded YSO, and therefore unlikely to be the source. Meanwhile we note that the features A,B, C, and D are located close to the shocks (Mader et al. 1999), the brightest two of which, B and D, have been identified as HH 480 and 479, respectively (Yang & Yao, 2000). It is interesting that B and D present unusual morphologies too. Their positions are indicated in Fig. 10. They are likely to be related with the nebulosities discussed in the paper. HH 479, 127 and 61/62 just emerge at the western edge of the Orion A GMC, while HH 131 and the nebulosities nearby are totally located out of the GMC. The bright features (Nebu. C/Cw, L and K) might have been ejected out of the GMC by some source in M42 or NGC1999. And later on they continue expanding in rather sparse ISM and keep well their morphology. Proper motion studies are highly desirable to constrain the location of their energy source.
4 Conclusions
We have carried out echelle spectrographic observations toward two giant bow shocks (Nebu. Cw and L) associated with HH 131 in Orion using the HDS at the Subaru Telescope. With the low dispersion spectrograph at the NAO 2.16 m telescope, spectra of Nebu. C, L and K have been obtained. Position-velocity distributions of Nebu. Cw and L have been analyzed from the long-slit spectra observed with the HDS H narrowband filter. We summarize the conclusions as follows:
Strong [S ] 6717/6731, H and [N ]6583 emission lines have been detected towards Nebu. C, Cw, L and K. The electron densities of all the observed nebulosities are low (102 cm-3), which have been deduced from the line ratio of [S ]6717/6731. The excitation and electron density tend to decrease from K, L to C, so there is a tendency for the flow to become less excited and less ionized when going further to the south, where the most extended (and presumably evolved) objects are seen.
Double kinematic signatures have been found in Nebu. Cw from its [N ]6583 profiles. The observed H profiles of Cw are almost symmetric. Bow shock models agree with the observed position-velocity diagrams of [N ] to a higher degree than with H spectra, and a spatially resolved bow shock with its wing, apex and postshock is likely revealed near Cw from the [N ] emission.
The fastest radial velocity of Nebu. Cw is –18.0 km s-1. When the flow at L goes to the south, it slows down. The fastest radial velocity of L is –45.0 km s-1 and the slowest value is about –18.3 km s-1. The radial velocity gradient is about 200 km s-1 pc-1. The similarity of the fastest radial velocity of Cw to the slowest value of L and their spatial connection indicate that they are physically associated.
The high line ratio of [S ](6717+6731)/H and the non-detection of [O ]5007 suggest that Nebu. C, Cw, L and K are characterized by low to intermediate excitation HH spectra.
No certain source has been assigned to drive these giant features. They might have been ejected out of the Orion A GMC, later on they continue expanding in rather sparse ISM and keep well their morphology.
References
- Bally (1994) Bally, J., & Devine, D., 1994, ApJ, 428, L65
- Bally (1987) Bally, J., Langer, W., Stark, A., & Wilson, R., 1987, ApJ, 312, L45
- Cox (1999) Cox, A. N., 1999, ‘Allen’s Astrophysical Quantities’, Fourth Edition, Springer-Verlag NewYork Thesis (PHD).
- Devine (1997) Devine, D., 1997, PhDT, Unversity of Colorado, Boulder, AAT 9800519
- Devine (1997) Devine, D., Bally, J., Reipurth, B., & Heathcote, S., 1997, AJ, 114, 2095
- Fesen et al (1985) Fesen, R. A., Blair, W. P., & Kirshner, R. P., 1985, ApJ, 292, 29
- Fesen (1996) Fesen, R. A. & Hurford, A. P., 1996, ApJ, 106, 563
- Hartigan (1987) Hartigan, P., Raymond, J., & Hartmann, L., 1987, ApJ, 316,323
- Heiles (2000) Heiles, C., Haffner, L. M., Reynolds, R. J., & Tufte, S. L., 2000, ApJ, 536, 335
- Mader (1999) Mader, S. L., Zealey, W. J., Parker, Q, A., & Masheder, M. R.W., 1999, MNRAS, 310, 331
- Meaburn (1982) Meaburn, J., & White, N. J., 1982, MNRAS, 199, 121
- Mundt (1983) Mundt, R. & Fried, J. W., 1983, ApJ, 274, L83
- Noguchi (2002) Noguchi, K., Aoki, W., Kawanomoto, S., et al., 2002, PASJ, 54, 855
- Ogura (1991) Ogura, K., 1991, AJ, 101, 1803
- Osterbrock (1989) Osterbrock, D. E., 1989, Astrophysics of Gaseous Nebulae and Active Galactic Nuclei (Mill Vally: University Science Books)
- Pyo (2002) Pyo, T., Hayashi, M., Kobayashi, N., Terada, H., Goto, M., Yamashita, T., Tokunaga, A., & Itoh, Y., 2002, ApJ, 570, 724
- Raga (1986) Raga, A. C. & Böhm, K. H., 1986, ApJ, 308, 829
- Raga (1990) Raga, A. C., Cantó, J., Binette, L., & Calvet, N., 1990, ApJ, 364, 601
- Raga (1996) Raga, A. C., Böhm, K. H., & Cantó, J., 1996, RevMexAA, 32, 161
- Ray (1990) Ray, T. P., Poetzel, R., Solf, J., & Mundt, R., 1990, ApJ, 357, 45
- Reipurth (1997) Reipurth, B., Bally, J., & Devine, D., 1997, AJ, 114, 2708
- Reipurth (1999) Reipurth, B., ‘A General Catalog of Herbig-Haro Objects’, 2rd Edition, 1999, http://casa.colorado.edu/hhcat
- Reipurth (1998) Reipurth, B., Devine, D., & Bally, J., 1998, AJ, 116, 1396
- Sabbadin (1977) Sabbadin, F., Minello, S., & Bianchini, A., 1977, A&A, 60, 147
- Schwartz (1975) Schwartz, R. D., 1975, ApJ, 195, 631
- Stone (1977) Stone, R. P. S. 1977, ApJ, 218, 767
- Sun et al. (2003) Sun, K., Yang, J., Luo, S., Wang, M., Deng, L., Zhou, X., & Chen, J. 2003, ChJAA, 3, 458
- Walawender (2005) Walawender, J., Bally, J., & Reipurth, B., 2005, AJ, 129, 2308
- Walsh (1992) Walsh J. R., Ogura, K., & Reipurth, B., 1992, MNRAS, 257, 110
- Wang et al. (2001) Wang, H., Yang, J., Wang, M., Deng, L., Yan, J., & Chen, J. 2001, AJ, 121, 1551
- Wang et al. (2000) Wang, M., Zhao, B., Yang, J., Deng, L., & Chen, J. 2000, Chin. Phys. Lett., 17, 304
- Wu et al. (2002) Wu, J., Wang, M., Yang, J., Deng, L., & Chen, J. 2002, AJ, 123, 1986
- Yang and Yao (2000) Yang, J., & Yao, Y., 2000, IAUS, 197, 213
- Yan et al. (1998) Yan, J., Wang, H., Wang, M., Deng, L., Yang, J., & Chen, J., 1998, AJ, 116, 2438
- Zhao et al. (1999) Zhao, B., Wang, M., Yang, J., Wang, H., Deng, L., Yan, J., & Chen, J. 1999, AJ, 118, 1347
| Object | (J2000) | (J2000) | Slit P.A. (∘) | Slit Length(′′) | Exp. T. (s) | Filter |
|---|---|---|---|---|---|---|
| ……..spectrograph at NAO 2.16 m: | ||||||
| Nebu. C | 05:33:51.36 | -08:42:38.7 | 0 | 240 | 18003 | |
| Nebu. L | 05:34:27.12 | -08:34:24.3 | 0 | 240 | 18001 | |
| Nebu. K | 05:34:19.37 | -08:32:01.7 | 0 | 240 | 18001 | |
| ……..HDS at SUBARU 8.2 m: | ||||||
| Nebu. Cw | 05:33:48.98 | -08:42:45.6 | 0 | 5 | 18001 | KV 408 |
| Nebu. Cw | 05:33:49.04 | -08:42:46.5 | 0 | 60 | 18002 | H |
| Nebu. L | 05:34:26.27 | -08:34:18.0 | 150 | 60 | 18002 | H |
| Identification | Integrated IntensityaaIntegrated intensities of H of Nebu. C, L and K are 8.710-15, 4.410-15 and 4.310-15 erg cm-2 s-1, respectively. | ||||||
|---|---|---|---|---|---|---|---|
| Nebu. C | Nebu. L | Nebu. K | |||||
| H | 4861 | 39bbUncertain | 39bbUncertain | 71bbUncertain | |||
| [O ] | 6300 | … | 29bbUncertain | … | |||
| [N ] | 6548 | 17bbUncertain | 19bbUncertain | 16bbUncertain | |||
| H | 6563 | 100 | 100 | 100 | |||
| [N ] | 6583 | 62 | 57 | 42 | |||
| [S ] | 6717 | 95 | 79 | 50 | |||
| [S ] | 6731 | 64 | 57 | 39 | |||
| (cm-3)ccElectron densities according to the line ratios of [S ]6717/6731 (Osterbrock 1989) | 40 | 40 | 400 | ||||
| Line | Center | Core | FWHM | Flux | V | |
|---|---|---|---|---|---|---|
| (Å) | (10-16erg cm-2 s-1 Å-1) | (Å) | (10-16erg cm-2 s-1) | (km s-1) | ||
| H | 4861.058 | 11.07 | 0.401 | 4.72 | 1.13 | -16.17 |
| 4861.250 | 12.67 | 0.211 | 2.85 | 0.60 | -4.32 | |
| 4861.724a(b)a(b)footnotemark: | 9.59 | 0.564 | 5.76 | 1.59 | 24.93 | |
| [O ]6300 | 6299.996 | 5.01 | 0.234 | 1.25 | 0.21 | -14.67 |
| 6300.338 | 1.78 | 0.202 | 0.38 | 0.19 | 1.62 | |
| 6300.745aaAll emission most likely from the sky light | 233.70 | 0.162 | 40.21 | 2.15 | 21.00 | |
| 6300.987bbEmission possibly from the sky light or partly from the local star forming region | 3.43 | 0.160 | 0.58 | 0.15 | 32.52 | |
| [O ]6363 | 6363.393 | 3.45 | 0.311 | 1.14 | 0.32 | -18.06 |
| 6363.738 | 2.41 | 0.104 | 0.27 | 0.11 | -1.79 | |
| 6364.214aaAll emission most likely from the sky light | 81.31 | 0.152 | 13.12 | 0.43 | 20.65 | |
| 6364.581bbEmission possibly from the sky light or partly from the local star forming region | 1.43 | 0.406 | 0.62 | 0.42 | 37.95 | |
| [N ]6548 | 6547.718 | 5.39 | 0.330 | 1.90 | 0.22 | -15.21 |
| 6548.049 | 2.31 | 0.323 | 0.79 | 0.21 | -0.05 | |
| 6548.638bbEmission possibly from the sky light or partly from the local star forming region | 1.93 | 0.465 | 0.95 | 0.31 | 26.94 | |
| H | 6562.481 | 17.15 | 0.592 | 10.81 | 0.82 | -14.58 |
| 6562.690 | 13.70 | 0.189 | 2.76 | 0.26 | -5.03 | |
| 6563.231a(b)a(b)footnotemark: | 14.18 | 0.529 | 7.99 | 0.73 | 19.70 | |
| [N ]6583 | 6583.067 | 16.48 | 0.167 | 2.92 | 0.22 | -17.45 |
| 6583.304 | 8.95 | 0.292 | 2.78 | 0.38 | -6.65 | |
| 6583.989bbEmission possibly from the sky light or partly from the local star forming region | 5.33 | 0.387 | 2.19 | 0.51 | 24.56 | |
| [S ]6717 | 6716.097 | 24.20 | 0.290 | 7.47 | 0.40 | -15.32 |
| 6716.377 | 12.21 | 0.231 | 3.00 | 0.32 | -2.81 | |
| 6717.044bbEmission possibly from the sky light or partly from the local star forming region | 2.89 | 0.477 | 1.47 | 0.66 | 26.98 | |
| [S ]6731 | 6730.543 | 17.57 | 0.345 | 6.45 | 0.50 | -12.17 |
| 6730.833 | 3.25 | 0.340 | 1.18 | 0.49 | 0.76 | |
| 6731.412bbEmission possibly from the sky light or partly from the local star forming region | 3.22 | 0.374 | 1.28 | 0.54 | 26.56 | |
| Line | Peak | Vr | ||
|---|---|---|---|---|
| (Å) | (Å) | 10-16erg cm-2 s-1 Å-1) | (km s-1) | |
| 4861.195 | 4861.32bb from ‘Allen’s Astrophysical Quantities’, 1999 | H | 21.14 | -7.71 |
| 6299.967 | 6300.304aa from the atomic line list by the University of Kentucky (see http://www.pa.uky.edu/peter/atomic) | [O ] | 4.58 | -16.05 |
| 6363.415 | 6363.776aa from the atomic line list by the University of Kentucky (see http://www.pa.uky.edu/peter/atomic) | [O ] | 4.23 | -17.02 |
| 6547.718 | 6548.05aa from the atomic line list by the University of Kentucky (see http://www.pa.uky.edu/peter/atomic) | [N ] | 5.39 | -15.21 |
| 6562.679 | 6562.80aa from the atomic line list by the University of Kentucky (see http://www.pa.uky.edu/peter/atomic) | H | 25.75 | -5.53 |
| 6583.067 | 6583.45bb from ‘Allen’s Astrophysical Quantities’, 1999 | [N ] | 16.28 | -17.45 |
| 6716.107 | 6716.44aa from the atomic line list by the University of Kentucky (see http://www.pa.uky.edu/peter/atomic) | [S ] | 22.41 | -14.87 |
| 6730.543 | 6730.816aa from the atomic line list by the University of Kentucky (see http://www.pa.uky.edu/peter/atomic) | [S ] | 17.57 | -12.17 |