The kinetic temperature of a molecular cloud at redshift 0.7: Ammonia in the gravitational lens B0218+357 ††thanks: Based on observations with the 100-m telescope of the Max-Planck-Institut für Radioastronomie (MPIfR) at Effelsberg
Using the Effelsberg 100-m telescope, absorption in the (,) = (1,1), (2,2) and (3,3) inversion lines of ammonia (NH3) was detected at a redshift of = 0.6847 toward the gravitational lens system B0218+357. The 2 cm absorption peaks at 0.5–1.0% of the continuum level and appears to cover a smaller fraction of the radio continuum background than lines at millimeter wavelengths. Measured intensities are consistent with a rotation temperature of 35 K, corresponding to a kinetic temperature of 55 K. The column density toward the core of image A then becomes (NH3) 11014 cm-2 and fractional abundance and gas density are of order (NH3) 10-8 and (H2) 5103 cm-3, respectively. Upper limits are reported for the (2,1) and (4,4) lines of NH3 and for transitions of the SO, DCN, OCS, SiO, C3N, H2CO, SiC2, HC3N, HC5N, and CH3OH molecules. These limits and the kinetic temperature indicate that the absorption lines are not arising from a cold dark cloud but from a warm, diffuse, predominantly molecular medium. The physical parameters of the absorbing molecular complex, seen at a projected distance of 2 kpc to the center of the lensing galaxy, are quite peculiar when compared with the properties of clouds in the Galaxy or in nearby extragalactic systems.
Key Words.:
Galaxies: abundances – Galaxies: ISM – Quasars: individual: B0218+357 – Quasars: absorption lines – Radio lines: galaxies1 Introduction
With an image separation of 334 mas B0218+357 is one of the most compact gravitational lens systems known to date (O’Dea et al. odea92 (1992); Patnaik et al. patnaik93 (1993)). The lensed source, possibly a BL Lac object (Kemball et al. kemball01 (2001)), is located at a redshift of 0.94 (Cohen et al. cohen03 (2003)) and shows a complex radio structure with two dominating compact sources, A and B, and an Einstein ring (e.g. Biggs et al. 2001a ). A time delay of order 10 days has been measured between the two compact sources (Corbett et al. corbett96 (1996); Biggs et al. biggs99 (1999), 2001b ; Cohen et al. cohen00 (2000)). Absorption from the lensing galaxy, a face-on spiral likely of type Sa/Sab (York et al. 2005), is observed at a redshift of =0.68466 at optical wavelengths (Brown et al. browne93 (1993); Stickel & Kühr stickel93 (1993)) and, remarkably, in the 21 cm line of Hi (Carilli et al. carilli93 (1993)) and in numerous radio- and millimeter-wavelength lines from a variety of molecules. The absorption is observed against the compact component A which is, at radio waves, 3 times stronger than component B (e.g. Patnaik et al. patnaik93 (1993)). Detected molecular species are CO, HCN, and HCO+ (Wiklind & Combes wiklind95 (1995)), H2CO (Menten & Reid menten96 (1996)), H2O (Combes & Wiklind combes97 (1997)), CS (Combes et al. combesetal97 (1997)), OH (Kanekar et al. kanekar03 (2003)) and tentatively also LiH (Combes & Wiklind combes98 (1998)). The molecular spectra, combined with 21 cm Hi absorption profiles, have been used to constrain the temporal evolution of the fine structure constant (e.g. Carilli et al. carilli00 (2000); Murphy et al. murphy01 (2001); Kanekar & Chengalur kanekar04 (2004)). The nature of the cloud, however, is poorly understood.
One of the less well known parameters of extragalactic molecular clouds is the kinetic gas temperature. With area filling factors that are not well known, a thermalized tracer like CO cannot be used to determine . Better thermometers are symmetric top molecules, where relative level populations are determined predominantly by collisions. The two most prominent such molecules are NH3 and CH3CN. While extragalactic CH3CN was so far only detected in NGC 253 (Mauersberger et al. mauers91 (1991)), various NH3 ‘inversion’ lines, from the (,) = (1,1) up to the (6,6) and even the (9,9) line, have now been observed in the nuclear regions of nearby (0.001) galaxies (e.g. Martin & Ho martin86 (1986); Henkel et al. henkel00 (2000); Takano et al. takano00 (2000), takano02 (2002); Weiß et al. weiss01 (2001); Mauersberger et al. mauers03 (2003)).
B0218+357 provides a unique view onto a molecular cloud seen at about half a Hubble time in the past (-cosmology with =71 km s-1 Mpc-1, = 0.27 and = 0.73; Spergel et al. 2003). In an attempt to constrain the physical properties of this cloud at a luminosity distance of 3 Gpc, we have searched for NH3 and other molecular species.
| (GHz) | (arcsec) | (K) | |
|---|---|---|---|
| 5.9 | 130 | 35 | 0.53 |
| 13.7–17.8 | 65–50 | 50 | 0.40 |
| 21.6–25.8 | 40–35 | 50 | 0.35 |
| 43.0–43.2 | 22 | 125 | 0.16 |
Full width to half power (FWHP) beam widths
System temperatures in units of antenna temperature ()
Aperture efficiencies, see the Effelsberg calibration pages in www.mpifr-bonn.mpg.de
2 Observations
All observations were made with the 100-m telescope at Effelsberg/Germany. In August 2001 and June 2002 we searched, employing a single channel 1.9 cm HEMT receiver, for ammonia (NH3), sulfur monoxide (SO), methanol (CH3OH), the SiC2 radical, cyanodiacetylene (HC5N) and carbonylsulfide (OCS). The measurements were carried out in a position switching mode. In December 2001 we used a dual channel 1.3 cm HEMT receiver to search for cyanoacetylene (HC3N) and silicon monoxide (SiO) in its ground vibrational state (see Tables 1 and 2). These measurements were made in a dual beam switching mode with a beam throw of 2′ and a switching frequency of 1 Hz. In January 2002, we also employed a single-channel 7 mm HEMT receiver to search for formaldehyde (H2CO) and deuterated hydrogen cyanide (DCN). These observations were made in a position switching mode. Most recently, in June 2003, a two channel 5 cm HEMT receiver was used to search for the =1–0 =3/2–1/2 transition of the C3N radical.
Frequencies, beamwidths, system temperatures and aperture efficiencies are given in Table 1. For all measurements we employed an ‘AK 90’ autocorrelator with eight spectrometers, using bandwidths of 40 MHz and 512 channels (20 MHz and 1024 channels and 80 MHz and 256 channels at 5 cm and 7 mm, respectively). Calibration was obtained from measurements of NGC 7027 (Ott et al. ott94 (1994)). Pointing corrections could be obtained toward B0218+357 itself and were accurate to better than 10′′.
3 Results
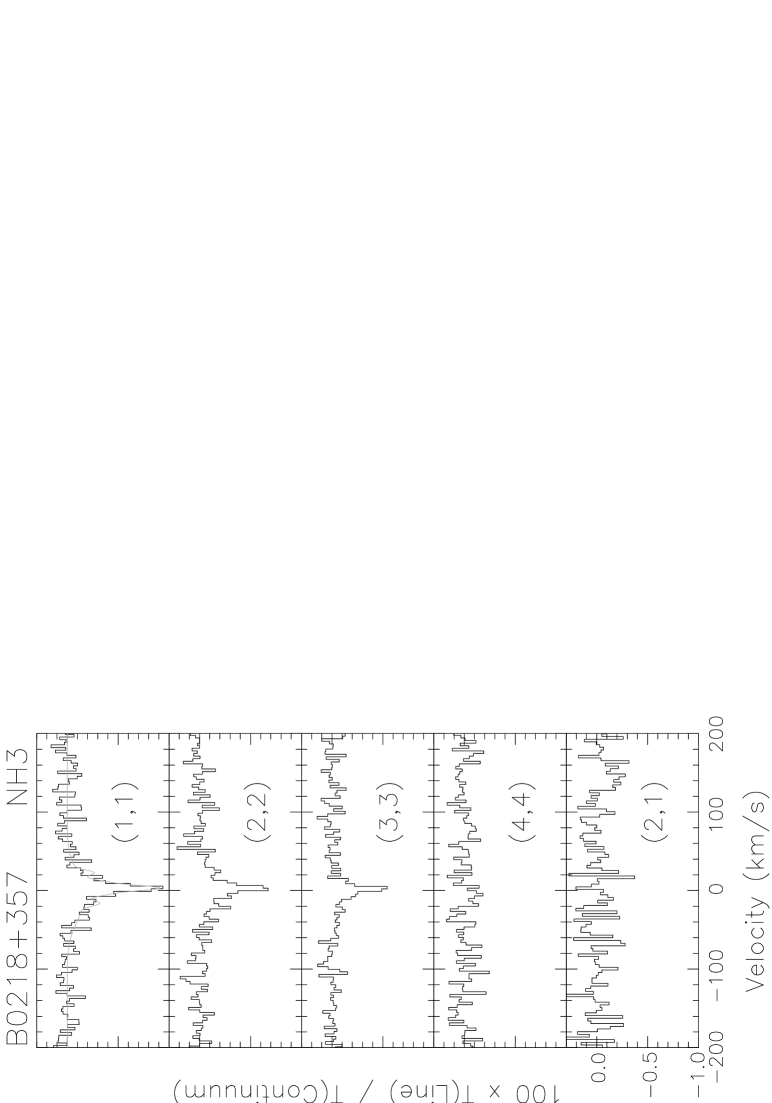
Fig. 1 shows the measured NH3 profiles. The detected inversion lines, with the ordinate displaying absorption in units of 1% of the continuum flux, are characterized by a prominent narrow component with a width of a few km s-1, centered at slightly positive velocities, and a wider and weaker component that is centered at slightly negative velocities with respect to a redshift of =0.68466. Tables 2 and 3 display noise levels for all measured spectra and line parameters for the detected transitions. The weak but wide velocity component has a 2–3 times higher integrated intensity than the more prominent narrow one. At its peak, the narrow component reaches 0.5–1.0% of the total continuum flux density, while the broad component peaks at 0.3% in the (1,1) and (2,2) lines and at an even lower level in the (3,3) transition. The narrow component must be optically thin; otherwise the hyperfine satellites would be visible (for the (1,1) line at 8 and 19 km s-1 with respect to the main feature). Due to a lower signal-to-noise ratio, the optical depth of the wide component is poorly constrained (see also Sect. 4.1).
At =1.9 and 1.3 cm, continuum flux densities were 1.0–1.2 Jy, in good agreement with Patnaik et al. patnaik93 (1993) and Menten & Reid (menten96 (1996)). At 6 GHz we find 1.45 Jy with an error of 10%, while no flux density was determined at 7 mm.
Fig. 2 shows a Boltzmann plot (rotation diagram) including the four measured ‘metastable’ (=) inversion lines of ammonia. Applying
( in cm-2, in K, in GHz; see e.g. Hüttemeister et al. 1995) and assuming optically thin absorption (see Sect. 4.1) and equal excitation temperatures () across the measured inversion doublets, rotation temperatures are of order 35–40 K. Although the (1,1) and (2,2) lines belong to the para- and the (3,3) line to the ortho-species (the conversion from one to the other species takes very long; see Cheung et al. 1969), no difference in excitation is apparent. The upper limits to the (4,4) line are consistent with the rotation temperature derived from the lower inversion transitions.
| Molecule | Line | rms | Channel | |
|---|---|---|---|---|
| width | ||||
| (GHz) | (10-3) | (km s-1) | ||
| C3N | =1–0, =3/2–1/2 | 5.868 | 3.0 | 2.29 |
| NH3 | ()=(2,1) | 13.711 | 2.1 | 1.71 |
| CH3OH | =9 A+ | 13.724 | 1.8 | 1.71 |
| SiC2 | =1 | 14.009 | 2.0 | 1.65 |
| NH3 | (=(1,1) | 14.065 | 1.0 | 1.65 |
| NH3 | (=(2,2) | 14.082 | 1.1 | 1.65 |
| NH3 | (=(3,3) | 14.169 | 0.7 | 3.30 |
| HC5N | =9–8 | 14.225 | 1.3 | 3.30 |
| NH3 | (=(4,4) | 14.329 | 1.4 | 1.65 |
| OCS | =2–1 | 14.440 | 1.9 | 1.65 |
| SO | =1 | 17.809 | 2.6 | 1.32 |
| HC3N | =4–3 | 21.602 | 8.2 | 1.08 |
| SiO | =1–0, =0 | 25.776 | 20.2 | 0.91 |
| DCN | =1–0 | 42.985 | 16.7 | 2.18 |
| H2CO | =1 | 43.236 | 222.7 | 2.17 |
| Line | ||||
|---|---|---|---|---|
| (km s-1) | ||||
| NH3 (1,1) | –0.062 (0.013) | +3.3 (0.5) | 9.3 | (1.8) |
| –0.183 (0.019) | –2.0 (2.7) | 56.6 | (7.8) | |
| NH3 (2,2) | –0.037 (0.009) | +3.1 (0.5) | 6.6 | (1.6) |
| –0.143 (0.017) | –1.7 (3.0) | 54.7 | (7.6) | |
| NH3 (3,3) | –0.034 (0.011) | +2.4 (0.5) | 7.3 | (2.3) |
| –0.070 (0.013) | –5.8 (5.8) | 46.2 | (14.1) | |
a) From Gaussian fits adopting =0.68466 and assuming that the continuum source covering factor is =1. Standard deviations are given in parenthesis.

4 Molecular cloud properties
4.1 Location and linewidth
Prior to this study, Menten & Reid (menten96 (1996)) had searched for NH3 absorption towards B0218+357. Their upper limits are higher than the strength of the absorption features shown in Fig. 1. It is tempting to identify the two main features of the NH3 lines as absorption against the two dominant continuum sources A and B. However, this is extremely unlikely for several reasons. VLBI observations of Hi at dm- and of H2CO at cm-wavelengths have shown that the absorption is confined to image A (Carilli et al. carilli00 (2000); Menten & Reid menten96 (1996)). While at radio wavelengths image A is three times as bright as B, image B is brighter at optical wavelengths. This indicates that image A is obscured by dust. Heavy absorption of A is further supported by a large differential rotation measure between A and B (Patnaik et al. patnaik93 (1993)) and by the different separations between images A and B at radio and optical wavelengths (3341 versus 3172 mas, respectively; York et al. york05 (2005)). Apparently, radio and optical images of A do not coincide. We further note that images A and B are on opposite sides of the lensing galaxy. Assuming a rotation velocity of order 150 km s-1, a difference in radial velocity of 5 km s-1 between images A and B would then require an inclination 1∘ for the lensing galaxy. While the galaxy is clearly face-on (York et al. york05 (2005)), the optical image does not require an inclination that close to zero.
We conclude that the two velocity components are associated with image A that shows a core-jet morphology (Patnaik et al. patnaik95 (1995); Porcas & Patnaik porcas95 (1995); Biggs et al. biggs03 (2003)). While the stronger narrower velocity component has a linewidth that is well within the range observed in galactic giant molecular clouds (e.g. Combes combes91 (1991)), the linewidth of the broad component is much larger. Could this be a consequence of hyperfine splitting of the ammonia lines? Or a consequence of differential galactic rotation?
The NH3 hyperfine satellites (for a ()=(1,1) spectrum, see e.g. Ho & Townes ho83 (1983)) are symmetrically bracketing the main feature and are covering 40 km s-1. Thus the partially blended satellite features from both velocity components can explain the observed linewidths of 50 km s-1. For a clear separation of individual satellite lines and velocity components, data with higher signal-to-noise ratios would be required.
The jet extends from the core of A over 6 mas toward the center of the lensing foreground galaxy, located at an angular distance of almost 300 mas (Patnaik et al. patnaik95 (1995); Porcas & Patnaik porcas95 (1995); Biggs et al. biggs03 (2003); Wucknitz et al. wucknitz04 (2004)). Position angles are 68∘ for the jet (Biggs et al. biggs03 (2003)) and 65∘2∘ for the center (Wucknitz et al. wucknitz04 (2004)). Therefore no significant velocity gradient is expected from the foreground galaxy. Its low inclination further reduces any such gradient. A wide component with an FWHP linewidth of order 50 km s-1 is not seen in other molecular lines at cm- and mm-wavelengths (e.g. Wiklind & Combes wiklind95 (1995); Menten & Reid menten96 (1996)). Thus hyperfine splitting is likely the main cause for the linewidths observed. Note, that there are indications for the same asymmetry, i.e. a stronger feature at slightly positive and a weaker feature at slightly negative velocities, in the CO =2–1 and 3–2, HCN 2–1 and HCO+ 2–1 lines (Wiklind & Combes combes95 (1995); Combes & Wiklind combes97 (1997), combes98 (1998)).
To summarize: While the relatively strong narrow absorption component at slightly positive velocities (see Fig. 1) must be optically thin, the optical depth of the wider and weaker component remains undetermined. Total linewidths are greatly affected by the spacing of the hyperfine features. Gaussian fits to the wide component (Table 3) include the hyperfine satellites of both velocity components.
4.2 Cloud size, optical depth and source covering factor
Molecular lines at mm-wavelengths can show deep absorption (Combes & Wiklind combes95 (1995); Wiklind & Combes wiklind95 (1995); Combes & Wiklind combes97 (1997)). Lines at dm- and cm-wavelengths are generally weaker with respect to the continuum. This even holds for =21 cm Hi and 18 cm OH, that show wider absorption than ammonia and the mm-wave lines (Carilli et al. carilli93 (1993); Kanekar et al. kanekar03 (2003)) and that may thus arise from a larger volume. The peak line to total continuum ratios of the 18 cm OH main lines are, however, similar to those seen in ammonia.
Since the continuum sources are compact and since the measured NH3 linewidths are small by extragalactic standards, the absorption arises from an area that must be considerably smaller than that studied in emission with single-dish telescopes towards nearby galaxies. According to Patnaik et al. (patnaik95 (1995)), 70% of the total 22 GHz flux is associated with image A. Thus minimum optical depths and source covering factors () of the ammonia lines toward image A are a factor of 1.4 higher than those suggested for the entire continuum flux by Fig. 1. They reach, in the (1,1) line, 0.014.
Sensitive maps of image A show a source of size 1010 mas2 that is edge-brightened on its south-western side and tangentially stretched (Biggs et al. biggs03 (2003)). At 15 GHz, the south-eastern region containing the core (components A1 and A2) and the north-western region containing the jet exhibit 621% and 385% of the observed flux density, respectively (Patnaik et al. patnaik95 (1995)). Although higher frequency VLBI measurements are missing, it would be no surprise if the contribution of the jet in image A is negligible at 100–150 GHz, thus leaving only the lensed core as the background continuum source. Assuming for the core component a brightness temperature and a flux density not drastically varying with frequency in the 10–150 GHz frequency range (see e.g. Blandford & Königl blandford79 (1979)), its solid angle would vary like (see also Lobanov lobanov98 (1998)). According to NED111This research made use of the NASA/IPAC Extragalactic Database (NED) which is operated by the Jet Propulsion Laboratory, CalTech, under contract with NASA. the mm-wave flux of B0218+357 is about half of that at cm-wavelengths, compatible with a fading jet and a flat spectrum core.
Adopting this scenario and assuming that the absorption arises exclusively from the core as it is indicated by some of the deep mm-wave absorption lines (CO should arise from a larger volume than NH3), we obtain for the peak of the ammonia (1,1) line a minimum optical depth and covering factor of 0.01/(0.70.62) = 0.023. At 150 GHz, this would yield for a cloud centered near the peaks of image A 0.15–1.0, depending on whether the exponent in the frequency dependence of the solid angle is –1 or –2.
High source covering factors at mm-wavelengths can be achieved, if the molecular absorber is elongated along the same position angle as the continuum, i.e. along a path with roughly constant galactocentric radius, hypothetically defining a spiral arm (see also Sect. 5). Elongated filaments are common in the Galaxy and are exemplified by the morphology of the Orion giant molecular cloud or the connection between this GMC and the Monoceros GMC (Maddalena & Thaddeus maddalena85 (1985)), reaching linear sizes in excess of 100 pc. This is more than the few 10 pc that are needed here. Observed values near unity then suggest that actual source covering factors ( and ) are 1–6 times higher than the lower limits estimated above, not providing an additional constraint for the NH3 source covering factor.
To verify these estimates and to further elucidate the morphology of image A and its foreground molecular cloud at high frequencies, mm-wave VLBI observations are highly desirable.
4.3 Densities and column densities
So far, the nature of the molecular cloud has been an enigma. It was proposed to be either a diffuse or a dark cloud (Combes & Wiklind combes95 (1995); Wiklind & Combes wiklind95 (1995); Menten & Reid menten96 (1996); Kanekar et al. kanekar03 (2003)). The determination of an NH3 rotation temperature, which is a lower limit to the kinetic temperature, allows us to discriminate between these two scenarios. Provided total gas densities are less than (H2)106 cm-3 and using the Large Velocity Gradient (LVG) model of Schilke (schilke89 (1989)) with collision rates from Danby et al. (danby88 (1988)), the kinetic temperature is 50–60 K. For even higher densities the kinetic temperature would be lower but would still be 35 K. Since frequencies of the ammonia lines are quite similar, the resulting temperatures are not significantly affected by potential differences in the morphology of the background continuum. We therefore conclude that the NH3 absorption does not arise from a cool dark cloud. Since the HCO+ absorption lines are not fully saturated (Wiklind & Combes wiklind95 (1995)) and many molecules have not been detected at levels of 1% of the total continuum flux density (Table 2), the diffuse cloud scenario is preferrable.
The high kinetic temperature of the gas implies that our non-detection of the DCN =1–0 line does not provide significant constraints to the cosmic D/H ratio. Adopting a width of the line of order 5 km s-1, we deduce a 5 sensitivity of 5% of the continuum level (Table 2). Assuming an optical depth of 5 for the opacity of the HCN =1–0 main line, this implies that we would have seen a DCN line only if [DCN]/[HCN]10-2. A ratio of 10-2 is, however, not reached at =20 K (Gerin et al. gerin99 (1999)) and [DCN]/[HCN] ratios at higher temperatures should be even smaller.
Having estimated the kinetic temperature, we can use measurements of molecular excitation to also obtain the density of the gas toward B0218+357. From the microwave background we obtain a minimum of = 2.73 (1+) = 4.6 K. Combes et al. (combesetal97 (1997)) find = 6 K from CS =1–0 and 3–2. The detection of the 557 GHz and the non-detection of the 183 GHz line of water vapor (these are rest frequencies) indicate 30 K (Combes & Wiklind combes97 (1997)). 13CO =2–1 and 4–3 spectra suggest 20 K (Gerin et al. gerin97 (1997)). With 35 K and (H2) 106 cm-3, LVG calculations for CS (for details, see e.g. Wang et al. wang04 (2004)) yield an excitation far above that observed. Thus 55 K. With this kinetic temperature and 9 K, (H2)2104 cm-3. This is a firm upper limit. If the excitation is close to 6 K or if the stronger CS line (=1–0) is optically thick, densities are smaller (7103 cm-3 in the former case), while constraints from H2O are less stringent. Again using LVG calculations, we find that a density of 5103 cm-2 is consistent with 13CO excitation temperatures 20 K, if optical depths are smaller than unity. Since Combes & Wiklind (combes95 (1995)) find that the 13CO =2–1 line is saturated, however, the density will be even lower. The upper density limits derived here are also consistent with the upper limit to the NH3 (2,1) line (Fig. 1 and Table 2), that would only be detectable in a cloud with much higher density (see Mauersberger et al. mauers85 (1985)).
Adopting =55 K and, less certain, (H2)=5103 cm-3 as best guesses, we can also estimate the excitation temperature within an NH3 inversion doublet: 6 K (Schilke 1989, his Fig. 6.15). This can be used to derive total NH3 column densities. Adding up column densities in the three detected lines gives (NH3) = 41013 cm-2. This is a minimum value. With equation A15 of Ungerechts et al. (ungerechts86 (1986)) and rotation temperatures of =35–40 K, we obtain 51013 cm-2. The error lies mainly in the assumed density of the gas. (H2)=104 cm-3 implies an excitation temperature of 8 K and a column density of 5 and 71013 cm-2, respectively. So far all given column densities are averaged over the entire continuum source. Averaged over the core of image A, column densities have to be multiplied by a factor of 2.3.
Typical galactic clouds have fractional abundances of (NH3) = 10-8–10-7 (e.g. Hotzel et al. hotzel04 (2004)). Averaged over the entire continuum source, this yields (H2) 41020 – 71021 cm-2 or 11021 – 21022 cm-2 for the core of image A. The lower limit is too small to allow us to detect a variety of molecular lines. Therefore the fractional abundance is likely close to 10-8. Our column density range is slightly lower than what has been proposed by Menten & Reid (menten96 (1996)) on the basis of another molecular cm-wave transition. Adopting 55 K also for the Hi spin temperature, the total background continuum averaged Hi column density becomes 21020 cm-2 (see Carilli et al. carilli93 (1993)). Accounting for an image A core source covering factor, the column density becomes 51020 cm-2. Thus the line of sight must be mostly molecular.
Column densities averaged over the extent of the continuum source are lower at cm-wavelengths (see Menten & Reid menten96 (1996)) then those derived by the higher frequency studies of Gerin et al. (gerin97 (1997)), 21022 cm-2, and Combes & Wiklind (combes95 (1995)), 51023 cm-2. This is expected for a molecular cloud located near the peak of image A and covering most of the mm-wave but only a fraction of the cm-wave continuum of B0218+357. In spite of this effect the value proposed by Combes & Wiklind (combes95 (1995)), (H2)51023 cm-2, must be too large. With such an enormous column density many of the species listed in Table 2 would have been detected. The 18O/17O ratio of 15 suggested by Combes & Wiklind (combes95 (1995)), that is in part responsible for the high column density, is far outside the range observed so far in interstellar clouds. With 18O/17O1.6 in the LMC (Heikkilä et al. heikkilae98 (1998)), 4.1 in the local interstellar medium (Wouterloot et al. wouterloot05 (2005)), 5.5 in the solar system (e.g. Wilson & Rood wilson94 (1994)), and 6.5 in nearby starburst galaxies (Harrison et al. harrison99 (1999); Wang et al. wang04 (2004)), new measurements of rare CO isotopomers would thus be desirable.
5 A comparison with ‘local’ molecular clouds
To put our data into context with the much more extensively studied interstellar medium of the local universe is not easy. The kinetic temperature we derive, 55 K, is much higher than the canonical number of 10 K assumed for quiescent Giant Molecular Cloud gas in the Galaxy. Clouds forming massive stars are warmer and may reach 55 K, but densities tend to be larger than those estimated in Sect. 4.3 for B0218+357.
The central region of the irregular starburst galaxy M 82 may provide the best agreement with the molecular parameters of B0218+357. In M 82, NH3 observations indicate 30 K and 50 K (Weiß et al. weiss01 (2001)), while observations of CO reveal densities of several 103 cm-3 (e.g. Mao et al. mao00 (2000)). The interstellar medium of M 82 is characerized by widespread PDRs (photon dominated regions/photodissociation regions), where ammonia, being readily destroyed by UV photons, mostly resides in the few remaining well shielded relatively cool cloud cores. Fractional ammonia abundances are of order 510-10 and thus much lower than in B0218+357. In the inner few 100 pc of nearby spiral galaxies, detected in NH3, temperatures are significantly higher than in B0218+357 (35 K; 55 K; Mauersberger et al. mauers03 (2003)). This also holds for clouds within a few 100 pc of the center of our Galaxy (Güsten et al. guesten85 (1985); Mauersberger et al. mauers86 (1986); Hüttemeister et al. huette93 (1993)).
In the Galaxy, few measurements of NH3 absorption from diffuse clouds against radio continuum sources have been reported and neither this molecule’s abundance (if detected) nor its rotation temperature are known in such environments (Nash nash90 (1990)). It would thus be easiest to reconcile our NH3 results with a known scenario if we assumed that the B0218+357 absorption line of sight crossed the central region of the lensing galaxy. This, however, is not the case. Wucknitz et al. (2004) model the B0218+357 system using the LENSCLEAN algorithm and find the lens to be centered at a position which is (, ) = (255, 120) mas offset from the A image and (–55,–10) mas from the B image, with uncertainties of order 5 mas in each coordinate. The best fit size of the lens is 258121 mas with a position angle of PA=–48∘ east of north (Wucknitz et al. wucknitz04 (2004), Table 4). This implies that image A is at a projected distance of 2.0 kpc (P.A.=–115∘) from the center of the lensing mass distribution, while image B is offset by only 0.4 kpc (PA=+70∘). Since the starburst in M 82 is, as most starbursts, confined to the nuclear few 100 pc and since its fractional NH3 abundance is much smaller than that in B0218+357, we do not find, neither in the Galaxy nor in the nearby extragalactic universe, any analog to the line-of-sight toward image A in B0218+357.
6 Conclusions
The gravitational lens system B0218+357 allows us to study the details of a molecular cloud observed at about half a Hubble time in the past. Our analysis of the Effelsberg data reveals the following:
-
•
Ammonia (NH3) is detected in absorption in its three lowest metatstable inversion doublets, while the ()=(4,4) and the non-metastable (2,1) lines remain undetected. Upper limits are also determined for transitions of SO, DCN, OCS, SiO, C3N, H2CO, SiC2, HC3N, HC5N, and CH3OH.
-
•
NH3 is likely absorbing exclusively the core of image A. Source covering factors and peak optical depths are 0.023 toward this core.
-
•
The NH3 rotation temperature of 35 K indicates a kinetic temperature of 55 K for the molecular gas.
-
•
With the kinetic temperature obtained from NH3, the measured excitation of other molecular species can be used to constrain the density. (H2) 5103 is found to be a plausible value. Averaged over the entire continuum source, the NH3 column density is (NH3) 51013 cm-2; averaged over the core of image A, it is 11014 cm-2 with a fractional abundance of order 10-8 . The gas along the line of sight is predominantly molecular.
-
•
The physical parameters are quite peculiar, when compared with those of clouds in the local universe.
-
•
Because the morphology of the radio continuum depends on frequency, cm-wave and mm-wave absorption features are characterized by different H2 column densities.
Acknowledgements.
We wish to thank R. Porcas, C. Böttner, M. Kadler and T. Krichbaum for useful discussions and an anonymous referee for critically reading the text and making a number of important suggestions.References
- (1) Biggs, A. D., Browne, I. W. A., Helbig, P., et al. 1999, MNRAS, 304, 349
- (2) Biggs, A. D., Browne, I. W. A., Muxlow, T. W. B., & Wilkinson, P. N. 2001a, MNRAS, 322, 821
- (3) Biggs, A. D., Browne, I. W. A., & Wilkinson, P. N. 2001b, MNRAS, 323, 995
- (4) Biggs, A. D., Wucknitz, O., Porcas, R. W. et al. 2003, MNRAS, 338, 599
- (5) Blandford, R. D., Königl, A. 1979, ApJ, 232, 34
- (6) Browne, I. W. A., Patnaik, A. R., Walsh, D., & Wilkinson, P.N. 1993, MNRAS, 263, L32
- (7) Carilli, C. L., Rupen, M. P., & Yanni, B. 1993, ApJ, 412, L59
- (8) Carilli, C. L., Menten, K. M., Stocke, J. T., et al. 2000, Phys. Rev. Let., 85, 5511
- (9) Cheung, A. C., Rank, D. M., Townes, C. H., Knowles, S. H., & Sullivan, W. T. 1969, ApJ, 157, L13
- (10) Cohen, A. S., Hewitt, J. N., Moore, C. B., & Haarsma, D. B. 2000, ApJ, 545, 578
- (11) Cohen, J. G., Lawrence, C. R., & Blandford, R. D. 2003, ApJ 583, 67
- (12) Combes, F. 1991, ARA&A, 29, 195
- (13) Combes, F., & Wiklind, T. 1995, A&A, 303, L61
- (14) Combes, F., & Wiklind, T. 1997, ApJ, 486, L79
- (15) Combes, F., Wiklind, T., & Nakai, N. 1997, A&A 327, L17
- (16) Combes, F., & Wiklind, T. 1998, A&A, 334, L81
- (17) Corbett, E. A., Browne, I. W. A., Wilkinson, P. N., & Patnaik, A. R. 1996, in Astrophysical Applications of Gravitational Lensing, IAU Symp. 173, eds. C.S. Kochanek & J.N. Hewitt, Kluwer Academic Publishers, Dordrecht, p37
- (18) Danby, G., Flower, D. R., Valiron, P., Schilke, P., Walmsley, C.M. 1988, MNRAS, 235, 229
- (19) Gerin, M., Phillips, T. G., Benford, D. J., et al. 1997, ApJ, 488, L31
- (20) Gerin, M., & Roueff, E. 1999, in Highly Redshifted Radio Lines, ASP Conf. Ser. 156, eds. C. Carilli et al., San Francisco, p196
- (21) Güsten, R., Walmsley, C. M., Ungerechts, H., & Churchwell, E. 1985, A&A, 142, 381
- (22) Harrison, A., Henkel, C., & Russel, A. 1999, MNRAS, 303, 157
- (23) Heikkilä, A., Johansson, L.E.B., & Olofsson, H. 1998, A&A, 332, 493
- (24) Henkel, C., Mauersberger, R., Peck, A. B., Falcke, H., & Hagiwara, Y. 2000, A&A, 361, L45
- (25) Ho, P. T. P., & Townes, C. H. 1983, ARA&A, 21, 239
- (26) Hotzel, S., Harju, J., & Walmsley, C. M. 2004, A&A, 415, 1065
- (27) Hüttemeister, S., Wilson, T. L., Henkel, C., Mauersberger, R. 1993, A&A, 276, 445
- (28) Hüttemeister, S., Wilson, T. L., Mauersberger, R., et al. 1995, A&A, 294, 667
- (29) Kanekar, N., Chengalur, J. N., de Bruyn, A. G., & Narasimha, D. 2003, MNRAS, 345, L7
- (30) Kanekar, N., & Chengalur, J. N. 2004, MNRAS, 350, L17
- (31) Kemball, A. J., Patnaik, A. R., & Porcas, R. W. 2001, ApJ, 562, 649
- (32) Kukolich, S. G. 1967, Phys. Rev., 156, 83
- (33) Lobanov, A. P. 1998, A&A, 330, 79
- (34) Maddalena, R. J., & Thaddeus, P. 1985, ApJ, 294, 231
- (35) Martin, R. N., & Ho, P. T. P. 1986, ApJ, 308, L7
- (36) Mao, R. Q., Henkel, C., Schulz, A., et al. 2000, A&A, 358, 433
- (37) Mauersberger, R., Wilson, T. L., Walmsley, C. M., Henkel, C. & Batrla, W. 1985, A&A, 146, 168
- (38) Mauersberger, R., Henkel, C., Wilson, T. L., Walmsley, C. M. 1986, A&A, 162, 199
- (39) Mauersberger, R., Henkel, C., Walmsley, C. M., Sage, L.J., & Wiklind, T. 1991, A&A, 247, 307
- (40) Mauersberger, R., Henkel, C., Weiß, A., Peck, A. B., & Hagiwara, Y. 2003, A&A, 403, 561
- (41) Menten, K. M., & Reid, M. J. 1996, ApJ, 465, L99
- (42) Murphy, M. T., Webb, J. K., Flambaum, V. V. et al. 2001, MNRAS 327, 1244
- (43) Nash, A. G. 1990, ApJS 72, 303
- (44) O’Dea, C. P., Baum, S. A., Stanghellini, C., et al. 1992, AJ, 104, 1320
- (45) Ott, M., Witzel, A., Quirrenbach, A., et al. 1994, A&A, 284, 331
- (46) Patnaik, A. R., Browne, I. W. A., King, L. J., et al. 1993, MNRAS, 261, 435
- (47) Patnaik, A. R., Porcas, R. W., & Browne, I. W. A. 1995, MNRAS, 274, L5
- (48) Porcas, R. W., & Patnaik, A. R. 1995, in Astrophysical Applications of Gravitational Lensing, IAU Symp. 173, eds. C.S. Kochanek & J.N. Hewitt, Kluwer Academic Publishers, Dordrecht, p311
- (49) Schilke, P. 1989, Diploma Thesis, Univ. of Bonn
- (50) Spergel, D. N., Verde, L., Peiris, H. et al. 2003, ApJS 148, 175
- (51) Stickel, M., & Kühr, H. 1993, A&AS, 101, 521
- (52) Takano, S., Nakai, N., Kawaguchi, K., & Takano, T. 2000, PASJ, 52, L67
- (53) Takano, S., Nakai, N., & Kawaguchi, K. 2002, PASJ, 54, 195
- (54) Ungerechts, H., Winnewisser, G., & Walmsley, C.M. 1986, A&A 157, 207
- (55) Wang, M., Henkel, C., Chin, Y.-N., et al. 2004, A&A, 422, 883
- (56) Weiß, A., Neininger, N., Henkel, C., Stutzki, J., & Klein, U. 2001, ApJ, 554, L143
- (57) Wiklind, T., & Combes, F. 1995, A&A, 299, 382
- (58) Wilson, T. L., & Rood, R. 1994, ARA&A, 32, 191
- (59) Wouterloot, J. G. A., Brand, J., & Henkel, C. 2005, A&A, 430, 549
- (60) Wucknitz, O., Biggs, A. D., & Browne, I. W. A. 2004, MNRAS, 349, 14
- (61) York, T., Jackson, N., Browne, I. W. A., Wucknitz, O., & Skelton, J. E. 2005, MNRAS, 357, 124