The many lives of AGN: cooling flows, black holes and the luminosities and colours of galaxies
Abstract
We simulate the growth of galaxies and their central supermassive black holes by implementing a suite of semi-analytic models on the output of the Millennium Run, a very large simulation of the concordance CDM cosmogony. Our procedures follow the detailed assembly history of each object and are able to track the evolution of all galaxies more massive than the Small Magellanic Cloud throughout a volume comparable to that of large modern redshift surveys. In this first paper we supplement previous treatments of the growth and activity of central black holes with a new model for ‘radio’ feedback from those AGN that lie at the centre of a quasistatic X-ray emitting atmosphere in a galaxy group or cluster. We show that for energetically and observationally plausible parameters such a model can simultaneously explain: (i) the low observed mass drop-out rate in cooling flows; (ii) the exponential cut-off at the bright end of the galaxy luminosity function; and (iii) the fact that the most massive galaxies tend to be bulge-dominated systems in clusters and to contain systematically older stars than lower mass galaxies. This success occurs because static hot atmospheres form only in the most massive structures, and radio feedback (in contrast, for example, to supernova or starburst feedback) can suppress further cooling and star formation without itself requiring star formation. We discuss possible physical models which might explain the accretion rate scalings required for our phenomenological ‘radio mode’ model to be successful.
keywords:
cosmology: theory, galaxies: formation, galaxies: evolution, galaxies: active, galaxies: cooling flows, black hole physics1 Introduction
The remarkable agreement between recent measurements of cosmic structure over a wide range of length- and time-scales has established a standard paradigm for structure formation, the CDM cosmogony. This model can simultaneously match the microwave background fluctuations seen at (e.g. Spergel et al., 2003), the power spectrum of the low redshift galaxy distribution (e.g. Percival et al., 2002; Tegmark et al., 2004), the nonlinear mass distribution at low redshift as characterised by cosmic shear (e.g. Van Waerbeke et al., 2002) and the structure seen in the Ly forest (e.g. Mandelbaum et al., 2003). It also reproduces the present acceleration of the cosmic expansion inferred from supernova observations (Perlmutter et al., 1999; Riess et al., 1998), and it is consistent with the mass budget inferred for the present universe from the dynamics of large-scale structure (Peacock et al., 2001), the baryon fraction in rich clusters (White et al., 1993) and the theory of Big Bang nucleosynthesis (Olive et al., 2000). A working model for the growth of all structure thus appears well established.
In this cosmogony, galaxies form when gas condenses at the centres of a hierarchically merging population of dark haloes, as originally proposed by White & Rees (1978). Attempts to understand this process in detail have consistently run into problems stemming from a mismatch in shape between the predicted distribution of dark halo masses and the observed distribution of galaxy luminosities. Most stars are in galaxies of Milky Way brightness; the galaxy abundance declines exponentially at brighter luminosities and increases sufficiently slowly at fainter luminosities that relatively few stars are in dwarfs. In contrast, the theory predicts a much broader halo mass distribution – a constant mass-to-light ratio would produce more high and low luminosity galaxies than are observed while underpredicting the number of galaxies like the Milky Way. Attempts to solve these problems initially invoked cooling inefficiencies to reduce gas condensation in massive systems, and supernova feedback to reduce star formation efficiency in low mass systems (White & Rees, 1978; White & Frenk, 1991). Formation of dwarfs may also be suppressed by photoionisation heating (Efstathiou, 1992). As Thoul & Weinberg (1995) emphasised, cooling effects alone are too weak to produce the bright end cut-off of the luminosity function, and recent attempts to fit observed luminosity functions have been forced to include additional feedback processes in massive systems (e.g. Benson et al., 2003). In this paper we argue that radio sources may provide the required feedback while at the same time providing a solution to two other long-standing puzzles.
An important unanswered question is why the gas at the centre of most galaxy clusters is apparently not condensing and turning into stars when the observed X-ray emission implies a cooling time which is much shorter than the age of the system. This cooling flow puzzle was noted as soon as the first X-ray maps of clusters became available (Cowie & Binney, 1977; Fabian & Nulsen, 1977) and it was made more acute when X-ray spectroscopy demonstrated that very little gas is cooling through temperatures even a factor of three below that of the bulk of the gas (Peterson et al., 2001; Tamura et al., 2001). A clue to the solution may come from the observation (Burns et al., 1981) that every cluster with a strong cooling flow also contains a massive and active central radio galaxy. Tabor & Binney (1993) suggested that radio galaxies might regulate cooling flows, and this idea has gained considerable recent support from X-ray maps which show direct evidence for an interaction between radio lobes and the intracluster gas (Fabian et al., 2003; McNamara et al., 2000, 2005). A number of authors have suggested ways in which the radio source might replace the thermal energy lost to X-ray emission (Binney & Tabor, 1995; Churazov et al., 2002; Brüggen & Kaiser, 2002; Ruszkowski & Begelman, 2002; Kaiser & Binney, 2003; Omma et al., 2004). We do not focus on this aspect of the problem here, but rather demonstrate that if the scaling properties of radio source feedback are set so they can plausibly solve the cooling flow problem they induce a cut-off at the bright end of the galaxy luminosity function which agrees well with observation.
Another puzzling aspect of the galaxy population is the fact that the most massive galaxies, typically ellipticals in clusters, are made of the oldest stars and so finished their star formation earlier than lower mass galaxies (Bender & Saglia, 1999). Confirming evidence for this comes from look-back studies which show that both star-formation and AGN activity take place more vigorously and in higher mass objects at redshifts of 1 to 2 than in the present Universe (e.g. Shaver et al., 1996; Madau et al., 1996). Cowie et al. (1996) termed this phenomenon ‘down-sizing’, and prima facie it conflicts with hierarchical growth of structure in a CDM cosmogony where massive dark haloes assemble at lower redshift than lower mass haloes (e.g. Lacey & Cole, 1993). This puzzle is related to the previous two; the late-forming high mass haloes in CDM correspond to groups and clusters of galaxies, and simple theories predict that at late times their central galaxies should grow to masses larger than those observed through accretion from cooling flows. In the model we present below, radio galaxies prevent significant accretion, thus limiting the mass of the central galaxies and preventing them from forming stars at late times when their mass and morphology can still change through mergers. The result is a galaxy luminosity function with a sharper high-mass cut-off in which the most massive systems are red, dead and elliptical.
To make quantitative predictions for the galaxy population in a CDM universe it is necessary to carry out simulations. Present numerical capabilities allow reliable simulation of the coupled nonlinear evolution of dark matter and diffuse gas, at least on the scales which determine the global properties of galaxies. Once gas cools and condenses into halo cores, however, both its structure and the rates at which it turns into stars and feeds black holes are determined by small-scale ‘interstellar medium’ processes which are not resolved. These are usually treated through semi-analytic recipes, parameterised formulae which encapsulate ‘subgrid’ physics in terms of star formation thresholds, Schmidt ‘laws’ for star formation, Bondi models for black hole feeding, etc. The form and the parameters of these recipes are chosen to reproduce the observed systematics of star formation and AGN activity in galaxies (e.g. Kennicutt, 1998). With a well-constructed scheme it is possible to produce stable and numerically converged simulations which mimic real star-forming galaxies remarkably well (Springel & Hernquist, 2003a). In strongly star-forming galaxies, massive stars and supernovae produce winds which redistribute energy, mass and heavy elements over large regions (Heckman et al., 1990; Martin, 1999). Even stronger feedback is possible, in principle, from AGN (Begelman et al., 1991). In both cases the determining processes occur on very small scales and so have to be included in simulations through parametrised semi-analytic models. Unfortunately, the properties of simulated galaxies turn out to depend strongly on how these unresolved star-formation and feedback processes are treated.
Since the diffuse gas distribution and its cooling onto galaxies are strongly affected by the description adopted for the subgrid physics, every modification of a semi-analytic model (or of its parameters) requires a simulation to be repeated. This makes parameter studies or tests of, say, the effects of different AGN feedback models into a very expensive computing exercise. A cost-effective alternative is to represent the behaviour of the diffuse gas also by a semi-analytic recipe. Since the dark matter couples to the baryons only through gravity, its distribution on scales of galaxy haloes and above is only weakly affected by the details of galaxy formation. Its evolution can therefore be simulated once, and the evolution of the baryonic component can be included in post-processing by applying semi-analytic models to the stored histories of all dark matter objects. Since the second step is computationally cheap, available resources can be used to carry out the best possible dark matter simulation, and then many parameter studies or tests of alternative models can be carried out in post-processing. This simulation approach was first introduced by Kauffmann et al. (1999) and it is the approach we apply here to the Millennium Run, the largest calculation to date of the evolution of structure in the concordance CDM cosmogony (Springel et al., 2005b).
This paper is organised as follows. In Section 2 we describe the Millennium Run and the post-processing we carried out to construct merging history trees for all the dark haloes within it. Section 3 presents the model for the formation and evolution of galaxies and their central supermassive black holes that we implement on these merging trees. Section 4 describes the main results of our modelling, concentrating on the influence of ‘radio mode’ feedback on the properties of the massive galaxy population. In Section 5 we discuss physical models for black hole accretion which may explain the phenomenology required for our model to be successful. Finally, Section 6 summarises our conclusions and suggests some possible directions for future investigation.
2 The dark matter skeleton: the Millennium Run
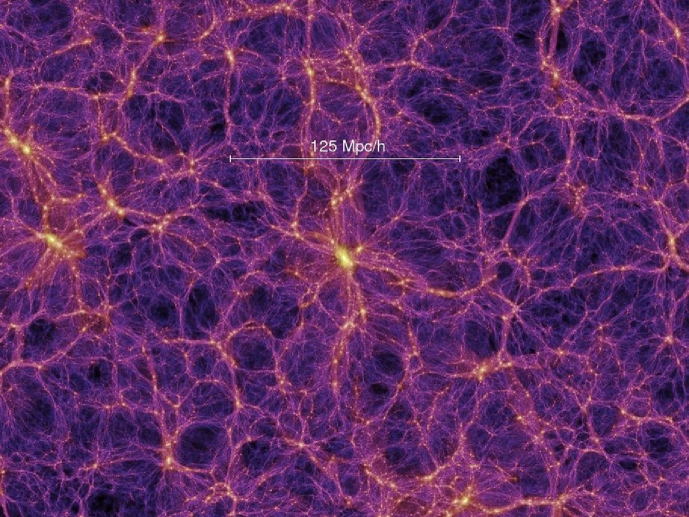
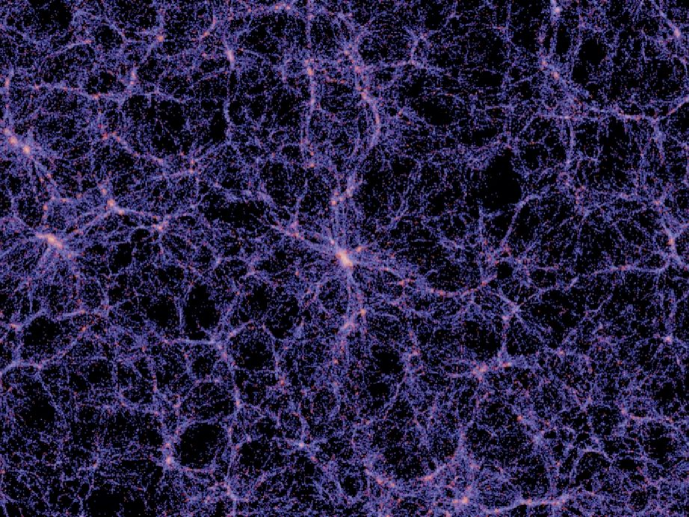
Our model for the formation and evolution of galaxies and their central supermassive black holes is implemented on top of the Millennium Run, a very large dark matter simulation of the concordance CDM cosmology with particles in a periodic box of Mpc on a side. A full description is given in Springel et al. (2005b); here we summarise the main simulation characteristics and the definition and construction of the dark matter merging history trees we use in our galaxy formation modelling. The dark matter distribution is illustrated in the top panel of Fig. 1 for a Mpc slice cut from the full volume. The projection is colour coded by density and local velocity dispersion, and illustrates the richness of dark matter structure for comparison with structure in the light distribution to which we will come later. Dark matter plots on a wider range of scales may be found in Springel et al. (2005b).
2.1 Simulation characteristics
We adopt cosmological parameter values consistent with a combined analysis of the 2dFGRS (Colless et al., 2001) and first-year WMAP data (Spergel et al., 2003; Seljak et al., 2005). They are , , , , , and . Here denotes the total matter density in units of the critical density for closure, . Similarly, and denote the densities of baryons and dark energy at the present day. The Hubble constant is given as , while is the rms linear mass fluctuation within a sphere of radius extrapolated to .
The chosen simulation volume is a periodic box of size , which implies a particle mass of . This volume is large enough to include interesting objects of low space density, such as quasars or rich galaxy clusters, the largest of which contain about 3 million simulation particles at . At the same time, the mass resolution is sufficient that haloes that host galaxies as faint as are typically resolved with at least particles. Note that although discreteness noise significantly affects the merger histories of such low mass objects, the galaxies that reside in halos with particles are usually sufficiently far down the luminosity function that any uncertainty in their properties has little impact on our results or conclusions.
The initial conditions at were created by displacing particles from a homogeneous, ‘glass-like’ distribution (White, 1996) using a Gaussian random field with a CDM linear power spectrum as given by the Boltzmann code CMBFAST (Seljak & Zaldarriaga, 1996). The simulation was then evolved to the present epoch using a leapfrog integration scheme with individual and adaptive time steps, with up to time steps for individual particles.
The simulation itself was carried out with a special version of the GADGET-2 code (Springel et al., 2001b; Springel, 2005) optimised for very low memory consumption so that it would fit into the nearly 1 TB of physically distributed memory available on the parallel IBM p690 computer111This computer is operated by the Computing Centre of the Max-Planck Society in Garching, Germany. used for the calculation. The computational algorithm used the ‘TreePM’ method (Xu, 1995; Bode et al., 2000; Bagla, 2002) to evaluate gravitational forces, combining a hierarchical multipole expansion, or ‘tree’ algorithm (Barnes & Hut, 1986), and a classical, Fourier transform particle-mesh method (Hockney & Eastwood, 1981). An explicit force-split in Fourier-space produces a very nearly isotropic force law with negligible force errors at the force matching scale. The short-range gravitational force law is softened on comoving scale (Plummer-equivalent) which may be taken as the spatial resolution limit of the calculation, thus achieving a dynamic range of in 3D. The calculation, performed in parallel on 512 processors, required slightly less than processor hours of CPU time, or 28 days of wall-clock time.
2.2 Haloes, substructure, and merger tree construction
Our primary application of the Millennium Run in this paper uses finely resolved hierarchical merging trees which encode the full formation history of tens of millions of haloes and the subhaloes that survive within them. These merging history trees are the backbone of the model that we implement in post-processing in order to simulate the wide range of baryonic processes that are important during the formation and evolution of galaxies and their central supermassive black holes.
We store the full particle data between and at 60 output times spaced in expansion factor according to the formula
| (1) |
This spacing is ‘locally’ logarithmic but becomes smoothly finer at lower redshift, with a temporal resolution by redshift zero of approximately Myr. Additional outputs are added at to produce a total of 64 snapshots in all. We note that each snapshot has a total size in excess of 300 GB, giving a raw data volume of nearly 20 TB.
Together with each particle coordinate dump, the simulation code directly produces a friends-of-friends (FOF) group catalogue on the fly and in parallel. FOF groups are defined as equivalence classes where any pair of two particles is placed into the same group if their mutual separation is less than 0.2 of the mean particle separation (Davis et al., 1985). This criterion combines particles into groups with a mean overdensity of about 200, corresponding approximately to that expected for a virialised group. The group catalogue saved to disk for each output only kept groups with at least 20 particles.
High-resolution simulations like the present one exhibit a rich substructure of gravitationally bound dark matter subhaloes orbiting within larger virialised halos (e.g. Ghigna et al., 1998). The FOF group-finder built into our simulation code identifies the haloes but not their subhalos. Since we wish to follow the fate of infalling galaxies and their halos, and these are typically identifiable for a substantial time as a dark matter subhalo within a FOF halo, we apply in post-processing an improved and extended version of the SUBFIND algorithm of Springel et al. (2001a). This computes an adaptively smoothed dark matter density field within each halo using a kernel-interpolation technique, and then exploits the topological connectivity of excursion sets above a density threshold to identify substructure candidates. Each substructure candidate is subjected to a gravitational unbinding procedure. If the remaining bound part has more than 20 particles, the subhalo is kept for further analysis and some of its basic physical properties are determined (angular momentum, maximum of its rotation curve, velocity dispersion, etc.). After all subhaloes are identified they are extracted from the FOF halo so that the remaining featureless ‘background’ halo can also be subjected to the unbinding procedure. This technique, however, neglects the fact that substructures embedded within a halo help to bind its material, and thus removing them can, in principal, unbind some of the FOF halo that may otherwise still be loosely bound. We accept this small effect for technical reasons related to the robustness of our halo definition procedures and the need for unambigous particle-subhalo assignments in our data structures. We note that the total mass in substructures is typically below 10% and often substantially smaller. Thus any bias in the bound mass of the parent halo due to additional unbinding is always very small.
To compute a virial mass estimate for each FOF halo we use the spherical-overdensity approach, where the centre is determined using the minimum of the gravitational potential within the group and we define the boundary at the radius which encloses a mean overdensity of 200 times the critical value. The virial mass, radius and circular velocity of a halo at redshift are then related by
| (2) |
where is the Hubble constant at redshift .
At our procedures identify FOF groups, down from a maximum of at when groups were more abundant but of lower mass on average. The groups contain a total of subhaloes, with the largest FOF group containing 2328 of them. (Note that with our definitions, all FOF groups contain at least one subhalo, the main subhalo which is left over after removal of any substructure and the unbound component. We require this main subhalo to contain at least 20 particles.)
Having found all haloes and subhaloes at all output snapshots, we then characterise structural evolution by building merging trees that describe in detail how haloes grow as the universe evolves. Because structures merge hierarchically in CDM universes there can be several progenitors for any given halo, but in general there is only one descendant. (Typically the cores of virialised dark matter structures do not split into two or more objects.) We therefore construct merger trees based on defining a unique descendant for each halo and subhalo. This is, in fact, sufficient to define the entire merger tree, since the progenitor information then follows implicitly. Further details can be found in Springel et al. (2005b).
We store the resulting merging histories tree by tree. Since each tree contains the full formation history of some halo, the physical model for galaxy formation can be computed sequentially tree by tree. It is thus unnecessary to load all the history information on the simulation into computer memory at the same time. Actually, this would be currently impossible, since the combined trees contain a total of around 800 million subhaloes for each of which a number of attributes are stored. Note that, although evolving the galaxy population sequentially in this way allows us to consider, in principle, all interactions between galaxies that end up in the same present-day FOF halo, it does not allow us to model longer range interactions which might take place between galaxies that end up in different FOF halos at .
3 Building galaxies: the semi-analytic model
| parameter | description | best value | plausible range |
|---|---|---|---|
| cosmic baryon fraction () | fixed | ||
| , | redshift of reionization () | , | fixed |
| merger cold gas BH accretion fraction () | |||
| quiescent hot gas BH accretion rate () () | |||
| star formation efficiency () | |||
| SN feedback disk reheating efficiency () | |||
| SN feedback halo ejection efficiency () | |||
| ejected gas reincorporation efficiency () | |||
| major merger mass ratio threshold () | |||
| instantaneous recycled fraction of SF to the cold disk () | |||
| yield of metals produced per unit SF () |
3.1 Overview
In the following sub-sections we describe the baryonic physics of one particular model for the formation and evolution of galaxies and of their central supermassive black holes. A major advantage of our simulation strategy is that the effects of parameter variations within this model (or indeed alternative assumptions for some of the processes) can be explored at relatively little computational expense since the model operates on the stored database of merger trees; the simulation itself and the earlier stages of post-processing do not need to be repeated. We have, in fact, explored a wide model and parameter space to identify our current best model. We summarise the main parameters of this model, their ‘best’ values, and their plausible ranges in Table 1. These choices produce a galaxy population which matches quite closely many observed quantities. In this paper we discuss the field galaxy luminosity-colour distribution; the mean stellar mass – stellar age relation; the Tully-Fisher relation, cold gas fractions and gas-phase metallicities of Sb/c spirals; the colour – magnitude relation of ellipticals; the bulge mass – black hole mass relation; and the volume-averaged cosmic star-formation and black hole accretion histories. In Springel et al. (2005b) we also presented results for galaxy correlations as a function of absolute magnitude and colour, for the baryonic ‘wiggles’ in the large-scale power spectrum of galaxies, and for the abundance, origin and fate of high redshift supermassive black holes which might correspond to the quasars discovered by the SDSS (Fan et al., 2001)
In our model we aim to motivate each aspect of the physics of galaxy formation using the best available observations and simulations. Our parameters have been chosen to reproduce local galaxy properties and are stable in the sense that none of our results is critically dependent on any single parameter choice; plausible changes in one parameter or recipe can usually be accommodated through adjustment of the remaining parameters within their own plausible range. The particular model we present is thus not unique. Importantly, our model for radio galaxy heating in cooling flows, which is the main focus of this paper, is only weakly influenced by the remaining galaxy formation and black hole growth physics. This is because our radio mode feedback is active only in massive objects and at late times and it has no effect during the principal growth phase of most galaxies and AGN.
The distribution of galaxy light in our ‘best’ model is shown in the bottom panel of Fig. 1 for comparison with the mass distribution in the top panel. For both the volume is a projected Mpc slice cut from the full Gpc3 simulation box. The plot of surface brightness is colour-coded by the luminosity-weighted mean colour of the galaxies. On large scales light clearly follows mass, but non-trivial biases become evident on smaller scales, especially in ‘void’ regions. The redder colour of galaxies in high density regions is also very clear.
3.2 Gas infall and cooling
We follow the standard paradigm set out by White & Frenk (1991) as adapted for implementation on high resolution N-body simulations by Springel et al. (2001a) and De Lucia et al. (2004). This assumes that as each dark matter halo collapses, its own ‘fair share’ of cosmic baryons collapse with it (but see Section 3.3 below). Thus in our model the mass fraction in baryons associated with every halo is taken to be , consistent with the first-year WMAP result (Spergel et al., 2003). Initially these baryons are in the form of diffuse gas with primordial composition, but later they include gas in several phases as well as stars and heavy elements. The fate of the infalling gas depends on redshift and on the depth of the halo potential (Silk, 1977; Rees & Ostriker, 1977; Binney, 1977; White & Rees, 1978). At late times and in massive systems the gas shocks to the virial temperature and is added to a quasi-static hot atmosphere that extends approximately to the virial radius of the dark halo. Gas from the central region of this atmosphere may accrete onto a central object through a cooling flow. At early times and in lower mass systems the infalling gas still shocks to the virial temperature but its post-shock cooling time is sufficiently short that a quasi-static atmosphere cannot form. Rather the shock occurs at much smaller radius and the shocked gas cools rapidly and settles onto a central object, which we assume to be a cold gas disk. This may in turn be subject to gravitational instability, leading to episodes of star formation.
More specifically, the cooling time of a gas is conventionally taken as the ratio of its specific thermal energy to the cooling rate per unit volume,
| (3) |
Here is the mean particle mass, is the Boltzmann constant, is the hot gas density, and is the cooling function. The latter depends both on the metallicity and the temperature of the gas. In our models we assume the post-shock temperature of the infalling gas to be the virial temperature of the halo, K. When needed, we assume that the hot gas within a static atmosphere has a simple ‘isothermal’ distribution,
| (4) |
where is the total hot gas mass associated with the halo and is assumed to extend to its virial radius .
To estimate an instantaneous cooling rate onto the central object of a halo, given its current hot gas content, we define the cooling radius, , as the radius at which the local cooling time (assuming the structure of Eq. 4) is equal to a suitably defined age for the halo. White & Frenk (1991) took this age to be the Hubble time , while Cole et al. (1994, 2000) used the time scale over which the main progenitor last doubled its mass. Somerville & Primack (1999) argued that the time interval since the last major merger is more appropriate since such mergers redistribute hot gas within the halo. Here we follow Springel et al. (2001a) and De Lucia et al. (2004) and define the cooling radius as the point where the local cooling time is equal to the halo dynamical time, . This is an order of magnitude smaller than and so results in substantially smaller cooling radii and cooling rates (typically by a factor of 3) than the assumption of White & Frenk (1991). Our choice is justified by the tests of Yoshida et al. (2002) who verified explicitly that it results in good object-by-object agreement between the amount of gas predicted to condense in galaxy mass haloes and the amount which actually condensed in their high-resolution SPH simulations of the formation of a galaxy cluster and its environment. These tests assumed primordial abundances in the cooling function. When we implement a chemical enrichment model consistent with the observed element abundances in intracluster gas (see Section 3.9) cooling rates in galaxy mass haloes are substantially enhanced and we find (as did De Lucia et al. 2004) that a smaller coefficient than used in the original White & Frenk cooling model is required to avoid excessive condensation of gas.
Using the above definition, a cooling rate can now be determined through a simple continuity equation,
| (5) |
Despite its simplicity, this equation is a good approximation to the rate at which gas is deposited at the centre in the Bertschinger (1989) similarity solution for a cooling flow. Putting it all together we take the cooling rate within a halo containing a hot gas atmosphere to be
| (6) |
We assume this equation to be valid when . This is the criterion which White & Frenk (1991) proposed to separate the static hot halo regime from the rapid cooling regime (see below).
In low mass haloes or at high redshifts the formal cooling radius lies outside the virial radius . The post-shock gas then cools in less than one sound crossing time and cannot maintain the pressure needed to support an accretion shock at large radius. The high-resolution spherical infall simulations of Forcada-Miró & White (1997) show that in this situation the accretion shock moves inwards, the post-shock temperature increases and the mass stored in the post-shock hot atmosphere decreases, because the post-shock gas rapidly cools onto the central object. In effect, all infalling material is accreted immediately onto the central disk. In this rapid cooling regime we therefore set the cooling rate onto the central object to be equal to the rate at which new diffuse gas is added to the halo.
3.2.1 Rapid cooling or cold accretion?
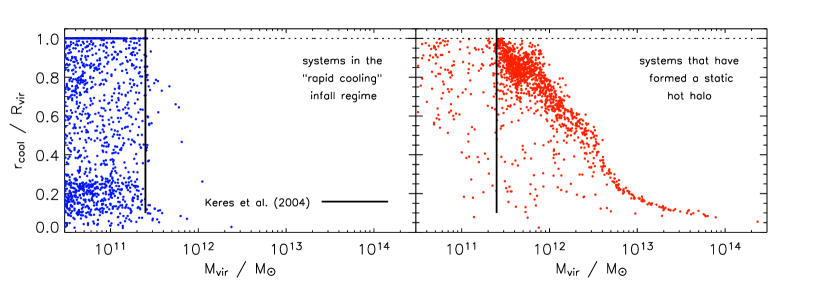
Although much simplified, the above model was shown by Yoshida et al. (2002) and Helly et al. (2003) to give reasonably accurate, object-by-object predictions for the cooling and accumulation of gas within the galaxies that formed in their -body+SPH simulations. These neglected star-formation and feedback effects in order to test the cooling model alone. They also assumed primordial abundances in the cooling function. In Fig. 2 we show the ratio as a function of virial mass for haloes in the ‘rapid cooling’ regime (left panel) and in the ‘static halo’ regime (right panel) at for our ‘best’ galaxy formation model. The two regimes are distinguished by the dominant gas component in each halo: when the mass of hot halo gas exceeds that of cold disk gas, we say the galaxy has formed a static halo, otherwise the system is taken to be in the rapid cooling phase. Many haloes classified as ‘rapidly cooling’ by this criterion have , which would apparently indicate a static hot halo. This is misleading, however, as systems where cooling is rapid deposit infalling gas onto the central galactic disk on a short timescale until they have a low-mass residual halo which satisfies . This then persists until the next infall event. Averaging over several cycles of this behaviour, one finds that the bulk of the infalling gas cools rapidly. This is why we choose to classify systems by their dominant gas component. Note also that a massive hot halo forms immediately once cooling becomes inefficient, just as in the 1-D infall simulations of Forcada-Miró & White (1997) and Birnboim & Dekel (2003). Our classification is thus quite robust.
The transition between the ‘rapid cooling’ and ‘static halo’ regimes is remarkably well defined. At it occurs at a halo virial mass of –, and is approximately independent of redshift out to at least . This is close to the transition mass found for the same cosmology by Birnboim & Dekel (2003) using spherically symmetric simulations, and by Keres et al. (2004) using fully 3-D simulations. This is, in fact, a coincidence since both sets of authors assume cooling functions with no metals, whereas our ‘best’ model includes heavy elements which substantially enhance cooling at the temperatures relevant for the transition. Enrichment in the ‘rapid cooling’ regime arises from the mixing of infalling primordial gas with supernova-enriched gas ejected in a galactic wind (see Section 3.6). If we modify our model to assume a zero-metal cooling function, we find the transition mass to shift downwards by about a factor of 2–3, resulting in a lower cooling rate in comparison to the work of Birnboim & Dekel (2003) and Keres et al. (2004).
The reason for the more efficient (we would argue overly efficient) cooling appears to be different in these two studies. The spherical infall simulations of Forcada-Miró & White (1997) showed good agreement with a transition at the point predicted using the original cooling radius definition of White & Frenk (1991) rather than our revised definition which was checked explicitly against SPH simulations by Yoshida et al. (2002). Spherical models thus predict more efficient cooling than occurs in typical 3-D situations. This explains, perhaps, why Birnboim & Dekel (2003) find a higher transition mass than we would predict for zero metallicity. Yoshida et al. (2002) also showed that the density estimation in the implementation of SPH used by Keres et al. (2004) leads to overcooling of gas in galaxy mass objects as compared to their own entropy and energy conserving SPH scheme; the effect is large enough to explain why Keres et al. (2004) find a higher transition mass than we find for their assumed cooling function.
Both Birnboim & Dekel and Keres et al. refer to the ‘rapid cooling’ regime as ‘cold infall’. This is, in fact, a misnomer. In this mode the accretion shock occurs closer to the central object, and so deeper in its potential well than when there is a static hot halo. As a result, the pre-shock velocity of infalling gas is greater, resulting in a larger post-shock temperature. The two modes do not differ greatly in the temperature to which infalling gas is shocked, but rather in how long (compared to the system crossing time) the gas spends at the post-shock temperature before its infall energy is lost to radiation. Finally, we note that the existence and importance of these two modes was the major insight of the original work of Silk (1977), Binney (1977) and Rees & Ostriker (1977) and has been built into all modern theories for galaxy formation. A detailed discussion can be found, for example, in White & Frenk (1991).
3.3 Reionization
Accretion and cooling in low mass haloes is required to be inefficient to explain why dwarf galaxies contain a relatively small fraction of all condensed baryons (White & Rees, 1978). This inefficiency may in part result from photoionisation heating of the intergalactic medium (IGM) which suppresses the concentration of baryons in shallow potentials (Efstathiou, 1992). More recent models identify the possible low-redshift signature of such heating in the faint end of the galaxy luminosity function, most notably in the abundance of the dwarf satellite galaxies in the local group (e.g. Tully et al., 2002; Benson et al., 2002).
Gnedin (2000) showed that the effect of photoionization heating on the gas content of a halo of mass can be modelled by defining a characteristic mass scale, the so called filtering mass, , below which the gas fraction is reduced relative to the universal value:
| (7) |
The filtering mass is a function of redshift and changes most significantly around the epoch of reionization. It was estimated by Gnedin using high-resolution - simulations (but see Hoeft et al., 2005). Kravtsov et al. (2004) provided an analytic model for these results which distinguishes three ‘phases’ in the evolution of the IGM: , the epoch before the first regions overlap; , the epoch when multiple regions overlap; , the epoch when the medium is almost fully reionized. They find that choosing and provides the best fit to the numerically determined filtering mass. We adopt these parameters and keep them fixed throughout our paper. This choice results in a filtering mass of at , and by the present day. See Appendix B of Kravtsov et al. (2004) for a full derivation and description of the analytic model.
3.4 Black hole growth, AGN outflows, and cooling suppression
There is a growing body of evidence that active galactic nuclei (AGN) are a critical piece in the galaxy formation puzzle. Our principal interest in this paper is their role in suppressing cooling flows, thereby modifying the luminosities, colours, stellar masses and clustering of the galaxies that populate the bright end of the galaxy luminosity function. To treat this problem, we first need a physical model for the growth of black holes within our galaxies.
3.4.1 The ‘quasar mode’
In our model (which is based closely on that of Kauffmann & Haehnelt 2000) supermassive black holes grow during galaxy mergers both by merging with each other and by accretion of cold disk gas. For simplicity, black hole coalescence is modelled as a direct sum of the progenitor masses and thus ignores gravitational wave losses (including such losses is found to have little effect on the properties of the final galaxy population). We assume that the gas mass accreted during a merger is proportional to the total cold gas mass present, but with an efficiency which is lower for smaller mass systems and for unequal mergers. Specifically,
| (8) |
where we have changed the original parameterisation by taking
| (9) |
Here is a constant and is chosen to reproduce the observed local relation (Magorrian et al., 1998; Marconi & Hunt, 2003; Häring & Rix, 2004). In contrast to Kauffmann & Haehnelt (2000) we allow black hole accretion during both major and minor mergers although the efficiency in the latter is lower because of the term. Thus, any merger-induced perturbation to the gas disk (which might come from a bar instability or a merger-induced starburst – see Section 3.7) can drive gas onto the central black hole. In this way, minor merger growth of the black hole parallels minor merger growth of the bulge. The fractional contribution of minor mergers to both is typically quite small, so that accretion driven by major mergers is the dominant mode of black hole growth in our model. We refer to this as the ‘quasar mode’. [Note that a more schematic treatment of black hole growth would suffice for the purposes of this paper, but in Springel et al. (2005b) and in future work we wish to examine the build-up of the black hole population within galaxies in considerably more detail.]
There is substantial evidence for strong hydrodynamic and radiative feedback from optical/UV and X-ray AGN (Arav et al., 2001; de Kool et al., 2001; Reeves et al., 2003; Crenshaw et al., 2003). We have not yet explicitly incorporated such feedback in our modelling, and it may well turn out to be important (see, for example, the recent simulations of Di Matteo et al. 2005; Springel et al. 2005a; Hopkins et al. 2005). We assume ‘quasar mode’ accretion to be closely associated with starbursts, so this feedback channel may be partially represented in our models by an enhanced effective feedback efficiency associated with star formation and supernovae (see Section 3.6).
3.4.2 The ‘radio mode’
In our model, low energy ‘radio’ activity is the result of hot gas accretion onto a central supermassive black hole once a static hot halo has formed around the black hole’s host galaxy. We assume this accretion to be continual and quiescent and to be described by a simple phenomenological model:
| (10) |
where is the black hole mass, is the fraction of the total halo mass in the form of hot gas, is the virial velocity of the halo, and is a free parameter with units of with which we control the efficiency of accretion. We find below that accurately reproduces the turnover at the bright end of the galaxy luminosity function. Note that is proportional to the total mass of hot gas, so that our formula is simply the product of the hot gas and black hole masses multiplied by a constant efficiency and divided by the Hubble time . In fact, we find to be approximately constant for , so the dependence of on this quantity has little effect. The accretion rate given by Eq. 10 is typically orders-of-magnitude below the Eddington limit. In Section 5 we discuss physical accretion models which may reproduce this phenomenology.
We assume that ‘radio mode’ feedback injects sufficient energy into the surrounding medium to reduce or even stop the cooling flow described in Section 3.2. We take the mechanical heating generated by the black hole accretion of Eq. 10 to be
| (11) |
where is the standard efficiency with which mass is assumed to produce energy near the event horizon, and is the speed of light. This injection of energy compensates in part for the cooling, giving rise to a modified infall rate (Eq. 6) of
| (12) |
For consistency we never allow to fall below zero. It is worth noting that (Eq. 6) and (Eq. 12), so that
| (13) |
(These scalings are exact for an EdS universe; we have omitted weak coefficient variations in other cosmologies.) Thus in our model the effectiveness of radio AGN in suppressing cooling flows is greatest at late times and for large values of black hole mass. This turns out to be the qualitative behaviour needed for the suppression of cooling flows to reproduce successfully the luminosities, colours and clustering of low redshift bright galaxies.
3.4.3 The growth of supermassive black holes
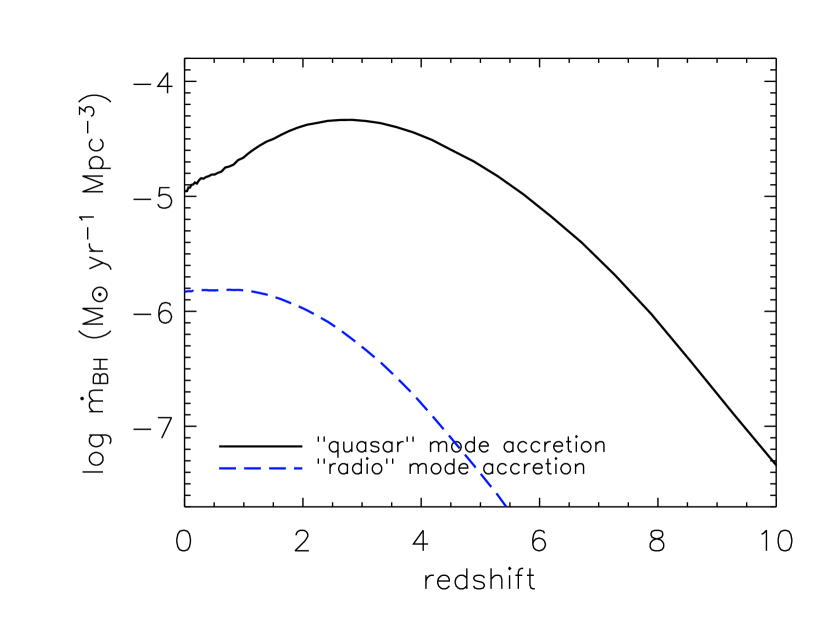
Fig. 3 shows the evolution of the mean black hole accretion rate per unit volume averaged over the entire Millennium Simulation. We separate the accretion into the ‘quasar’ and ‘radio’ modes described above (solid and dashed lines respectively). Black hole mass growth in our model is dominated by the merger-driven ‘quasar mode’, which is most efficient at redshifts of two to four, dropping by a factor of five by redshift zero. This behaviour has similar form to but is weaker than the observed evolution with redshift of the bright quasar population (e.g. Hartwick & Schade, 1990). (See also the discussion in Kauffmann & Haehnelt 2000). In contrast, our ‘radio mode’ is significant only at late times, as expected from the scaling discussed above, and for the high feedback efficiency assumed in Eq. 11 it contributes only 5% of the final black hole mass density. We will show, however, that the outflows generated by this accretion can have a major impact on the final galaxy properties. Finally, integrating the accretion rate density over time gives a present day black hole mass density of Mpc-3, consistent with recent observational estimates (Yu & Tremaine, 2002; Merloni, 2004).
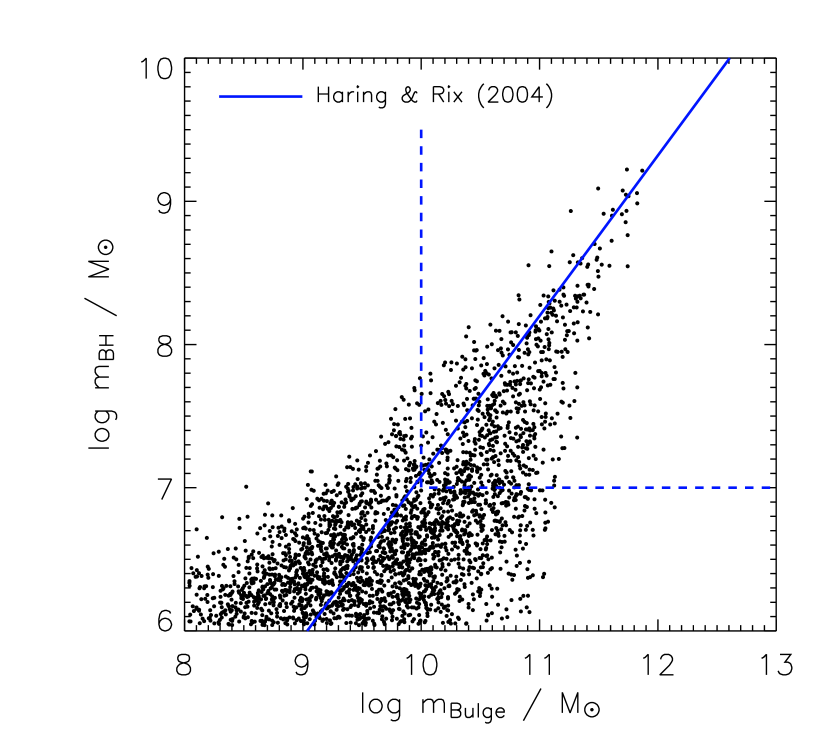
The relationship between black hole mass and bulge mass is plotted in Fig. 4 for the local galaxy population in our ‘best’ model. In this figure, the solid line shows the best fit to the observations given by Häring & Rix (2004) for a sample of nearby galaxies with well measured bulge and black hole masses. Their results only probe masses over the range bounded by the dashed lines. Our model galaxies produces a good match to these observations with comparable scatter in the observed range (see their Fig. 2).
3.5 Star formation
We use a simple model for star formation similar to those adopted by earlier authors. We assume that all star formation occurs in cold disk gas, either quiescently or in a burst (see Section 3.7). Based on the observational work of Kennicutt (1998), we adopt a threshold surface density for the cold gas below which no stars form, but above which gas starts to collapse and form stars. According to Kauffmann (1996), this critical surface density at a distance from the galaxy centre may be approximated by
| (14) |
We convert this critical surface density into a critical mass by assuming the cold gas mass to be evenly distributed over the disk. The resulting critical cold gas mass is:
| (15) |
where we assume the disk scale length to be (Mo et al., 1998), and set the outer disk radius to , based on the properties of the Milky Way (van den Bergh, 2000). Here is the spin parameter of the dark halo in which the galaxy resides (Bullock et al., 2001), measured directly from the simulation at each time step. When the mass of cold gas in a galaxy is greater than this critical value we assume the star formation rate to be
| (16) |
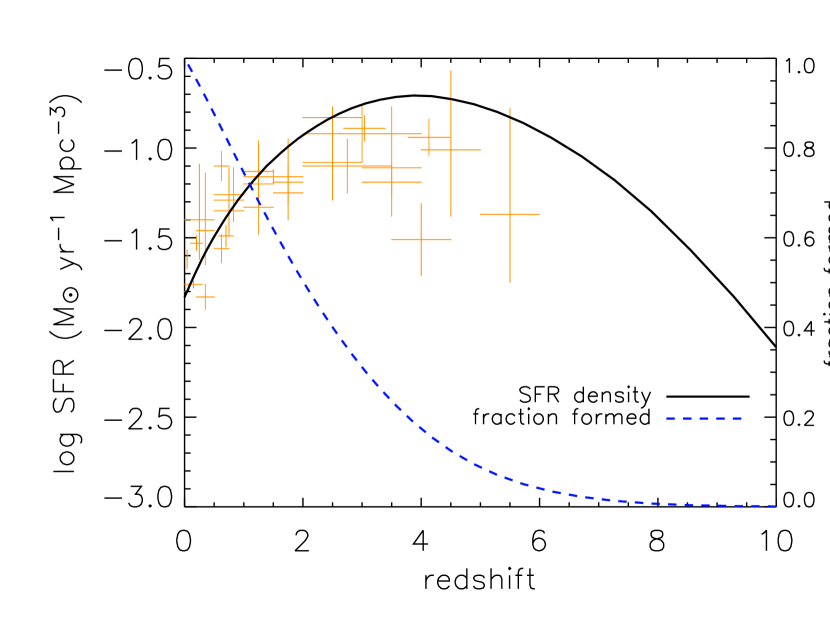
where the efficiency is typically set so that to percent of the gas is converted into stars in a disk dynamical time , which we define to be . This star formation model produces a global star formation history consistent with the observed star formation density of the universe out to at least , as shown in Fig. 5 (note that this figure also includes star formation through starbursts – see Section 3.7) .
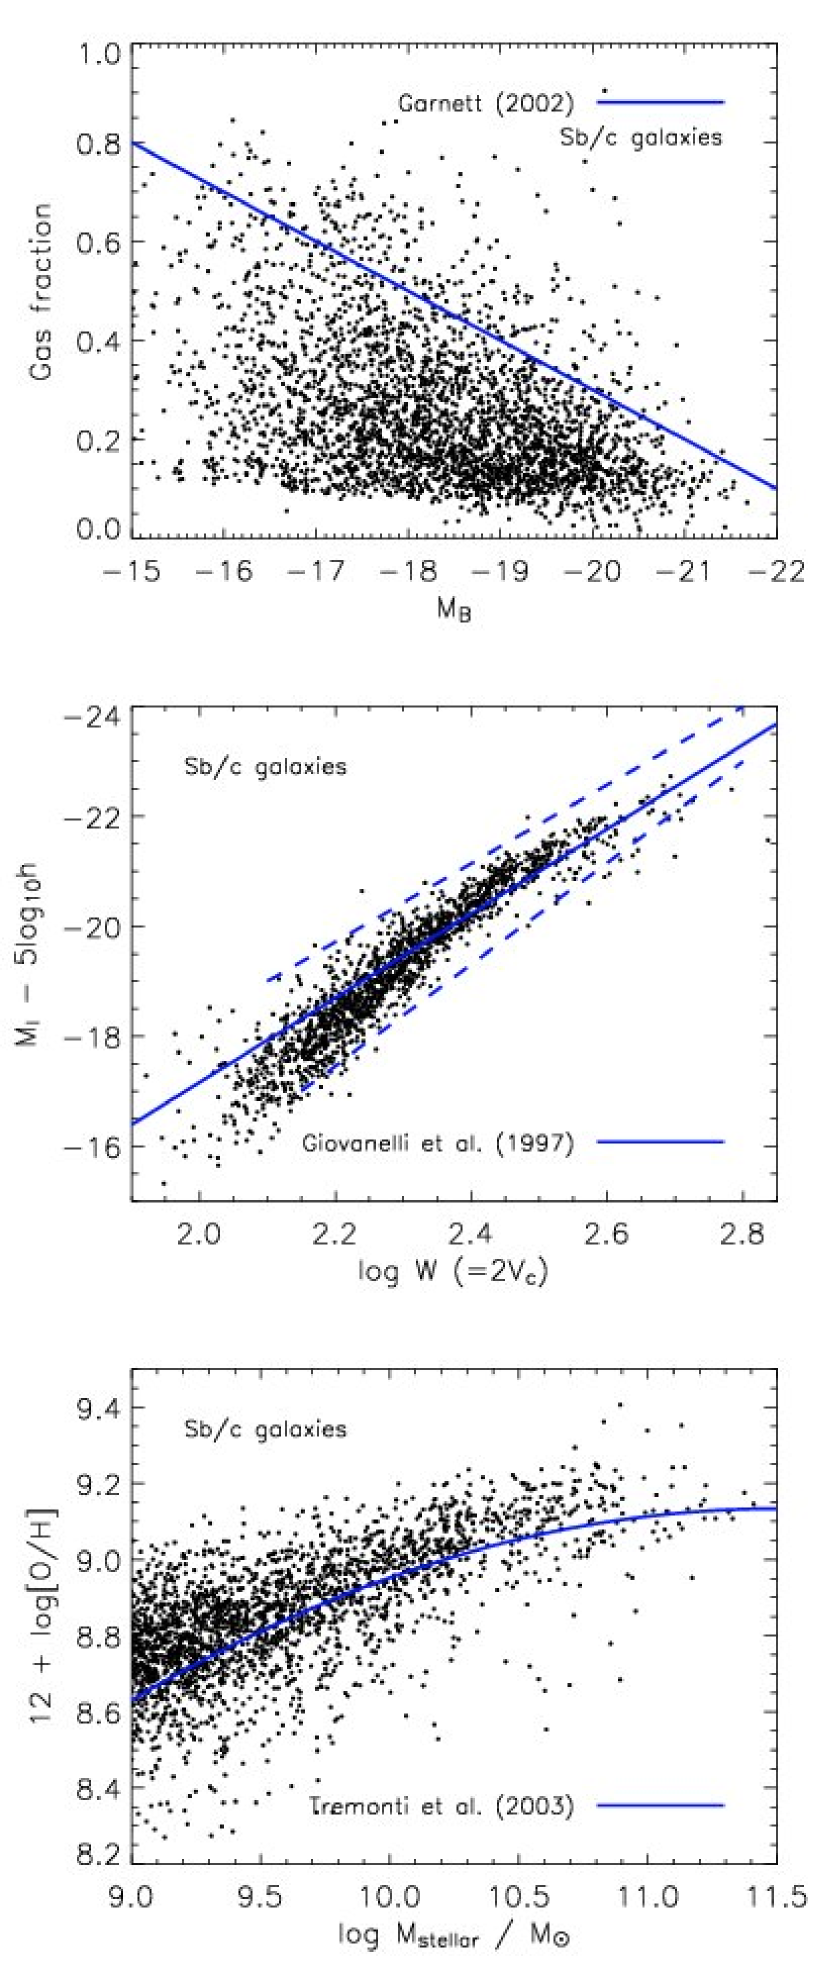
When implemented in our model, Eq. 16 leads to episodic star formation that self-regulates so as to maintain the critical surface density of Eq. 14. This naturally reproduces the observed spiral galaxy gas fractions without the need for additional parameterisation, as we demonstrate in the top panel of Fig. 6 using model Sb/c galaxies identified as objects with bulge-to-total luminosity: (bulge formation is described in Section 3.7).
3.6 Supernova feedback
As star formation proceeds, newly formed massive stars rapidly complete their evolution and end their life as supernovae. These events inject gas, metals and energy into the surrounding medium, reheating cold disk gas and possibly ejecting gas even from the surrounding halo.
The observations of Martin (1999) suggest modelling the amount of cold gas reheated by supernovae as
| (17) |
where is the mass of stars formed over some finite time interval and is a parameter which we fix at based on the observational data. The energy released in this interval can be approximated by
| (18) |
where is the mean energy in supernova ejecta per unit mass of stars formed, and parametrises the efficiency with which this energy is able to reheat disk gas. Based on a standard initial stellar mass function and standard supernova theory we take . In addition, for our ‘best’ model we adopt . If the reheated gas were added to the hot halo without changing its specific energy, its total thermal energy would change by
| (19) |
Thus the excess energy in the hot halo after reheating is just . When the energy transferred with the reheated gas is insufficient to eject any gas out of the halo and we assume all hot gas remains associated with the halo. When excess energy is present, i.e. , we assume that some of the hot gas is ejected from the halo into an external ‘reservoir’. Specifically, we take
| (20) |
where is the total thermal energy of the hot gas, and we set when this equation gives negative values (implying as discussed above). This is similar to the traditional semi-analytic feedback recipe, , but with a few additions. For small the entire hot halo can be ejected and then must saturate at . Conversely, no hot gas can be ejected from the halo for , i.e. for halo circular velocities exceeding about for our favoured parameters.
Ejected gas leaves the galaxy and its current halo in a wind or ‘super-wind’, but it need not be lost permanently. As the dark halo grows, some of the surrounding ejecta may fall back in and be reincorporated into the cooling cycle. We follow Springel et al. (2001a) and De Lucia et al. (2004) and model this by assuming
| (21) |
where controls the amount of reincorporation per dynamical time; typically we take to . Such values imply that all the ejected gas will return to the hot halo in a few halo dynamical times.
The prescriptions given in this section are simple, as well as physically and energetically plausible, but they have little detailed justification either from observation or from numerical simulation. They allow us to track in a consistent way the exchange of each halo’s baryons between our four phases (stars, cold disk gas, hot halo gas, ejecta), but should be regarded as a rough attempt to model the complex astrophysics of feedback which will surely need significant modification as the observational phenomenology of these processes is explored in more depth.
Supernova feedback and star formation act together to regulate the stellar growth of a galaxy. This is especially important for galaxies, where feedback can eject most of the baryons from the system, reducing the supply of star-forming material for time periods much longer than the cooling/supernova heating cycle. In the middle panel of Fig. 6 we plot the Tully-Fisher relation for model Sb/c galaxies (see Section 3.5). The Tully-Fisher relation is strongly influenced by the link between star formation and supernova heating. The circular velocity of a galactic disk is (to first order) proportional to the virial velocity of the host dark matter halo and thus to its escape velocity. In our model (and most others) this is closely related to the ability of the galaxy to blow a wind. The luminosity of a galaxy is determined by its ability to turn its associated baryons into stars. The overall efficiency of this process in the face of supernova and AGN feedback sets the amplitude of the Tully-Fisher relation, while the way in which the efficiency varies between systems of different circular velocity has a strong influence on the slope.
To predict a Tully-Fisher relation for our model we need to assign a maximum rotation velocity to each of our galaxy disks. For central galaxies we simply take this velocity to be the of the surrounding halo, while for satellite galaxies we take it to be the of the surrounding halo at the last time the galaxy was a central galaxy. This is a crude approximation, and for realistic halo structures it is likely to be an underestimate both because of the concentration of the dark matter distribution and because of the gravitational effects of the baryons (e.g. Mo et al., 1998). Obtaining a good simultaneous fit to observed luminosity functions and Tully-Fisher relations remains a difficult problem within the CDM paradigm (see, for example Cole et al., 2000). Our unrealistic assumption for the disk rotation velocity actually produces quite a good fit to the observational data of Giovanelli et al. (1997), demonstrating that our simple star formation and feedback recipes can adequately represent the growth of stellar mass across a wide range of scales. We find clear deviations from power law behaviour for (approximately ), where the efficiency of removing gas from low mass systems combines with our threshold for the onset of star formation to reduce the number of stars that can form. The resulting downward bend is qualitatively similar to that pointed out in real data by McGaugh et al. (2000). These authors show that including the gaseous component to construct a ‘baryonic’ Tully-Fisher relation brings the observed points much closer to a power-law, and the same is true in the model we present here. Limiting star formation in galaxies that inhabit shallow potentials has a strong effect on the faint-end of the galaxy luminosity function, as will be seen in Section. 4.2.
3.7 Galaxy morphology, merging and starbursts
In the model we discuss here, the morphology of a galaxy is assumed to depend only on its bulge-to-total luminosity ratio, which in turn is determined by three distinct physical processes: disk growth by accretion, disk buckling to produce bulges, and bulge formation through mergers. We treat disk instabilities using the simple analytic stability criterion of Mo et al. (1998); the stellar disk of a galaxy becomes unstable when the following inequality is met,
| (22) |
where we again approximate the rotation velocity of the disk by . For each galaxy at each time-step we evaluate the left-hand side of Eq. 22, and if it is smaller than unity we transfer enough stellar mass from disk to bulge (at fixed ) to restore stability.
Galaxy mergers shape the evolution of galaxies, affecting both their morphology and (through induced starbursts) their star formation history. Mergers can occur in our model between the central galaxy of a dark halo or subhalo and a satellite galaxy which has lost its own dark subhalo. Substructure is followed in the Millennium Run down to a 20 particle limit, which means that the orbit of a satellite galaxy within a larger halo is followed explicitly until its subhalo mass drops below . After this point, the satellite’s position and velocity are represented by those of the most bound particle of the subhalo at the last time it was identified. At the same time, however, we start a merger ‘clock’ and estimate a merging time for the galaxy using the dynamical friction formula of Binney & Tremaine (1987),
| (23) |
This formula is valid for a satellite of mass orbiting in an isothermal potential of circular velocity at radius . We take and to be the values measured for the galaxy at the last time its subhalo could be identified. The Coulomb logarithm is approximated by . The satellite is then merged with the central galaxy a time after its own subhalo was last identified. If the main halo merges with a larger system before this occurs, a new value for is calculated and the merger clock is restarted.
The outcome of the merger will depend on the baryonic mass ratio of the two progenitors . When one dominates the process, i.e. a small satellite merging with a larger central galaxy, the stars of the satellite are added to the bulge of the central galaxy and a minor merger starburst (see below) will result. The cold gas of the satellite is added to the disk of the central galaxy along with any stars that formed during the burst. Such an event is called a minor merger.
If, on the other hand, the masses of the progenitors are comparable a major merger will result. Under these circumstances the starburst is more significant, with the merger destroying the disks of both galaxies to form a spheroid in which all stars are placed. The dividing line between a major and minor merger is given by the parameter : when the mass ratio of the merging progenitors is larger than a major merger results, otherwise the event is a minor merger. Following Springel et al. (2001a) we choose and keep this fixed throughout.
Our starburst implementation is based on the ‘collisional starburst’ model of Somerville et al. (2001). In this model, a fraction of the combined cold gas from the two galaxies is turned into stars as a result of the merger:
| (24) |
where the two parameters are taken as and . This model provides a good fit to the numerical results of Cox et al. (2004) and also Mihos & Hernquist (1994, 1996) for merger mass ratios ranging from 1:10 to 1:1.
3.8 Spectroscopic evolution and dust
The photometric properties of our galaxies are calculated using stellar population synthesis models from Bruzual & Charlot (2003). Our implementation is fully described in De Lucia et al. (2004) and we refer the reader there (and to references therein) for further details.
To include the effects of dust when calculating galaxy luminosities we apply the simple ‘plane-parallel slab’ model of Kauffmann et al. (1999). This model is clearly oversimplified, but it permits us to make a reasonable first-order correction for dust extinction in actively star-forming galaxies. For the details of this model we refer the reader to Kauffmann et al. (1999) and to references therein.
3.9 Metal enrichment
Our treatment of metal enrichment is essentially identical to that described in De Lucia et al. (2004). In this model a yield of heavy elements is returned for each solar mass of stars formed. These metals are produced primarily in the supernovae which terminate the evolution of short-lived, massive stars. In our model we deposit them directly into the cold gas in the disk of the galaxy. (An alternative would clearly be to add some fraction of the metals directly to the hot halo. Limited experiments suggest that this makes little difference to our main results.) We also assume that a fraction of the mass of newly formed stars is recycled immediately into the cold gas in the disk, the so called ‘instantaneous recycling approximation’ (see Cole et al., 2000). For full details on metal enrichment and exchange processes in our model see De Lucia et al. (2004). In the bottom panel of Fig. 6 we show the metallicity of cold disk gas for model Sb/c galaxies (selected, as before, by bulge-to-total luminosity, as described in Section 3.5) as a function of total stellar mass. For comparison, we show the result of Tremonti et al. (2004) for mean HII region abundances in SDSS galaxies.
4 Results
In this section we examine how the suppression of cooling flows in massive systems affects galaxy properties. As we will show, the effects are only important for high mass galaxies. Throughout our analysis we use the galaxy formation model outlined in the previous sections with the parameter choices of Table 1 except where explicitly noted.
4.1 The suppression of cooling flows
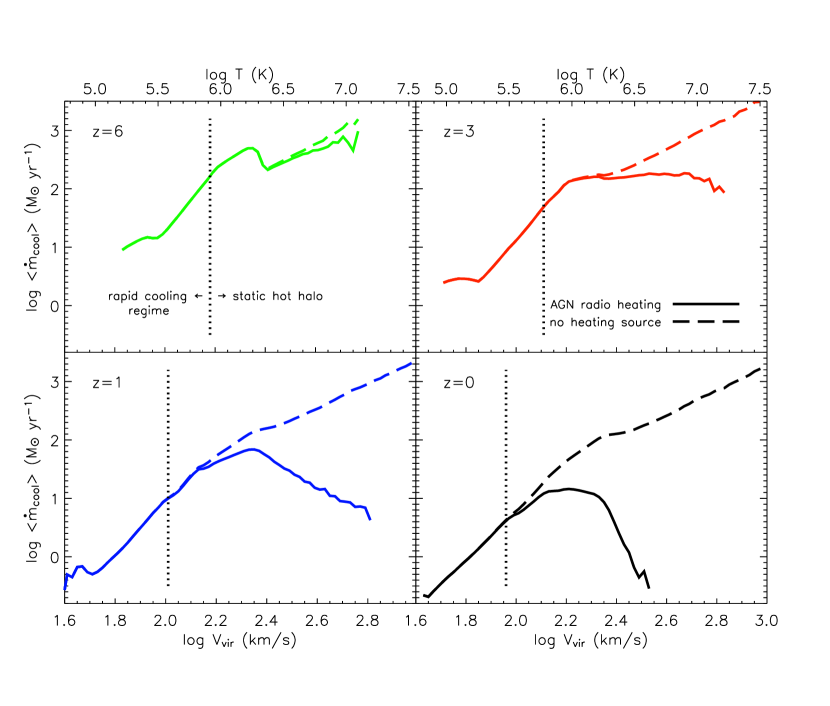
We begin with Fig. 7, which shows how our ‘radio mode’ heating model modifies gas condensation. We compare mean condensation rates with and without the central AGN heating source as a function of halo virial velocity (solid and dashed lines respectively). Recall that virial velocity provides a measure of the equilibrium temperature of the system through , as indicated by the scale on the top axis. The four panels show the behaviour at four redshifts between six and the present day. The vertical dotted line in each panel marks haloes for which , the transition between systems that form static hot haloes and those where infalling gas cools rapidly onto the central galaxy disk (see section 3.2 and Fig. 2). This transition moves to haloes of lower temperature with time, suggesting a ‘down-sizing’ of the characteristic mass of actively star-forming galaxies. At lower gas continues to cool rapidly, while at higher new fuel for star formation must come from cooling flows which are affected by ‘radio mode’ heating.
The effect of ‘radio mode’ feedback is clearly substantial. Suppression of condensation becomes increasingly effective with increasing virial temperature and decreasing redshift. The effects are large for haloes with (K) at . Condensation stops almost completely between and the present in haloes with (K). Such systems correspond to the haloes of groups and clusters which are typically observed to host massive elliptical or cD galaxies at their centres. Our scheme thus produces results which are qualitatively similar to the ad hoc suppression of cooling flows assumed in previous models of galaxy formation. For example, Kauffmann et al. (1999) switched off gas condensation in all haloes with , while Hatton et al. (2003) stopped condensation when the bulge mass exceeded a critical threshold.
4.2 Galaxy properties with and without AGN heating
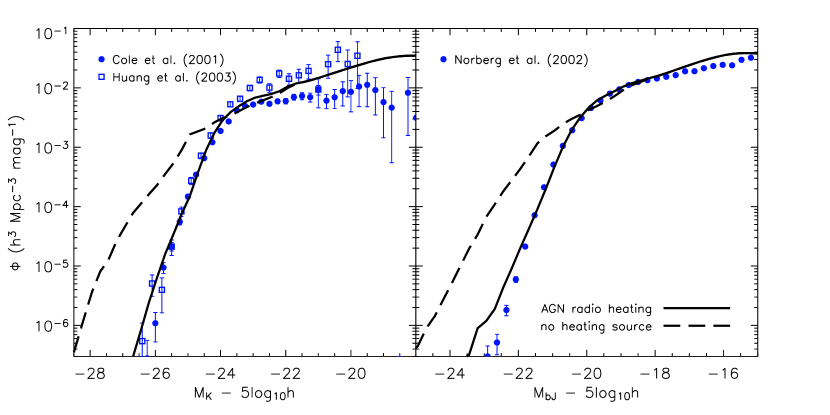
The suppression of cooling flows in our model has a dramatic effect on the bright end of the galaxy luminosity function. In Fig. 8 we present - and -band luminosity functions (left and right panels respectively) with and without ‘radio mode’ feedback (solid and dashed lines respectively). The luminosities of bright galaxies are reduced by up to two magnitudes when the feedback is switched on, and this induces a relatively sharp break in the luminosity function which matches the observations well. We demonstrate this by overplotting K-band data from Cole et al. (2001) and Huang et al. (2003) in the left panel, and -band data from Norberg et al. (2002) in the right panel. In both band-passes the model is quite close to the data over the full observed range. We comment on some of the remaining discrepancies below.
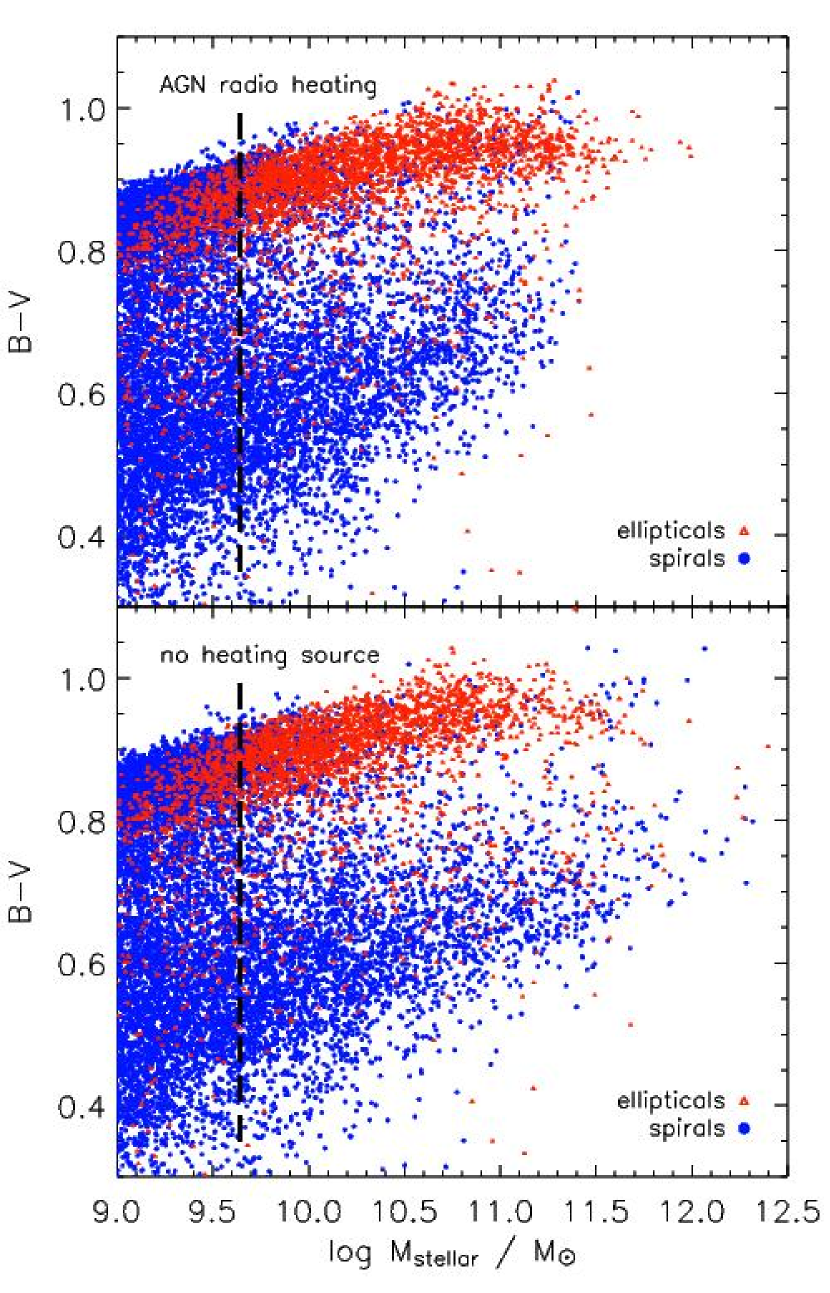
Our feedback model also has a significant effect on bright galaxy colours, as we show in Fig. 9. Here we plot the colour distribution as a function of stellar mass, with and without the central heating source (top and bottom panels respectively). In both panels we have colour-coded the galaxy population by morphology as estimated from bulge-to-total luminosity ratio (split at ). Our morphological resolution limit is marked by the dashed line at a stellar mass of ; this corresponds approximately to a halo of 100 particles in the Millennium Run. Recall that a galaxy’s morphology depends both on its past merging history and on the stability of its stellar disk in our model. Both mergers and disk instabilities contribute stars to the spheroid, as described in Section 3.7. The build-up of haloes containing fewer than 100 particles is not followed in enough detail to model these processes robustly.
A number of important features can be seen in Fig. 9. Of note is the bimodal distribution in galaxy colours, with a well-defined red sequence of appropriate slope separated cleanly from a broader ‘blue cloud’. It is significant that the red sequence is composed predominantly of early-type galaxies, while the blue cloud is comprised mostly of disk-dominated systems. This aspect of our model suggests that that the physical processes which determine morphology (i.e. merging, disk instability) are closely related to those which control star formation history (i.e. gas supply) and thus determine galaxy colour. The red and blue sequences both display a strong metallicity gradient from low to high mass (c.f. Fig. 6), and it is this which induces a ‘slope’ in the colour-magnitude relations which agrees well with observation (e.g. Baldry et al., 2004).
By comparing the upper and lower panels in Fig. 9 we can see how ‘radio mode’ feedback modifies the luminosities, colours and morphologies of high mass galaxies. Not surprisingly, the brightest and most massive galaxies are also the reddest and are ellipticals when cooling flows are suppressed, whereas they are brighter, more massive, much bluer and typically have disks if cooling flows continue to supply new material for star formation. AGN heating cuts off the gas supply to the disk from the surrounding hot halo, truncating star formation and allowing the existing stellar population to redden. However, these massive red galaxies do continue to grow through merging. This mechanism allows the dominant cluster galaxies to gain a factor 2 or 3 in mass without significant star formation, in apparent agreement with observation (Aragon-Salamanca et al., 1998). This late-stage (i.e. ) hierarchical growth moves objects to higher mass without changing their colours.
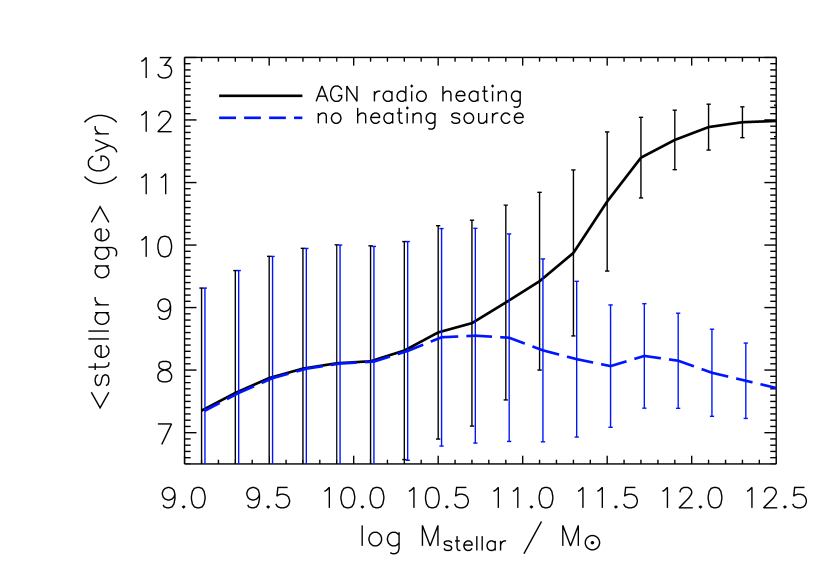
It is also interesting to examine the effect of AGN heating on the stellar ages of galaxies. In Fig. 10 the solid and dashed lines show mean stellar age as a function of stellar mass for models with and without ‘radio mode’ feedback, while error bars indicate the rms scatter around the mean. Substantial differences are seen for galaxies with : the mean age of the most massive galaxies approaching Gyr when cooling flows are suppressed but remaining around Gyr when feedback is switched off. Such young ages are clearly inconsistent with the old stellar populations observed in the majority of massive cluster ellipticals.
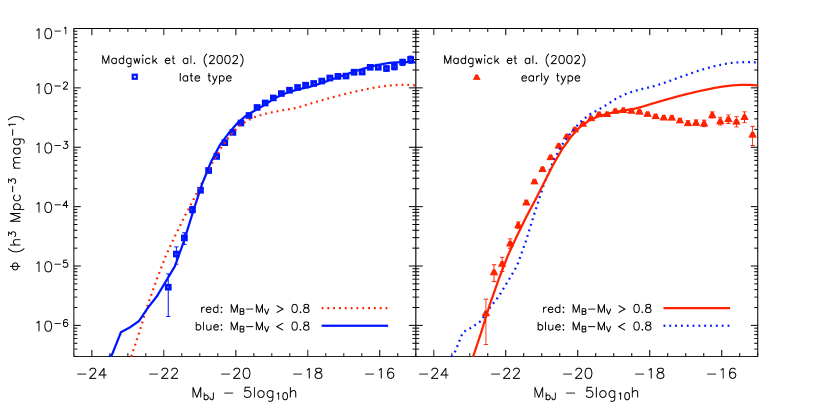
The colour bimodality in Fig. 9 is so pronounced that it is natural to divide our model galaxies into red and blue populations and to study their properties separately. We do this by splitting at , an arbitrary but natural choice. Fig. 11 shows separate luminosity functions for the resulting populations. For comparison we overplot observational results from Madgwick et al. (2002) for 2dFGRS galaxies split by spectral type. Their luminosity functions are essentially identical to those of Cole et al. (2005), who split the 2dFGRS catalogue by - colour. It thus can serve to indicate the observational expectations for populations of different colour. The broad behaviour of the red and blue populations is similar in the model and in the 2dFGRS. The faint-end of the luminosity function is dominated by late-types, whereas the bright end has an excess of early-types. The two populations have equal abundance about half to one magnitude brighter than (Norberg et al., 2002).
Fig. 11 also shows some substantial differences between model and observations. The red and blue populations differ more in the real data than they do in the model. There is a tail of very bright blue galaxies in the model, which turn out to be objects undergoing strong, merger-induced starbursts. These correspond in abundance, star formation rate and evolutionary state to the observed population of Ultraluminous Infrared Galaxies (ULIRG’s) with the important difference that almost all the luminosity from young stars in the real systems is absorbed by dust and re-emitted in the mid- to far-infrared (Sanders & Mirabel, 1996). Clearly we need better dust modelling than our simple ‘slab’ model (Section 3.8) in order to reproduce the properties of such systems adequately. If we suppress starbursts in bright galaxy mergers we find that the blue tail disappears and the observed behaviour is recovered. A second and substantial discrepancy is the apparent overproduction of faint red galaxies in our model, as compared to the 2dF measurements (however see Popesso et al., 2005; Gonzalez et al., 2005). Further work is clearly needed to understand the extent and significance of this difference.
5 Physical models of AGN feedback
Our phenomenological model for ‘radio mode’ feedback (Section 3.4.2) is not grounded in any specific model for hot gas accretion onto a black hole or for the subsequent generation and thermalization of energy through radio outflows. Rather it is based on the observed properties of cooling flows and their central radio sources, and on the need for a source of feedback which can suppress gas condensation onto massive galaxies without requiring the formation of new stars. We have so far focused on the effects of such feedback without discussing how it might be realised. In this section we present two physical models which suggest how accretion onto the central black hole may lead to activity in a way which could justify the parameter scalings we have adopted.
5.1 Cold cloud accretion
A simple picture for cooling flow evolution, based on the similarity solution of Bertschinger (1989) for an unperturbed halo in isolation, can be summarised as follows. Cooling flows develop in any halo where the cooling time of the bulk of the hot gas is longer than the age of the system so that a static hot halo can form. Such haloes usually have a strong central concentration and we approximate their structure by a singular isothermal sphere. The inner regions then have a local cooling time shorter than the age of the system, and the gas they contain radiates its binding energy and flows inwards. The flow region is bounded by the cooling radius where the local cooling time is equal to the age of the system (see section 3.2). This radius increases with time as . As Bertschinger showed, the temperature of the gas increases by about 20% as it starts to flow inwards, and its density profile flattens to . Initially, the flow is subsonic and each gas shell sinks stably and isothermally in approximate hydrostatic equilibrium. As it sinks, however, its inward velocity accelerates because its cooling time shrinks more rapidly than the sound travel time across it, and at the sonic radius, , the two become equal. At this point the shell goes into free fall, its temperature decreases rapidly and it may fragment as a result of thermal instability (Cowie et al., 1980; Nulsen, 1986; Balbus & Soker, 1989). The dominant component of the infalling gas is then in the form of cold clouds and is no longer self-coupled by hydrodynamic forces. Different clouds pursue independent orbits, some with pericentres perhaps orders of magnitude smaller than . If these lie within the zone of influence of the black hole, , we assume that some of the cold gas becomes available for fuelling the radio source; otherwise we assume it to be added to the cold gas disk.
The parameter scalings implied by this picture can be estimated as follows. The sound travel time across a shell at the cooling radius is shorter than the cooling time by a factor . At smaller radii the ratio of cooling time to sound travel time decreases as so that implying . If we adopt as the condition for effective fuelling of the radio source, we obtain
| (25) |
as the corresponding minimum black hole mass for fragmented clouds to be captured. Under such conditions, only a small fraction () of the cooling flow mass need be accreted to halt the flow. The ratio in parentheses on the right-hand side of this equation scales approximately as , so the minimum black hole mass scales approximately as and is almost independent of . In our model, the growth of black holes through mergers and ‘quasar mode’ accretion produces a population where mass increases with time and with host halo mass. As a result, effective fuelling takes place primarily in the more massive haloes and at late times for this ‘cold cloud’ prescription.
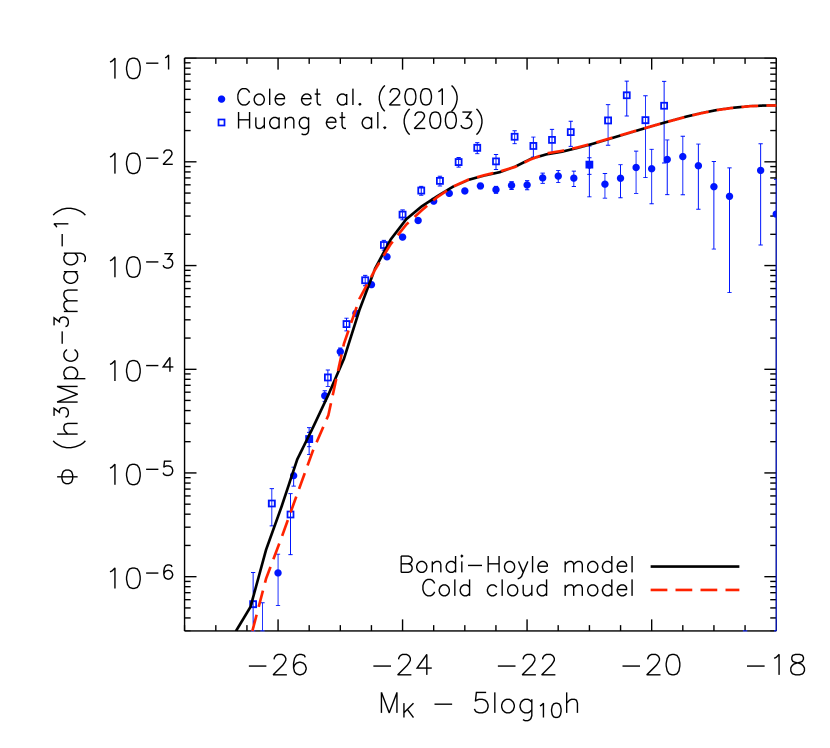
To test this particular model we switch off our standard phenomenological treatment of ‘radio mode’ feedback (section 3.4.2), assuming instead that feedback occurs only when Eq. 25 is satisfied and that in this case it is sufficient to prevent further condensation of gas from the cooling flow. All other elements of our galaxy and black hole formation model are unchanged. The resulting cooling flow suppression is similar to that seen in Fig. 7, and all results presented in Section 3 and 4 are recovered. An illustration of this is given by Fig. 12, where we compare the K-band luminosity function from this particular model (the dashed line) to the observational data (c.f. also Fig. 8). The model works so well, of course, because the numerical coefficient in Eq. 25 is uncertain and we have taken advantage of this to choose a value which puts the break in the luminosity function at the observed position. This adjustment plays the role of the efficiency parameter in our standard analysis (see Eq. 10).
5.2 Bondi-Hoyle accretion
Our second physical model differs from the first in assuming that accretion is not from the dominant, cold cloud component which forms within the sonic radius, but rather from a subdominant hot component which fills the space between these clouds. The clouds themselves are assumed to be lost to the star-forming disk. The density profile of the residual hot component was estimated by Nulsen & Fabian (2000) from the condition that the cooling time of each radial shell should remain equal to the sound travel time across it as it flows inwards. This requires the density of the hot component to vary as within and thermal instabilities must continually convert material into condensed clouds in order to maintain this structure as the hot gas flows in.
The rate at which hot gas is accreted onto the black hole can then be estimated from the Bondi-Hoyle formula (Bondi, 1952; Edgar, 2004):
| (26) |
Here is the (assumed uniform) density of hot gas around the black hole, and in all that follows we approximate the sound speed, , by the virial velocity of the halo, . Of course, the density distribution of gas surrounding the black hole is not uniform so the question immediately arises as to what density we should choose. We follow a suggestion of E. Churazov and use the value predicted by the ‘maximum cooling flow’ model of Nulsen & Fabian (2000) at the Bondi radius , the conventional boundary of the sphere of influence of the black hole. We therefore equate the sound travel time across a shell at this radius to the local cooling time there:
| (27) |
Solving for the density gives
| (28) |
Combining Eq. 28 with 26 provides us with the desired estimate for the hot gas accretion rate onto the black hole:
| (29) |
Notice that this rate depends only on the black hole mass and on the virial temperature of the halo. It is independent both of time and of , the hot gas fraction of the halo. It is valid as long as , which is always the case in our models.
To investigate the effects of this model we replace the phenomenological ‘radio mode’ accretion rate of Eq. 10 with that given by Eq. 29. Since the latter has no adjustable efficiency, we use the energy generation parameter of Eq. 11 to control the effectiveness of cooling flow suppression. (This was not necessary before since always appeared in the product , where is the efficiency parameter of Eq. 10.) With this change of cooling flow accretion model and taking , we are able to recover the results of Sections 3 and 4 without changing any other aspects of our galaxy and black hole formation model. The final galaxy population is, in fact, almost identical to that presented in previous sections. This is not surprising, perhaps, since Eq. 29 has very similar scaling properties to Eq. 10. In Fig. 12 we illustrate the success of the model by overplotting its prediction for the K-band luminosity function (the solid line) on the observational data and on the prediction of the cold cloud accretion model of the last subsection. The two models agree very closely both with each other and with our standard phenomenological model (see Fig. 8).
6 Conclusions
AGN feedback is an important but relatively little explored element in the co-evolution of galaxies and the supermassive black holes at their centres. In this paper we set up machinery to study this co-evolution in unprecedented detail using the very large Millennium Run, a high-resolution simulation of the growth of structure in a representative region of the concordance CDM cosmology. Most of our modelling follows earlier work, but in an important extension we introduce a ‘radio’ feedback mode, based on simple physical models and on the observed phenomenology of radio sources in cooling flows. This mode suppresses gas condensation at the centres of massive haloes without requiring the formation of new stars. Our modelling produces large catalogues of galaxies and supermassive black holes which can be used to address a very wide range of issues concerning the evolution and clustering of galaxies and AGN. Some clustering results were already presented in Springel et al. (2005b). In the present paper, however, we limit ourselves to presenting the model in some detail and to investigating the quite dramatic effects which ‘radio mode’ feedback can have on the luminosities and colours of massive galaxies. Our main results can be summarised as follows:
-
(i)
We study the amount of gas supplied to galaxies in each of the two gas infall modes discussed by White & Frenk (1991): the ‘static halo’ mode where postshock cooling is slow and a quasistatic hot atmosphere forms behind the accretion shock; and the ‘rapid cooling’ mode where the accretion shock is radiative and no such atmosphere is present. We distinguish these two modes using the criterion of White & Frenk (1991) as modified by Springel et al. (2001a) and tested explicitly using SPH simulations by Yoshida et al. (2002). Our results show a sharp transition between the two regimes at a halo mass of –. This division depends on the chemical enrichment prescription adopted and moves from higher to lower with time (corresponding to approximately constant ), suggesting a ‘down-sizing’ of star formation activity as the bulk of the gas accreted by the haloes of larger systems is no longer available in the interstellar medium of the central galaxy.
-
(ii)
We have built a detailed model for cooling, star formation, supernova feedback, galaxy mergers and metal enrichment based on the earlier models of Kauffmann et al. (1999), Springel et al. (2001a) and De Lucia et al. (2004). Applied to the Millennium Run this model reproduces many of the observed properties of the local galaxy population: the Tully-Fisher, cold gas fraction/stellar mass and cold gas metallicity/stellar mass relations for Sb/c spirals (Fig. 6); the field galaxy luminosity functions (Fig. 8 & 11); the colour-magnitude distribution of galaxies (Fig. 9); and the increase in mean stellar age with galaxy mass (Fig. 10). In addition the model produces a global star formation history in reasonable agreement with observation (Fig. 5). We also show in Springel et al. (2005b) that the clustering properties of this population are in good agreement with observations.
-
(iii)
Our black hole implementation extends the previous work of Kauffmann & Haehnelt (2000) by assuming three modes of AGN growth: merger-driven accretion of cold disk gas in a ‘quasar mode’, merging between black holes, and ‘radio mode’ accretion when a massive black hole finds itself at the centre of a static hot gas halo. The ‘quasar mode’ is the dominant source for new black hole mass and is most active between redshifts of four and two. The ‘radio mode’ grows in overall importance until and is responsible for the feedback which shuts off the gas supply in cooling flows. This model reproduces the black hole mass/bulge mass relation observed in local galaxies (Fig. 4). The global history of accretion in the ‘quasar mode’ is qualitatively consistent with the evolution inferred from the optical AGN population (Fig. 3).
-
(iv)
Although the overall accretion rate is low, ‘radio mode’ outflows can efficiently suppress condensation in massive systems (Fig. 7). As noted by many authors who have studied the problem in more detail than we do, this provides an energetically feasible solution to the long-standing cooling flow ‘problem’. Our analysis shows that the resulting suppression of gas condensation and star formation can produce luminosity functions with very similar bright end cut-offs to those observed (Fig. 8), as well as colour-magnitude distributions in which the most massive galaxies are red, old and elliptical, rather than blue, young and disk-dominated (Figs 9 and 10).
-
(v)
The colour distribution of galaxies is bimodal at all galaxy masses. Galaxies with early-type bulge-to-disk ratios are confined to the red sequence, as are the most massive galaxies, and the most massive galaxies are almost all bulge-dominated, as observed in the real universe (Fig. 9). This bimodality provides a natural division of model galaxies into red and blue subpopulations. The colour-dependent luminosity functions are qualitatively similar to those found for early and late-type galaxies in the 2dFGRS (Fig. 11), although there are significant discrepancies. After exhausting their cold gas, massive central galaxies grow on the red sequence through ‘burstless’ merging, gaining a factor of two or three in mass without significant star formation (Aragon-Salamanca et al., 1998). Such hierarchical growth does not change a galaxy’s colour significantly, moving it brightward almost parallel to the colour-magnitude relation.
-
(vi)
We present two physical models for black hole accretion from cooling flow atmospheres. We suppose that this accretion is responsible for powering the radio outflows seen at the centre of almost all real cooling flows. The models differ in their assumptions about how gas accretes from the inner regions of the cooling flow, where it is thermally unstable and dynamically collapsing. One assumes accretion of cold gas clouds if these come within the sphere of influence of the black hole, while the other assumes Bondi-like accretion from the residual diffuse hot gas component. Each of the two models can produce galaxy populations similar both to that of our simple phenomenological model for ‘radio mode’ feedback and to the observed population (see Fig. 12). Our main results are thus not sensitive to the details of the assumed accretion models.
The presence of heating from a central AGN has long been suspected as the explanation for the apparent lack of gas condensation in cluster cooling flows. We have shown that including a simple treatment of this process in galaxy formation models not only ‘solves’ the cooling flow problem, but also dramatically affects the properties of massive galaxies, inducing a cut-off similar to that observed at the bright end of the galaxy luminosity function, and bringing colours, morphologies and stellar ages into much better agreement with observation than is the case for models without such feedback. We will extend the work presented here in a companion paper, where we investigate the growth of supermassive black holes and the related AGN activity as a function of host galaxy properties out to high redshift. The catalogues of galaxies and supermasive black holes produced by our modelling machinery are also being used for a very wide range of projects related to understanding formation, evolution and clustering processes, as well as for interpreting observational samples.
Acknowledgements
DC acknowledges the financial support of the International Max Planck Research School in Astrophysics Ph.D. fellowship. GDL thanks the Alexander von Humboldt Foundation, the Federal Ministry of Education and Research, and the Programme for Investment in the Future (ZIP) of the German Government for financial support. Many thanks to Andrea Merloni and Jiasheng Huang. Special thanks to Eugene Churazov for numerous valuable discussions and suggestions. We would also like to thank the anonymous referee for a number of valuable suggestions which helped improve the quality of this paper. The Millennium Run simulation used in this paper was carried out by the Virgo Supercomputing Consortium at the Computing Centre of the Max-Planck Society in Garching.
References
- Aragon-Salamanca et al. (1998) Aragon-Salamanca A., Baugh C. M., Kauffmann G., 1998, MNRAS, 297, 427
- Arav et al. (2001) Arav N., de Kool M., Korista K. T., et al., 2001, ApJ, 561, 118
- Bagla (2002) Bagla J. S., 2002, Journal of Astrophysics and Astronomy, 23, 185
- Balbus & Soker (1989) Balbus S. A., Soker N., 1989, ApJ, 341, 611
- Baldry et al. (2004) Baldry I. K., Glazebrook K., Brinkmann J., et al., 2004, ApJ, 600, 681
- Barnes & Hut (1986) Barnes J., Hut P., 1986, Nature, 324, 446
- Begelman et al. (1991) Begelman M., de Kool M., Sikora M., 1991, ApJ, 382, 416
- Bender & Saglia (1999) Bender R., Saglia R. P., 1999, in ASP Conf. Ser. 182: Galaxy Dynamics - A Rutgers Symposium, 113
- Benson et al. (2003) Benson A. J., Bower R. G., Frenk C. S., Lacey C. G., Baugh C. M., Cole S., 2003, ApJ, 599, 38
- Benson et al. (2002) Benson A. J., Frenk C. S., Lacey C. G., Baugh C. M., Cole S., 2002, MNRAS, 333, 177
- Bertschinger (1989) Bertschinger E., 1989, ApJ, 340, 666
- Binney (1977) Binney J., 1977, ApJ, 215, 483
- Binney & Tabor (1995) Binney J., Tabor G., 1995, MNRAS, 276, 663
- Binney & Tremaine (1987) Binney J., Tremaine S., 1987, Galactic dynamics, Princeton, NJ, Princeton University Press, 1987, 747 p.
- Birnboim & Dekel (2003) Birnboim Y., Dekel A., 2003, MNRAS, 345, 349
- Bode et al. (2000) Bode P., Ostriker J. P., Xu G., 2000, ApJS, 128, 561
- Bondi (1952) Bondi H., 1952, MNRAS, 112, 195
- Brüggen & Kaiser (2002) Brüggen M., Kaiser C. R., 2002, Nature, 418, 301
- Bruzual & Charlot (2003) Bruzual G., Charlot S., 2003, MNRAS, 344, 1000
- Bullock et al. (2001) Bullock J. S., Dekel A., Kolatt T. S., et al., 2001, ApJ, 555, 240
- Burns et al. (1981) Burns J. O., Gregory S. A., Holman G. D., 1981, ApJ, 250, 450
- Churazov et al. (2002) Churazov E., Sunyaev R., Forman W., Böhringer H., 2002, MNRAS, 332, 729
- Cole et al. (2005) Cole S., et al., 2005, MNRAS, submited, astro-ph/0501174
- Cole et al. (1994) Cole S., Aragon-Salamanca A., Frenk C. S., Navarro J. F., Zepf S. E., 1994, MNRAS, 271, 781
- Cole et al. (2000) Cole S., Lacey C. G., Baugh C. M., Frenk C. S., 2000, MNRAS, 319, 168
- Cole et al. (2001) Cole S., Norberg P., Baugh C. M., et al., 2001, MNRAS, 326, 255
- Colless et al. (2001) Colless M., Dalton G., Maddox S., et al., 2001, MNRAS, 328, 1039
- Cowie & Binney (1977) Cowie L. L., Binney J., 1977, ApJ, 215, 723
- Cowie et al. (1980) Cowie L. L., Fabian A. C., Nulsen P. E. J., 1980, MNRAS, 191, 399
- Cowie et al. (1996) Cowie L. L., Songaila A., Hu E. M., Cohen J. G., 1996, AJ, 112, 839
- Cox et al. (2004) Cox T. J., Primack J., Jonsson P., Somerville R. S., 2004, ApJL, 607, L87
- Crenshaw et al. (2003) Crenshaw D. M., Kraemer S. B., George I. M., 2003, ARA&A, 41, 117
- Davis et al. (1985) Davis M., Efstathiou G., Frenk C. S., White S. D. M., 1985, ApJ, 292, 371
- de Kool et al. (2001) de Kool M., Arav N., Becker R. H., et al., 2001, ApJ, 548, 609
- De Lucia et al. (2004) De Lucia G., Kauffmann G., White S. D. M., 2004, MNRAS, 349, 1101
- Di Matteo et al. (2005) Di Matteo T., Springel V., Hernquist L., 2005, Nature, 433, 604
- Edgar (2004) Edgar R., 2004, New Astronomy Review, 48, 843
- Efstathiou (1992) Efstathiou G., 1992, MNRAS, 256, 43P
- Fabian & Nulsen (1977) Fabian A. C., Nulsen P. E. J., 1977, MNRAS, 180, 479
- Fabian et al. (2003) Fabian A. C., Sanders J. S., Allen S. W., et al., 2003, MNRAS, 344, L43
- Fan et al. (2001) Fan X., Narayanan V. K., Lupton R. H., et al., 2001, AJ, 122, 2833
- Forcada-Miró & White (1997) Forcada-Miró M. I., White S. D. M., 1997, astro-ph/9712204
- Garnett (2002) Garnett D. R., 2002, ApJ, 581, 1019
- Ghigna et al. (1998) Ghigna S., Moore B., Governato F., Lake G., Quinn T., Stadel J., 1998, MNRAS, 300, 146
- Giovanelli et al. (1997) Giovanelli R., Haynes M. P., da Costa L. N., Freudling W., Salzer J. J., Wegner G., 1997, ApJL, 477, L1+
- Gnedin (2000) Gnedin N. Y., 2000, ApJ, 542, 535
- Gonzalez et al. (2005) Gonzalez R. E., Lares M., Lambas D. G., Valotto C., 2005, A&A, submitted, astro-ph/0507144
- Häring & Rix (2004) Häring N., Rix H., 2004, ApJL, 604, L89
- Hartwick & Schade (1990) Hartwick F. D. A., Schade D., 1990, ARA&A, 28, 437
- Hatton et al. (2003) Hatton S., Devriendt J. E. G., Ninin S., Bouchet F. R., Guiderdoni B., Vibert D., 2003, MNRAS, 343, 75
- Heckman et al. (1990) Heckman T. M., Armus L., Miley G. K., 1990, ApJS, 74, 833
- Helly et al. (2003) Helly J. C., Cole S., Frenk C. S., et al., 2003, MNRAS, 338, 913
- Hockney & Eastwood (1981) Hockney R. W., Eastwood J. W., 1981, Computer Simulation Using Particles, New York: McGraw-Hill, 1981
- Hoeft et al. (2005) Hoeft M., Yepes G., Gottlober S., Springel V., 2005, MNRAS, submitted, astro-ph/0501304
- Hopkins et al. (2005) Hopkins P. F., et al., 2005, ApJ, submitted, astro-ph/0506398
- Huang et al. (2003) Huang J.-S., Glazebrook K., Cowie L. L., Tinney C., 2003, ApJ, 584, 203
- Kaiser & Binney (2003) Kaiser C. R., Binney J., 2003, MNRAS, 338, 837
- Kauffmann (1996) Kauffmann G., 1996, MNRAS, 281, 475
- Kauffmann et al. (1999) Kauffmann G., Colberg J. M., Diaferio A., White S. D. M., 1999, MNRAS, 303, 188
- Kauffmann & Haehnelt (2000) Kauffmann G., Haehnelt M., 2000, MNRAS, 311, 576
- Kennicutt (1998) Kennicutt R. C., 1998, ApJ, 498, 541
- Keres et al. (2004) Keres D., Katz N., Weinberg D. H., Dave R., 2004, MNRAS, submited, astro-ph/0407095
- Kravtsov et al. (2004) Kravtsov A. V., Gnedin O. Y., Klypin A. A., 2004, ApJ, 609, 482
- Lacey & Cole (1993) Lacey C., Cole S., 1993, MNRAS, 262, 627
- Madau et al. (1996) Madau P., Ferguson H. C., Dickinson M. E., Giavalisco M., Steidel C. C., Fruchter A., 1996, MNRAS, 283, 1388
- Madgwick et al. (2002) Madgwick D. S., Lahav O., Baldry I. K., et al., 2002, MNRAS, 333, 133
- Magorrian et al. (1998) Magorrian J., Tremaine S., Richstone D., et al., 1998, AJ, 115, 2285
- Mandelbaum et al. (2003) Mandelbaum R., McDonald P., Seljak U., Cen R., 2003, MNRAS, 344, 776
- Marconi & Hunt (2003) Marconi A., Hunt L. K., 2003, ApJL, 589, L21
- Martin (1999) Martin C. L., 1999, ApJ, 513, 156
- McGaugh et al. (2000) McGaugh S. S., Schombert J. M., Bothun G. D., de Blok W. J. G., 2000, ApJL, 533, L99
- McNamara et al. (2005) McNamara B. R., Nulsen P. E. J., Wise M. W., et al., 2005, Nature, 433, 45
- McNamara et al. (2000) McNamara B. R., Wise M., Nulsen P. E. J., et al., 2000, ApJL, 534, L135
- Merloni (2004) Merloni A., 2004, MNRAS, 353, 1035
- Mihos & Hernquist (1994) Mihos J. C., Hernquist L., 1994, ApJL, 425, L13
- Mihos & Hernquist (1996) Mihos J. C., Hernquist L., 1996, ApJ, 464, 641
- Mo et al. (1998) Mo H. J., Mao S., White S. D. M., 1998, MNRAS, 295, 319
- Norberg et al. (2002) Norberg P., Cole S., Baugh C. M., et al., 2002, MNRAS, 336, 907
- Nulsen (1986) Nulsen P. E. J., 1986, MNRAS, 221, 377
- Nulsen & Fabian (2000) Nulsen P. E. J., Fabian A. C., 2000, MNRAS, 311, 346
- Olive et al. (2000) Olive K. A., Steigman G., Walker T. P., 2000, PhysRep, 333, 389
- Omma et al. (2004) Omma H., Binney J., Bryan G., Slyz A., 2004, MNRAS, 348, 1105
- Peacock et al. (2001) Peacock J. A., Cole S., Norberg P., et al., 2001, Nature, 410, 169
- Percival et al. (2002) Percival W. J., Sutherland W., Peacock J. A., et al., 2002, MNRAS, 337, 1068
- Perlmutter et al. (1999) Perlmutter S., Aldering G., Goldhaber G., et al., 1999, ApJ, 517, 565
- Peterson et al. (2001) Peterson J. R., Paerels F. B. S., Kaastra J. S., et al., 2001, A&A, 365, L104
- Popesso et al. (2005) Popesso P., Biviano A., Böhringer H., Romaniello M., 2005, A&A, accepted, astro-ph/0506201
- Rees & Ostriker (1977) Rees M. J., Ostriker J. P., 1977, MNRAS, 179, 541
- Reeves et al. (2003) Reeves J. N., O’Brien P. T., Ward M. J., 2003, ApJL, 593, L65
- Riess et al. (1998) Riess A. G., Filippenko A. V., Challis P., et al., 1998, AJ, 116, 1009
- Ruszkowski & Begelman (2002) Ruszkowski M., Begelman M. C., 2002, ApJ, 581, 223
- Sanders & Mirabel (1996) Sanders D. B., Mirabel I. F., 1996, ARA&A, 34, 749
- Seljak et al. (2005) Seljak U., Makarov A., McDonald P., et al., 2005, PhRvD, 71, 10, 103515
- Seljak & Zaldarriaga (1996) Seljak U., Zaldarriaga M., 1996, ApJ, 469, 437
- Shaver et al. (1996) Shaver P. A., Wall J. V., Kellermann K. I., Jackson C. A., Hawkins M. R. S., 1996, Nature, 384, 439
- Silk (1977) Silk J., 1977, ApJ, 211, 638
- Somerville & Primack (1999) Somerville R. S., Primack J. R., 1999, MNRAS, 310, 1087
- Somerville et al. (2001) Somerville R. S., Primack J. R., Faber S. M., 2001, MNRAS, 320, 504
- Spergel et al. (2003) Spergel D. N., Verde L., Peiris H. V., et al., 2003, ApJS, 148, 175
- Springel (2005) Springel V., 2005, MNRAS, submitted, astro-ph/0505010
- Springel et al. (2005a) Springel V., Di Matteo T., Hernquist L., 2005a, MNRAS, 361, 776
- Springel & Hernquist (2003a) Springel V., Hernquist L., 2003a, MNRAS, 339, 289
- Springel & Hernquist (2003b) Springel V., Hernquist L., 2003b, MNRAS, 339, 312
- Springel et al. (2005b) Springel V., White S. D. M., Jenkins A., et al., 2005b, Nature, 435, 629
- Springel et al. (2001a) Springel V., White S. D. M., Tormen G., Kauffmann G., 2001a, MNRAS, 328, 726
- Springel et al. (2001b) Springel V., Yoshida N., White S. D. M., 2001b, New Astronomy, 6, 79
- Tabor & Binney (1993) Tabor G., Binney J., 1993, MNRAS, 263, 323
- Tamura et al. (2001) Tamura T., Kaastra J. S., Peterson J. R., et al., 2001, A&A, 365, L87
- Tegmark et al. (2004) Tegmark M., Strauss M. A., Blanton M. R., et al., 2004, PhRvD, 69, 10, 103501
- Thoul & Weinberg (1995) Thoul A. A., Weinberg D. H., 1995, ApJ, 442, 480
- Tremonti et al. (2004) Tremonti C. A., Heckman T. M., Kauffmann G., et al., 2004, ApJ, 613, 898
- Tully et al. (2002) Tully R. B., Somerville R. S., Trentham N., Verheijen M. A. W., 2002, ApJ, 569, 573
- van den Bergh (2000) van den Bergh S., 2000, The galaxies of the Local Group, Cambridge University Press
- Van Waerbeke et al. (2002) Van Waerbeke L., Mellier Y., Pelló R., Pen U.-L., McCracken H. J., Jain B., 2002, A&A, 393, 369
- White (1996) White S. D. M., 1996, in Cosmology and Large-Scale Structure, edited by R. Schaefer, J. Silk, M. Spiro, J. Zinn-Justin, Dordrecht: Elsevier, astro-ph/9410043
- White & Frenk (1991) White S. D. M., Frenk C. S., 1991, ApJ, 379, 52
- White et al. (1993) White S. D. M., Navarro J. F., Evrard A. E., Frenk C. S., 1993, Nature, 366, 429
- White & Rees (1978) White S. D. M., Rees M. J., 1978, MNRAS, 183, 341
- Xu (1995) Xu G., 1995, ApJS, 98, 355
- Yoshida et al. (2002) Yoshida N., Stoehr F., Springel V., White S. D. M., 2002, MNRAS, 335, 762
- Yu & Tremaine (2002) Yu Q., Tremaine S., 2002, MNRAS, 335, 965